Shiba Inu, Bitcoin Cash, The Sandbox Price Analysis: 5 November

Cryptocurrency prices gave mixed signals in the last 24 hours. Shiba Inu flashed bearish signs over the past week as showcased by its near-term technicals over the last day. BCH showed signs of revival as indicators slightly favored the bulls. Further, the Sandbox hit its ATH and may look at a possible correction.
Shiba Inu (SHIB)
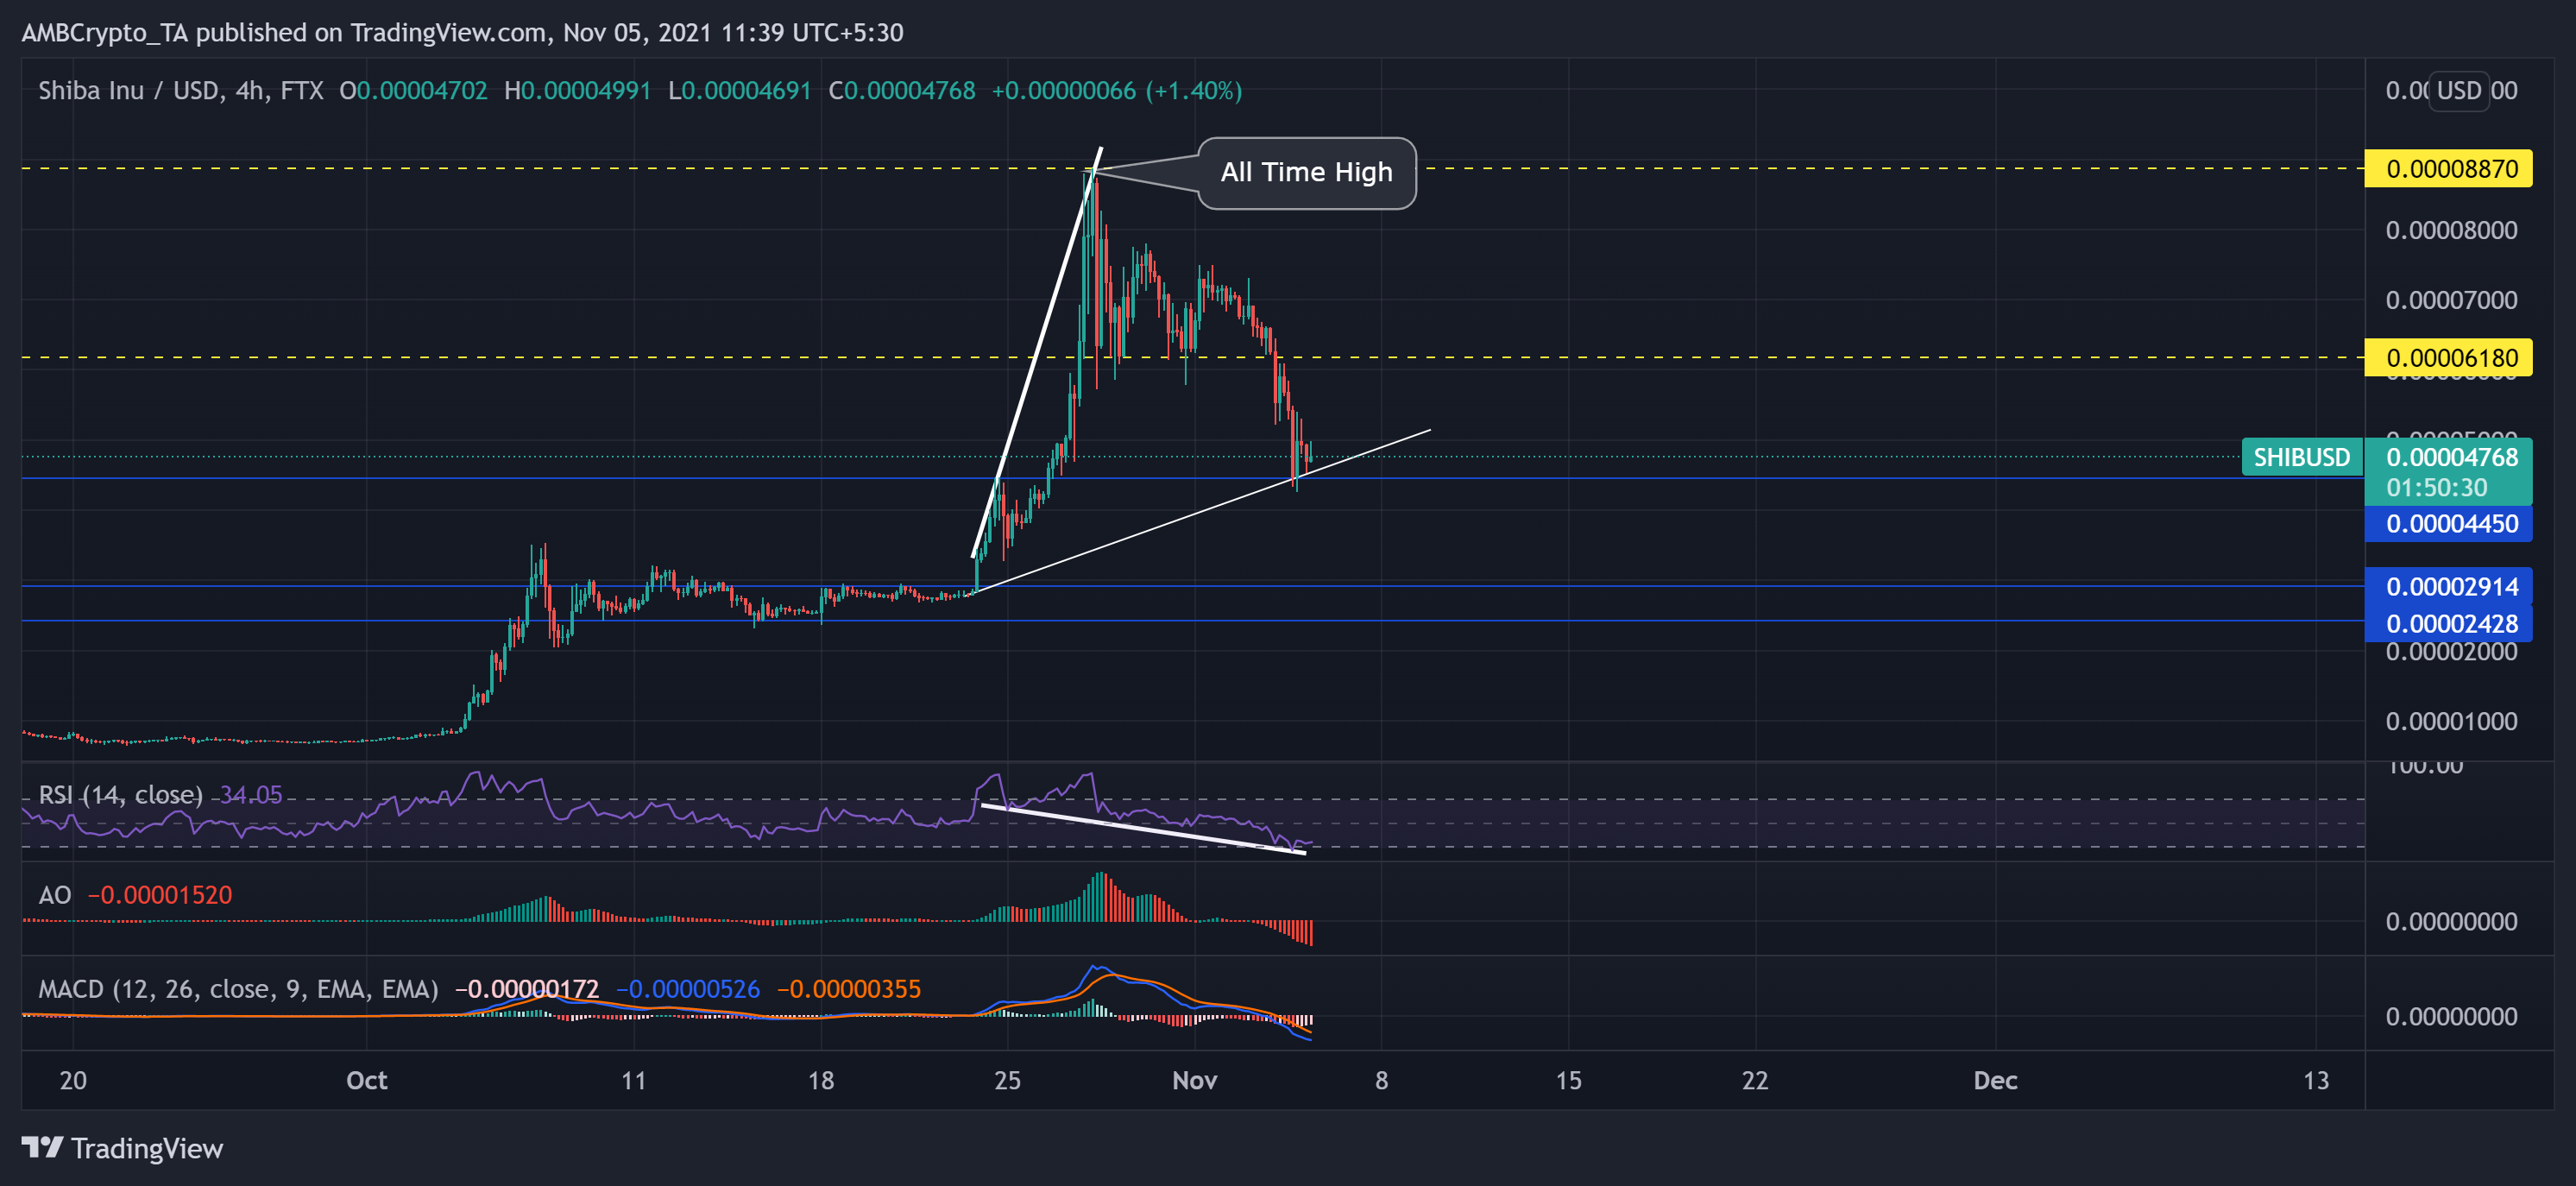
The dog-themed meme crypto undertook a bullish price action from 23 October. Consequently, it reached its ATH on 28 October at $0.0000887, after which it saw a pullback.
Over the last week, the price oscillated in a downtrend as the digital currency noted a nearly 34% decline (seven-day). SHIB bears visibly exerted sustained pressure by breaching the resistance point and found support at $0.0000445.
With profit-taking in full swing, the altcoin witnessed a 40% increase in trading volumes over the last day. Accordingly, the token registered a nearly 15% decline in 24 hours as near-term technicals preferred the bears. At press time, SHIB traded at $0.00004768.
Over the past two days, the Relative Strength Index (RSI) plunged from the midline toward the oversold territory at the 34-mark. Also, the Awesome Oscillator (AO) flashed longer red bars, reiterating the increased selling power.
Additionally, the MACD showed a preference for the sellers as well. However, the shorter light green bars on its histogram may hint at possible ease in bearish momentum.
Bitcoin Cash (BCH)
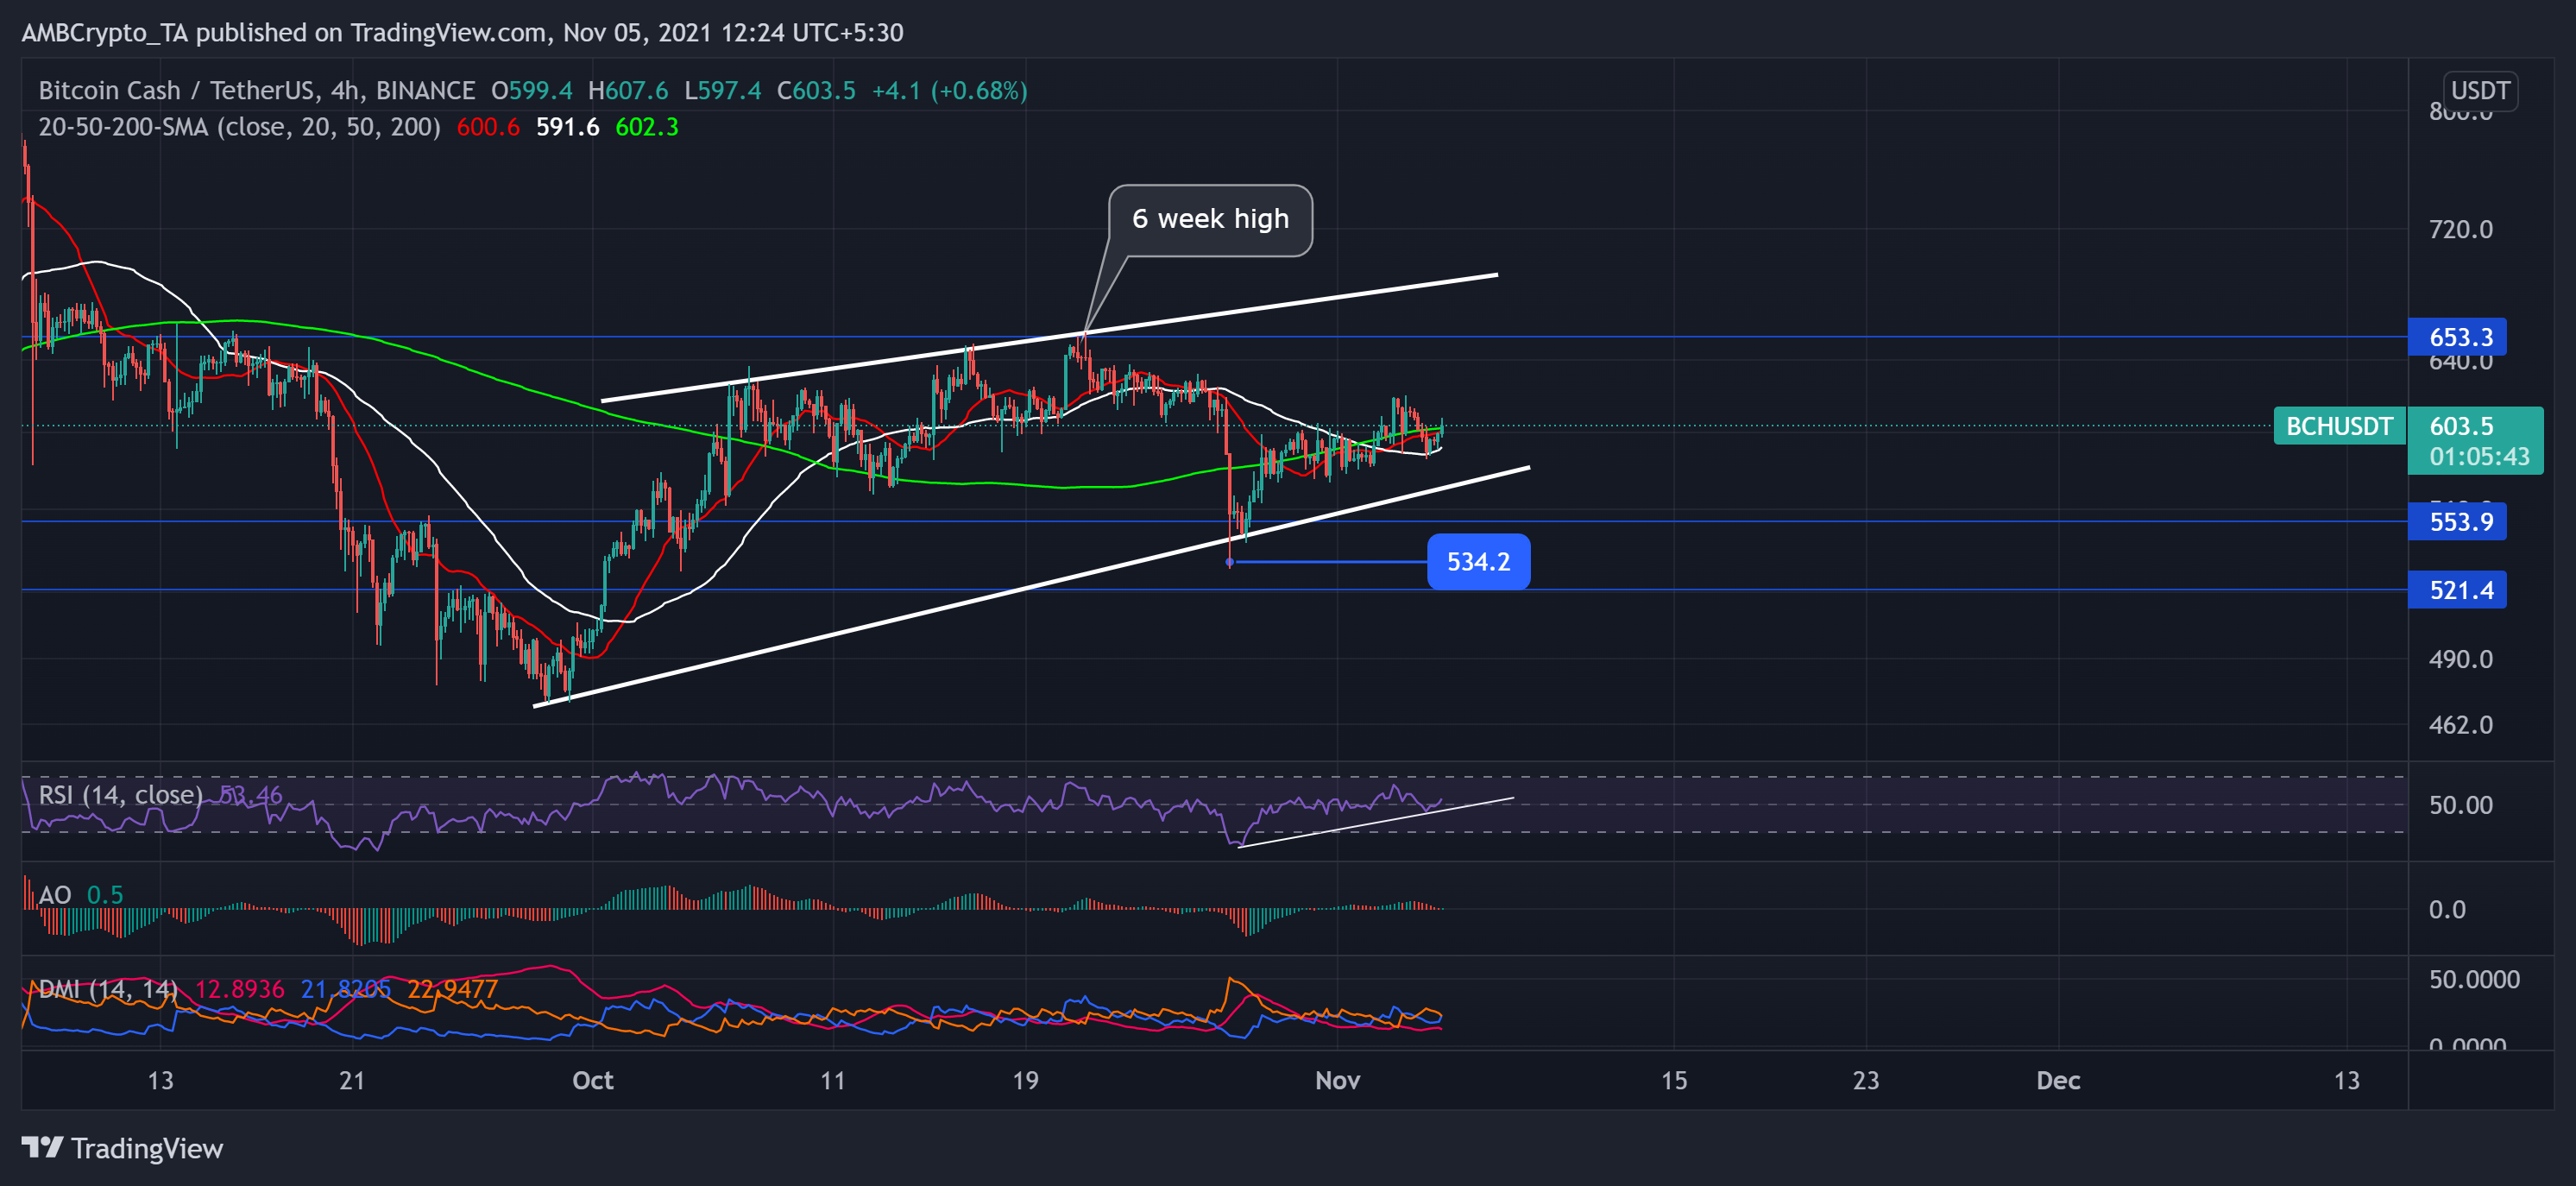
After hitting its six-week high on 21 October, BCH price-action witnessed a blip as it fell to its 26-day low at $534.2 on 27 October. Since then, BCH bulls displayed their vigor as the digital currency noted a nearly 5% seven-day ROI.
BCH bears have shown resistance at the $653-mark in the near term. The altcoin traded at $603.5 at press time. Near-term technicals suggested slight ease in the power of sellers.
The RSI stood above the half-line and seemed to follow an uptrend over the past week. The AO flashed a green signal, depicting ease in bearish momentum. The DMI lines seemed to be on the verge of a bullish crossover. However, the ADX stood at the 12-mark and outlined a weak directional trend.
The Sandbox (SAND)
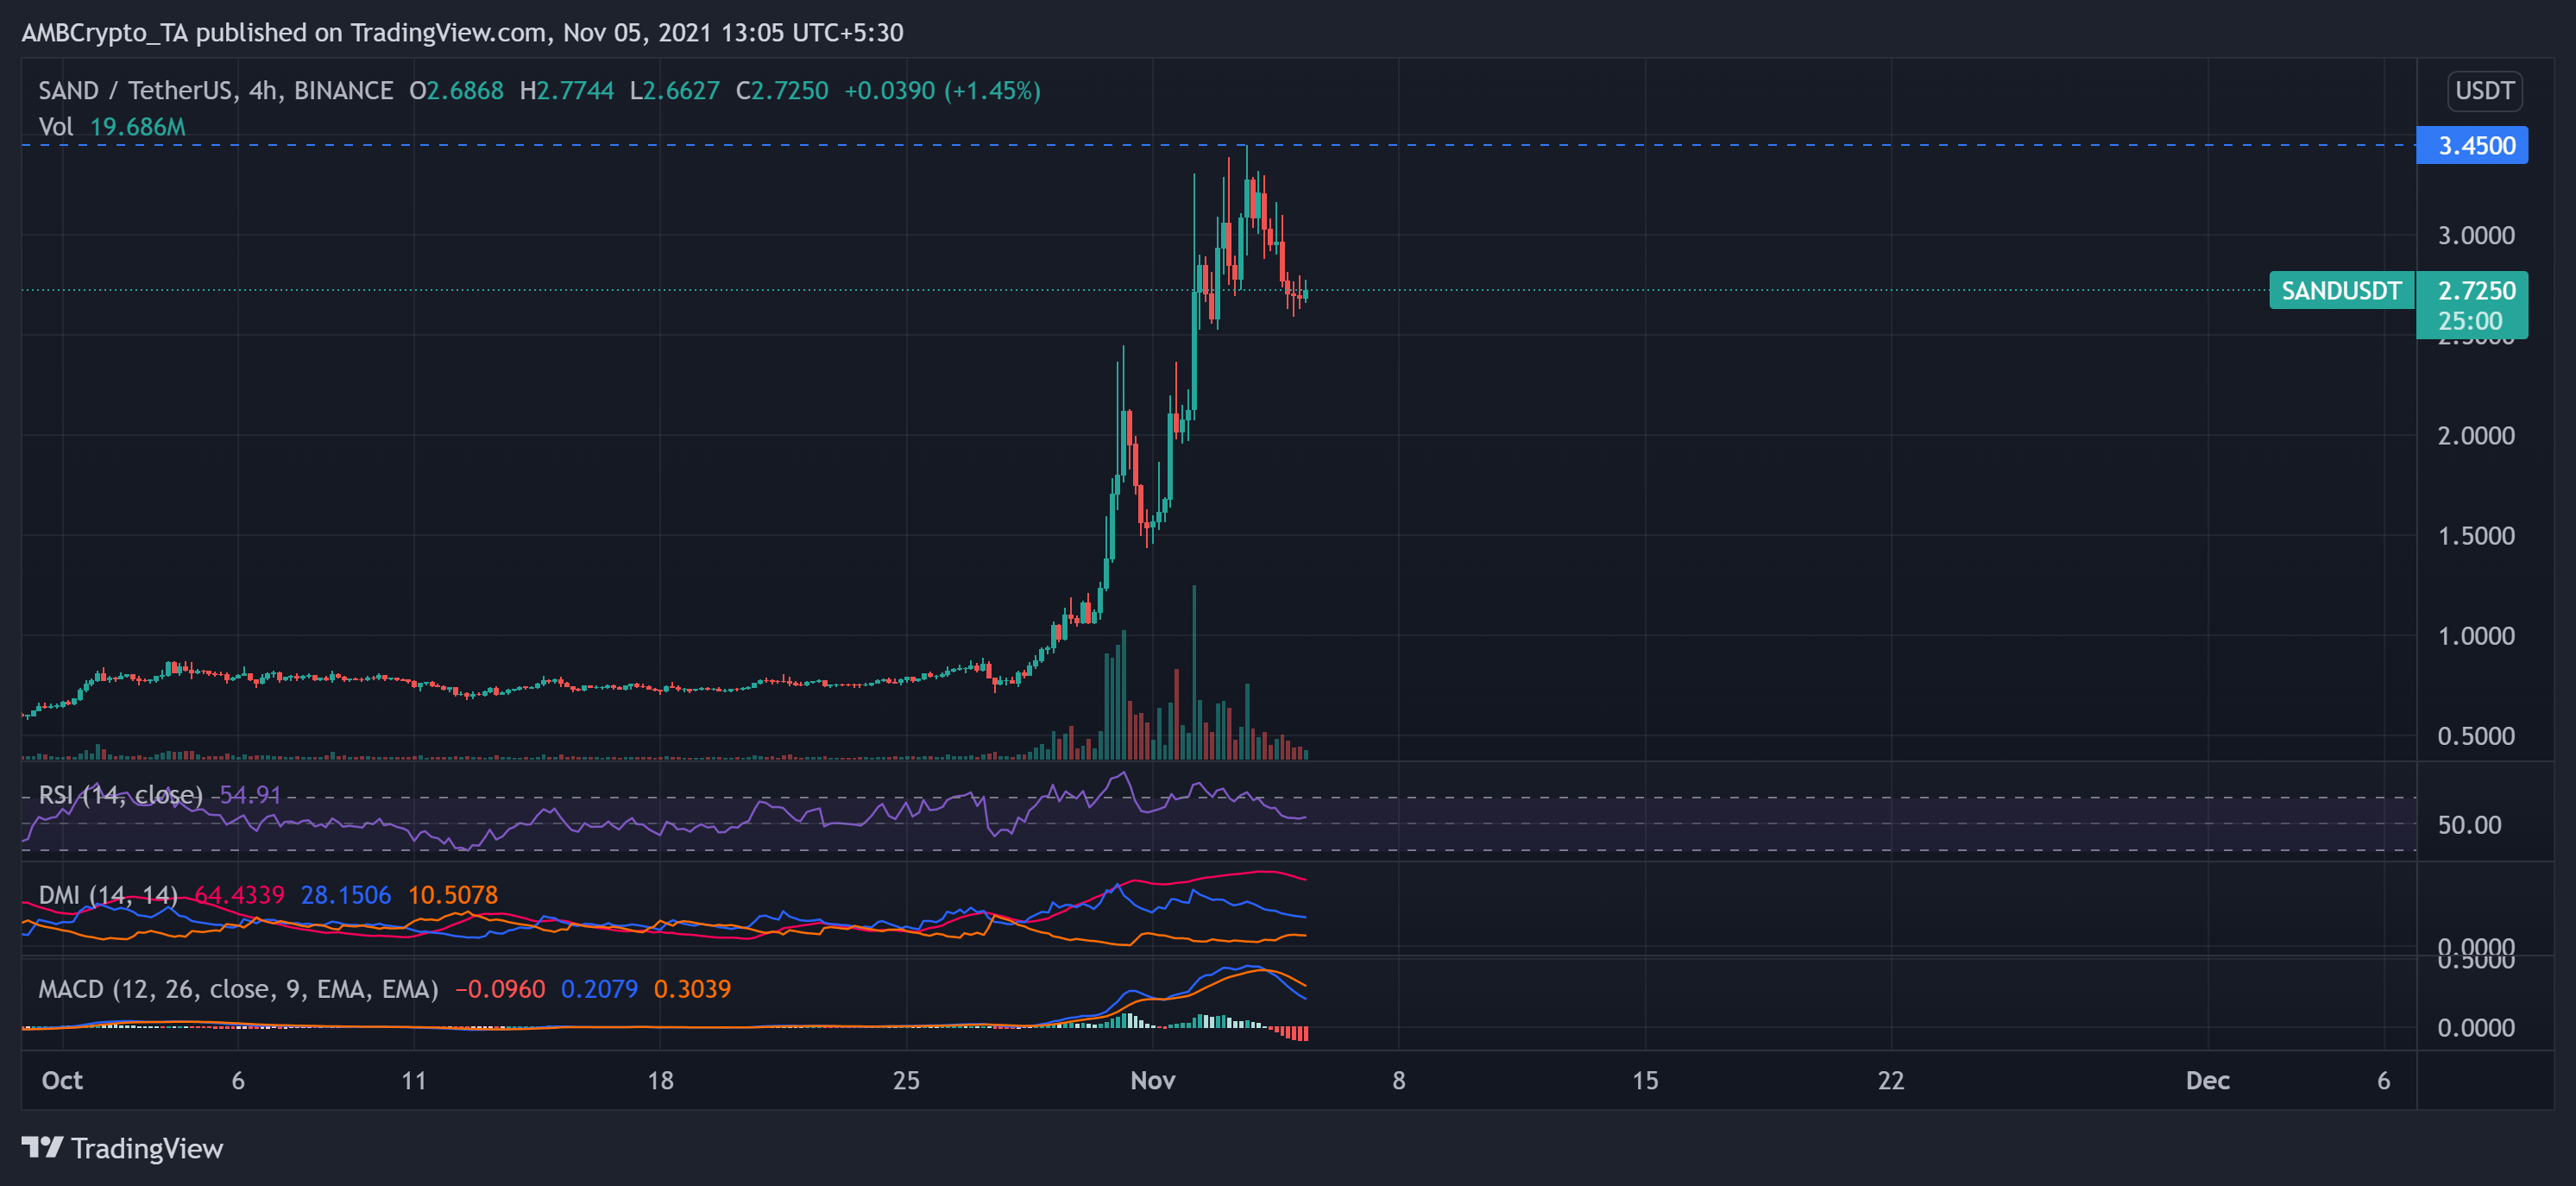
The Ethereum-powered play-to-earn metaverse gaming platform noted a staggering 235.42% and 135.63% monthly and weekly ROI, respectively. Since Facebook rebranded to Meta, the alt was on a bullish trajectory. Consequently, it poked its ATH on 3 November shortly after the fruition of its funding round.
The alt registered an 8.7% decline in the last 24 hours as near-term technicals suggested a possible correction. At press time, SAND traded at $2.725. The RSI plunged by 15 points over the last day but stood above the midline.
MACD lines depicted a bearish momentum while the histogram flashed red signals. However, the DMI preferred the buyers with a high ADX.


