


On its way up from its January lows, Shiba Inu (SHIB) buyers steered the overall outlook in their favor. The sellers are now building up tension at the $0.024-level resistance. (SHIB prices are multiplied by 1000 from here, for brevity)
A sustained close below the long-term liquidity range (Point of Control/POC) would set SHIB for a retest of its trendline support (white, dashed). At press time, the alt traded at $0.02469, up by 3.28% in the last 24 hours.
SHIB 4-hour chart
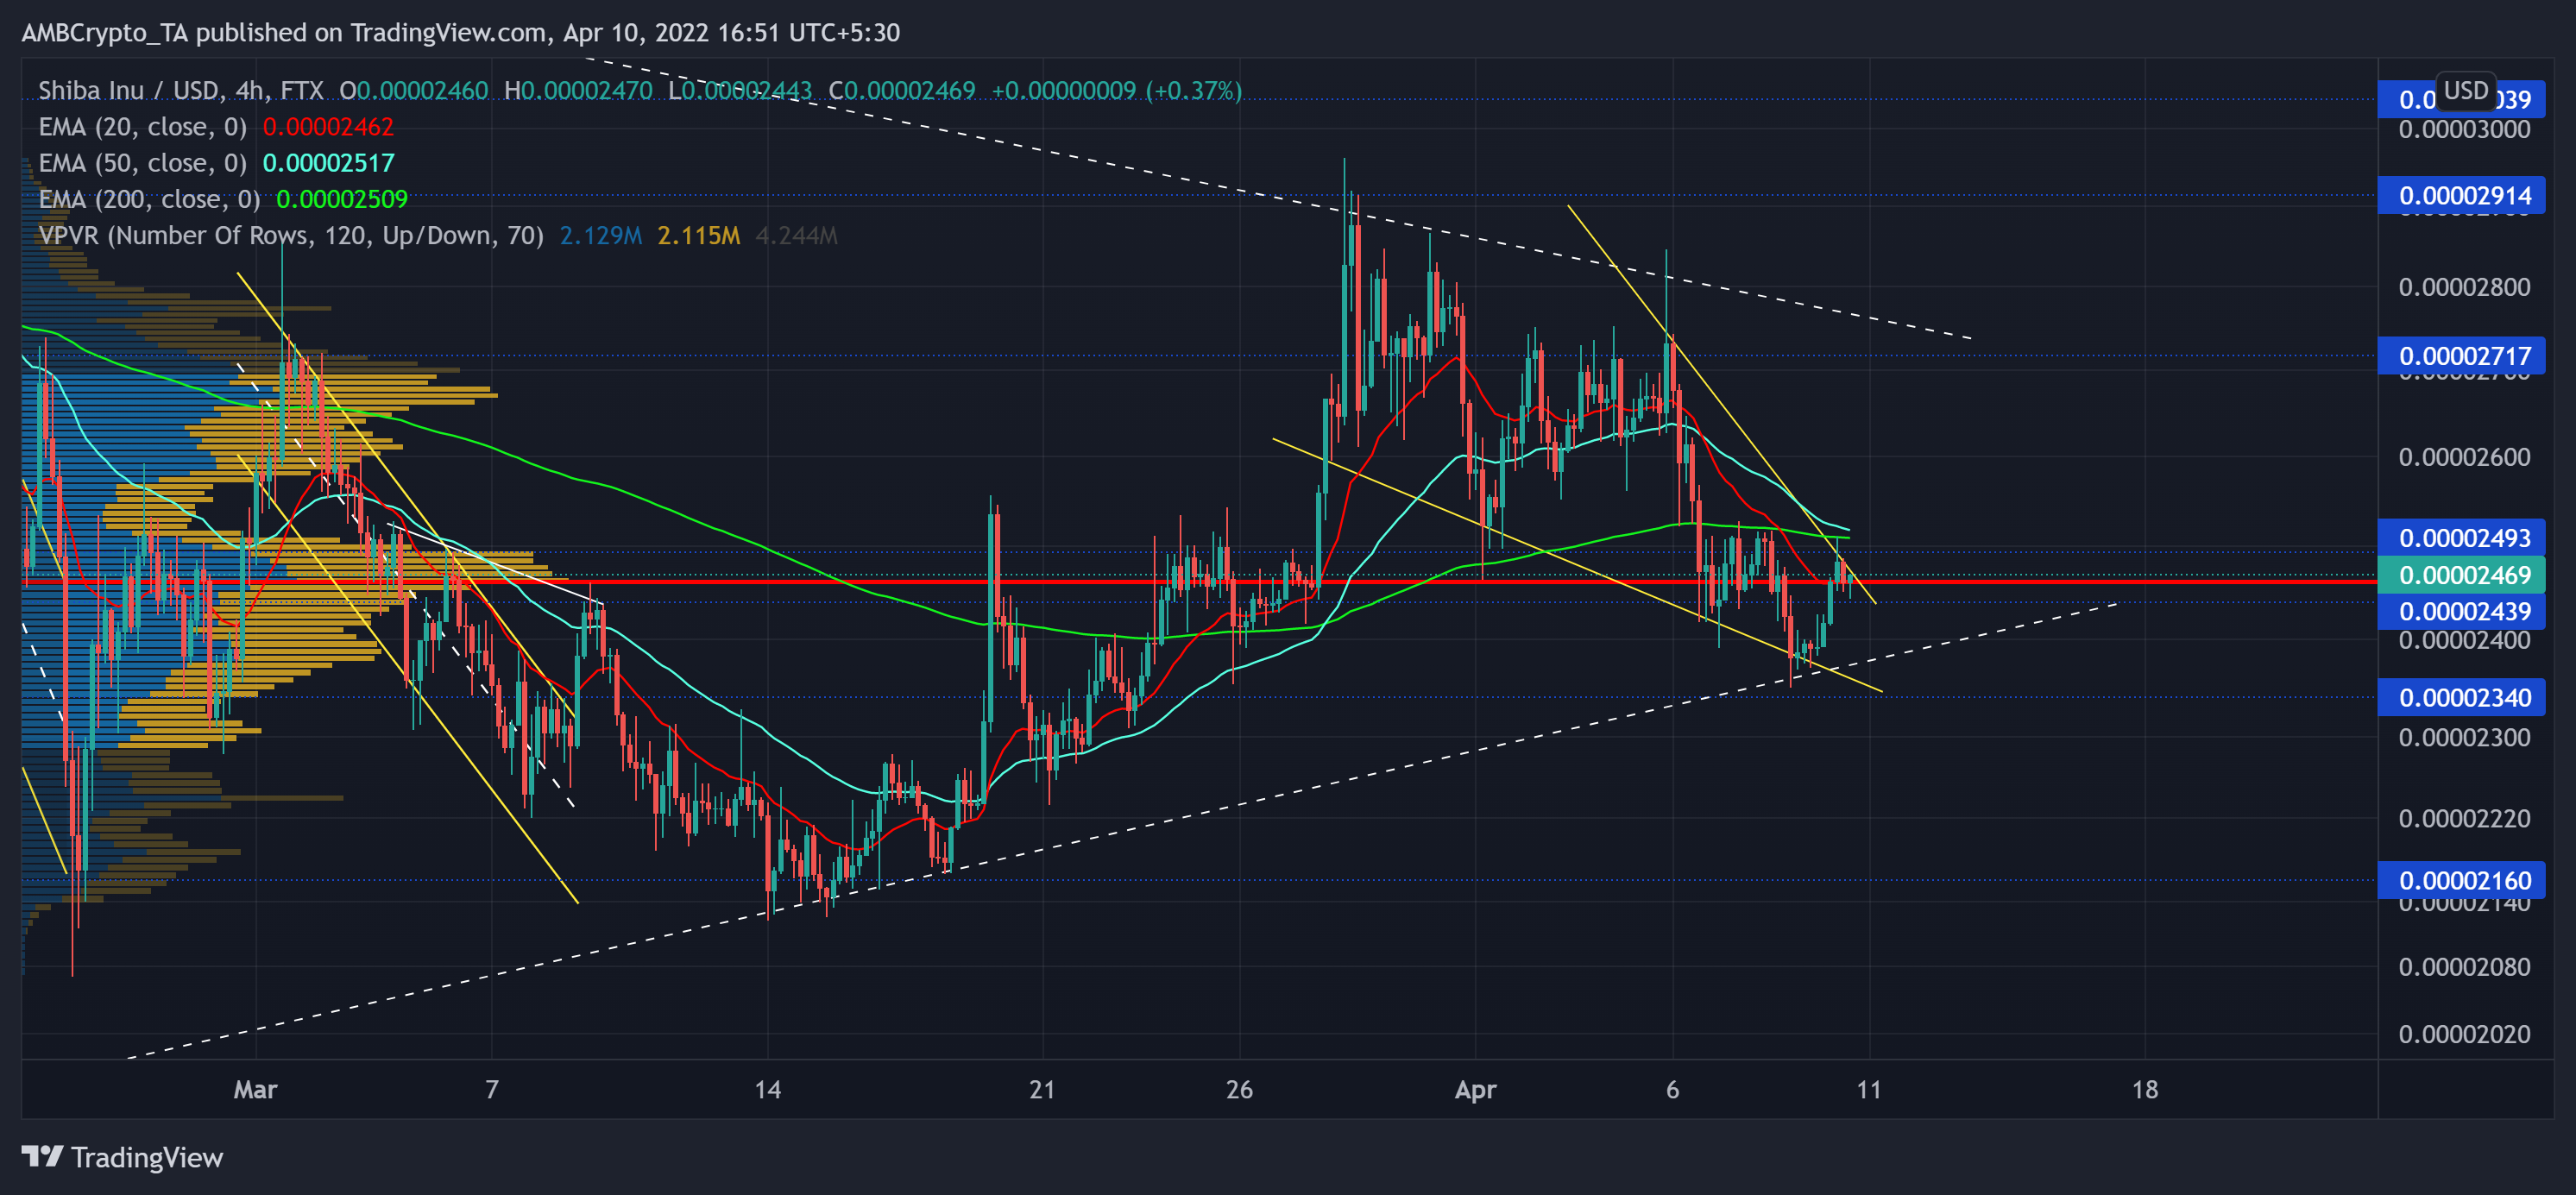
Soon after the alt hit its multi-month low on 22 January, the buyers took charge of the five-month support from the $0.018-mark. Then, SHIB bulls initiated a rally that led the alt to double its value before reversing from its long-term ceiling of $0.034-level.
During this phase, the bulls have ensured higher troughs while the bears kept the peaks in their influence. Recent movements have favored the bears as SHIB fell in a falling wedge (yellow) and fell below its 50/200 EMA. Meanwhile, the 20 EMA (red) fell below the 200 EMA and affirmed a bearish advantage.
If the sellers capitalize on the current momentum, they could aim to test the $0.023-zone and prolong the current squeeze phase. Any possible recovery from there would find a barrier at the POC before the bulls gather enough thrust to overturn the EMAs.
Rationale

After witnessing a bullish divergence with price, the RSI saw a solid recovery. But the mid-line shunned this rally whilst the sellers still refrained from losing their edge on influencing the current price. Nevertheless, the CMF depicted a position that inclined toward the bulls. Any reversals in its revival could affirm a hidden bearish divergence with the price.
Conclusion
Any close above the current wedge could propel a test of the $0.25-zone. But a close below the POC would lead to a continued tight phase towards the $0.23-mark before the bulls retest the upper trendline of the falling wedge.
However, the meme-coin shares a staggering 94% 30-day correlation with Bitcoin. Thus, keeping an eye on the king coin’s movement remains essential for a profitable move.