Shiba Inu, Chainlink, MANA Price Analysis: 17 February

While the broader market slightly plunged in the last 24-hours, Shiba Inu entered into a tight phase after breaking out of its symmetrical triangle. It continued to be in a weak directional zone. Similarly, MANA was range bound over the last day while revealing decreasing buying influence.
On the other hand, Chainlink needed to defend its 20 SMA to prevent a retest of its Point of Control near the $15.6-level.
Shiba Inu (SHIB)
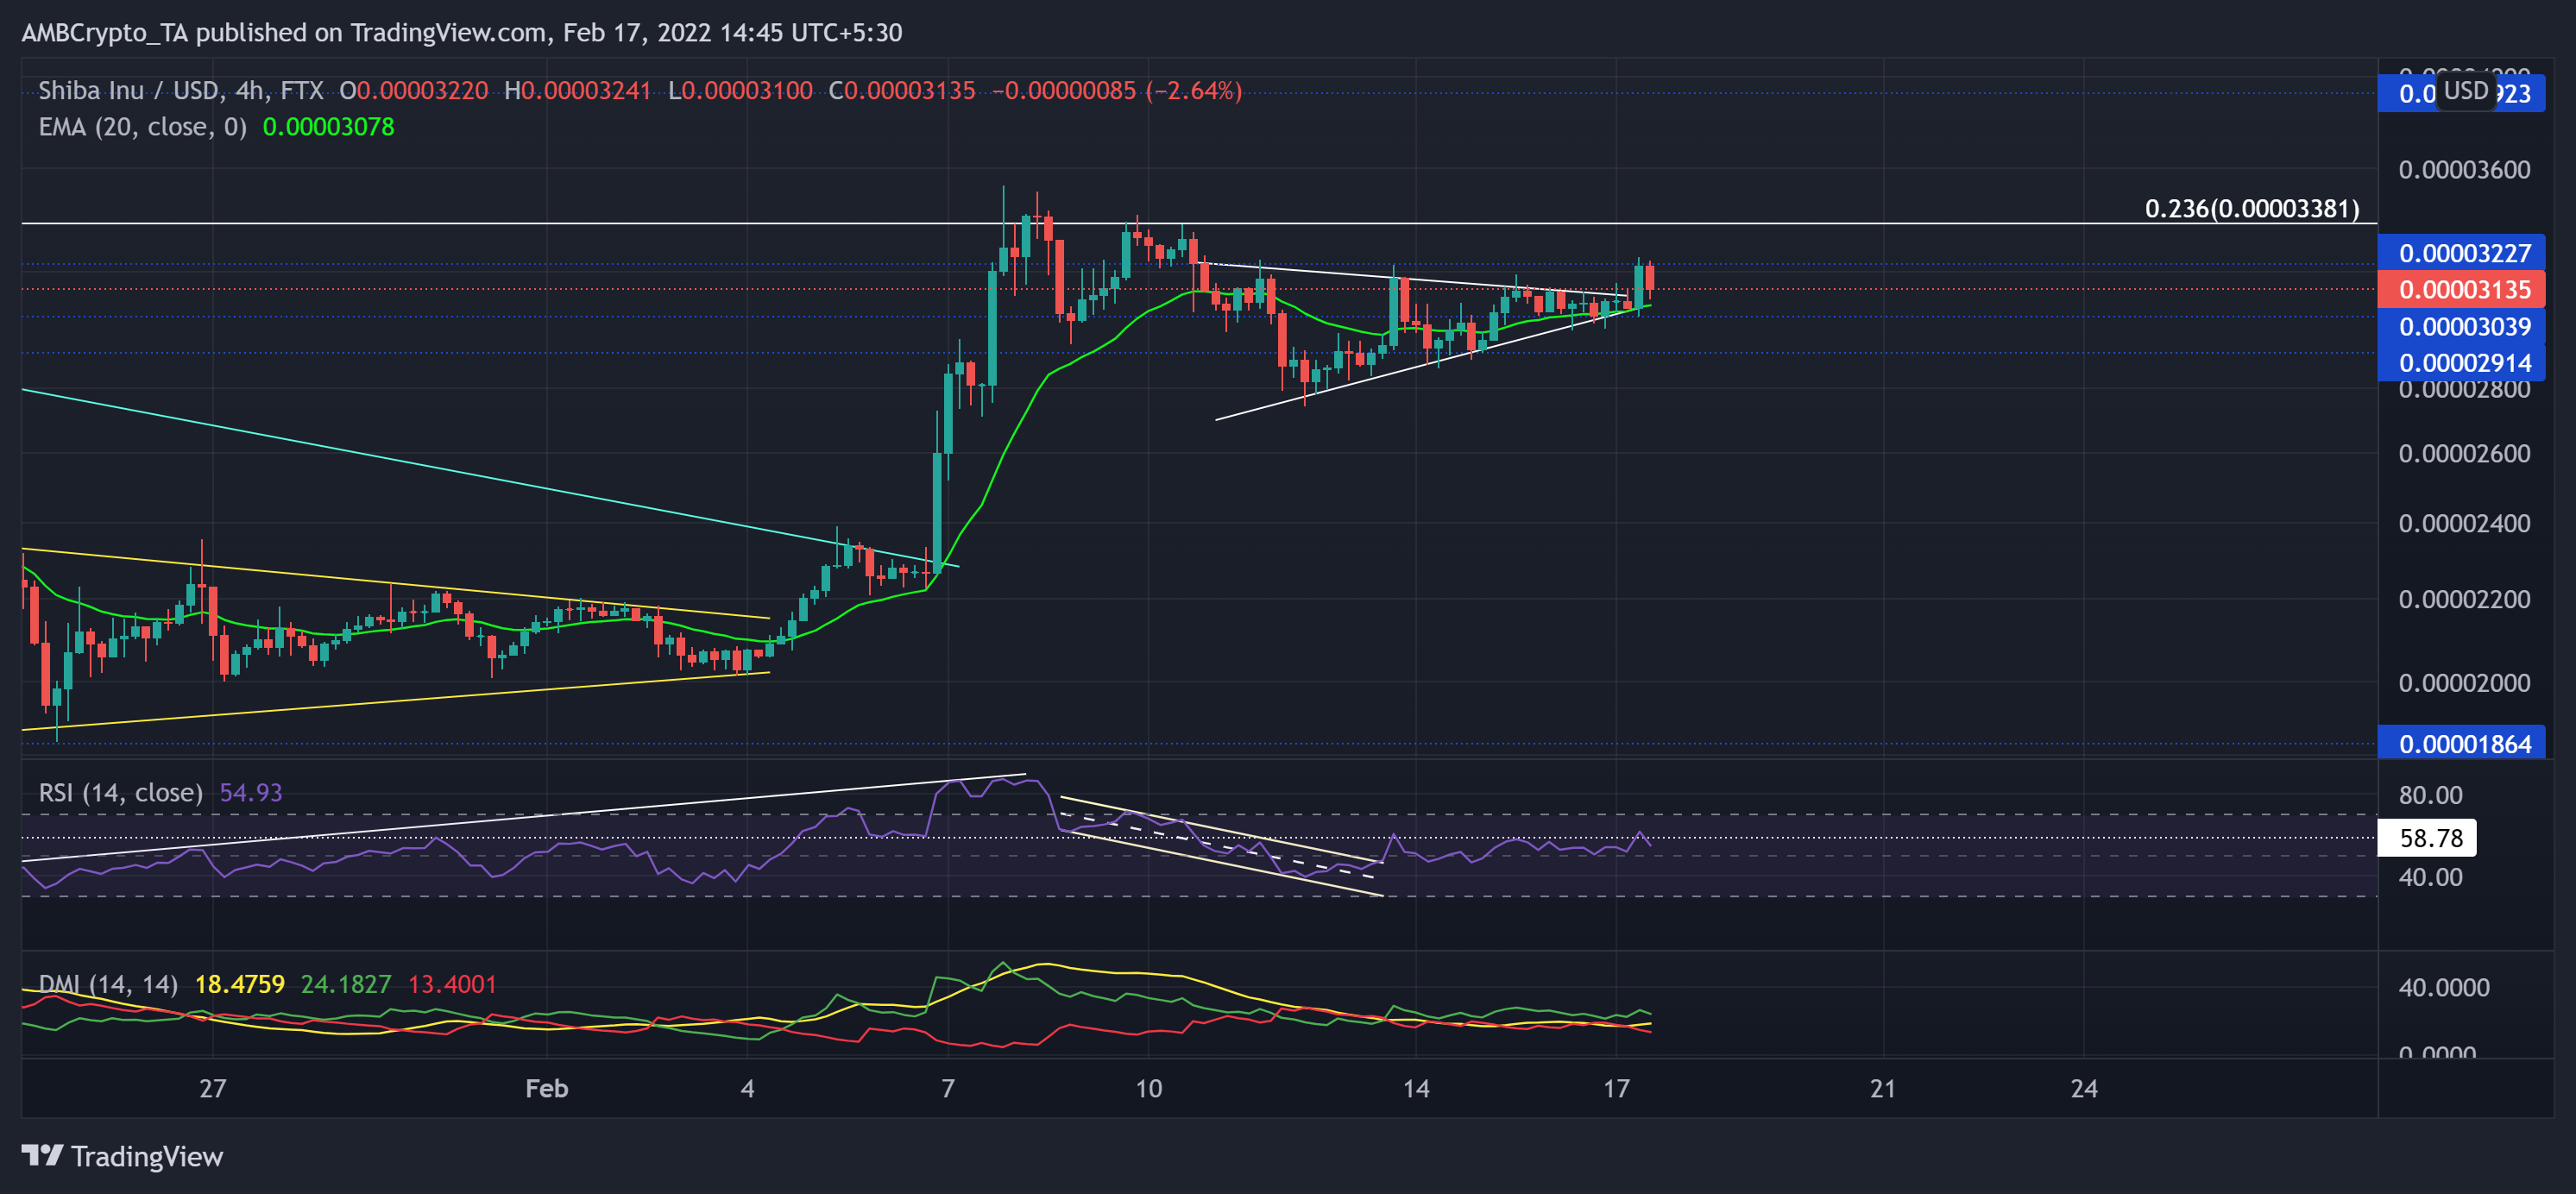
As the alt hit its three-month low on 22 January, the buyer stepped in at the $0.000018-mark. Since then, SHIB bulls initiated a recovery and breached the trendline resistance (cyan).
Consequently, the bulls tested the 23.6% Fibonacci resistance after a staggering 75.5% ROI (from 4 February low). Since then, SHIB saw a symmetrical triangle (white) as it reclaimed the $0.00003-support. Any close below the 20 EMA (green) would propel a $0.000029-mark retest.
At press time, SHIB was trading at $0.0000313. After descending in a down-channel toward its oversold region, the RSI saw an expected patterned breakout that tested 58-point resistance. From here on, defending the half-line is crucial to prevent a retest of the $0.0000291-mark. Although the DMI lines flashed a bullish bias, the ADX still depicted a weak directional trend for SHIB.
Chainlink (LINK)

LINK bulls lost control after losing the crucial $25.75-mark resistance (previous support). Thus, the alt plunged by 53.09% (from 11 January) to hit its six-month low on 24 January. However, the bulls finally showed up at the $13.96-mark as the alt recorded over 43% gains in an ascending channel (white).
Over the past week, it saw a patterned breakdown and lost the crucial $16.6-level. A sustained close below the 20 SMA (cyan) would cause a possible retest near its Point of Control (red).
At press time, the LINK was trading at $16.6. The RSI lost its half-line support after poking the 60-level on 16 February. Further retracements would find support at the 45-point. However, the CMF was northbound and still displayed a bullish preference, keeping the bullish hopes intact.
Decentraland (MANA)
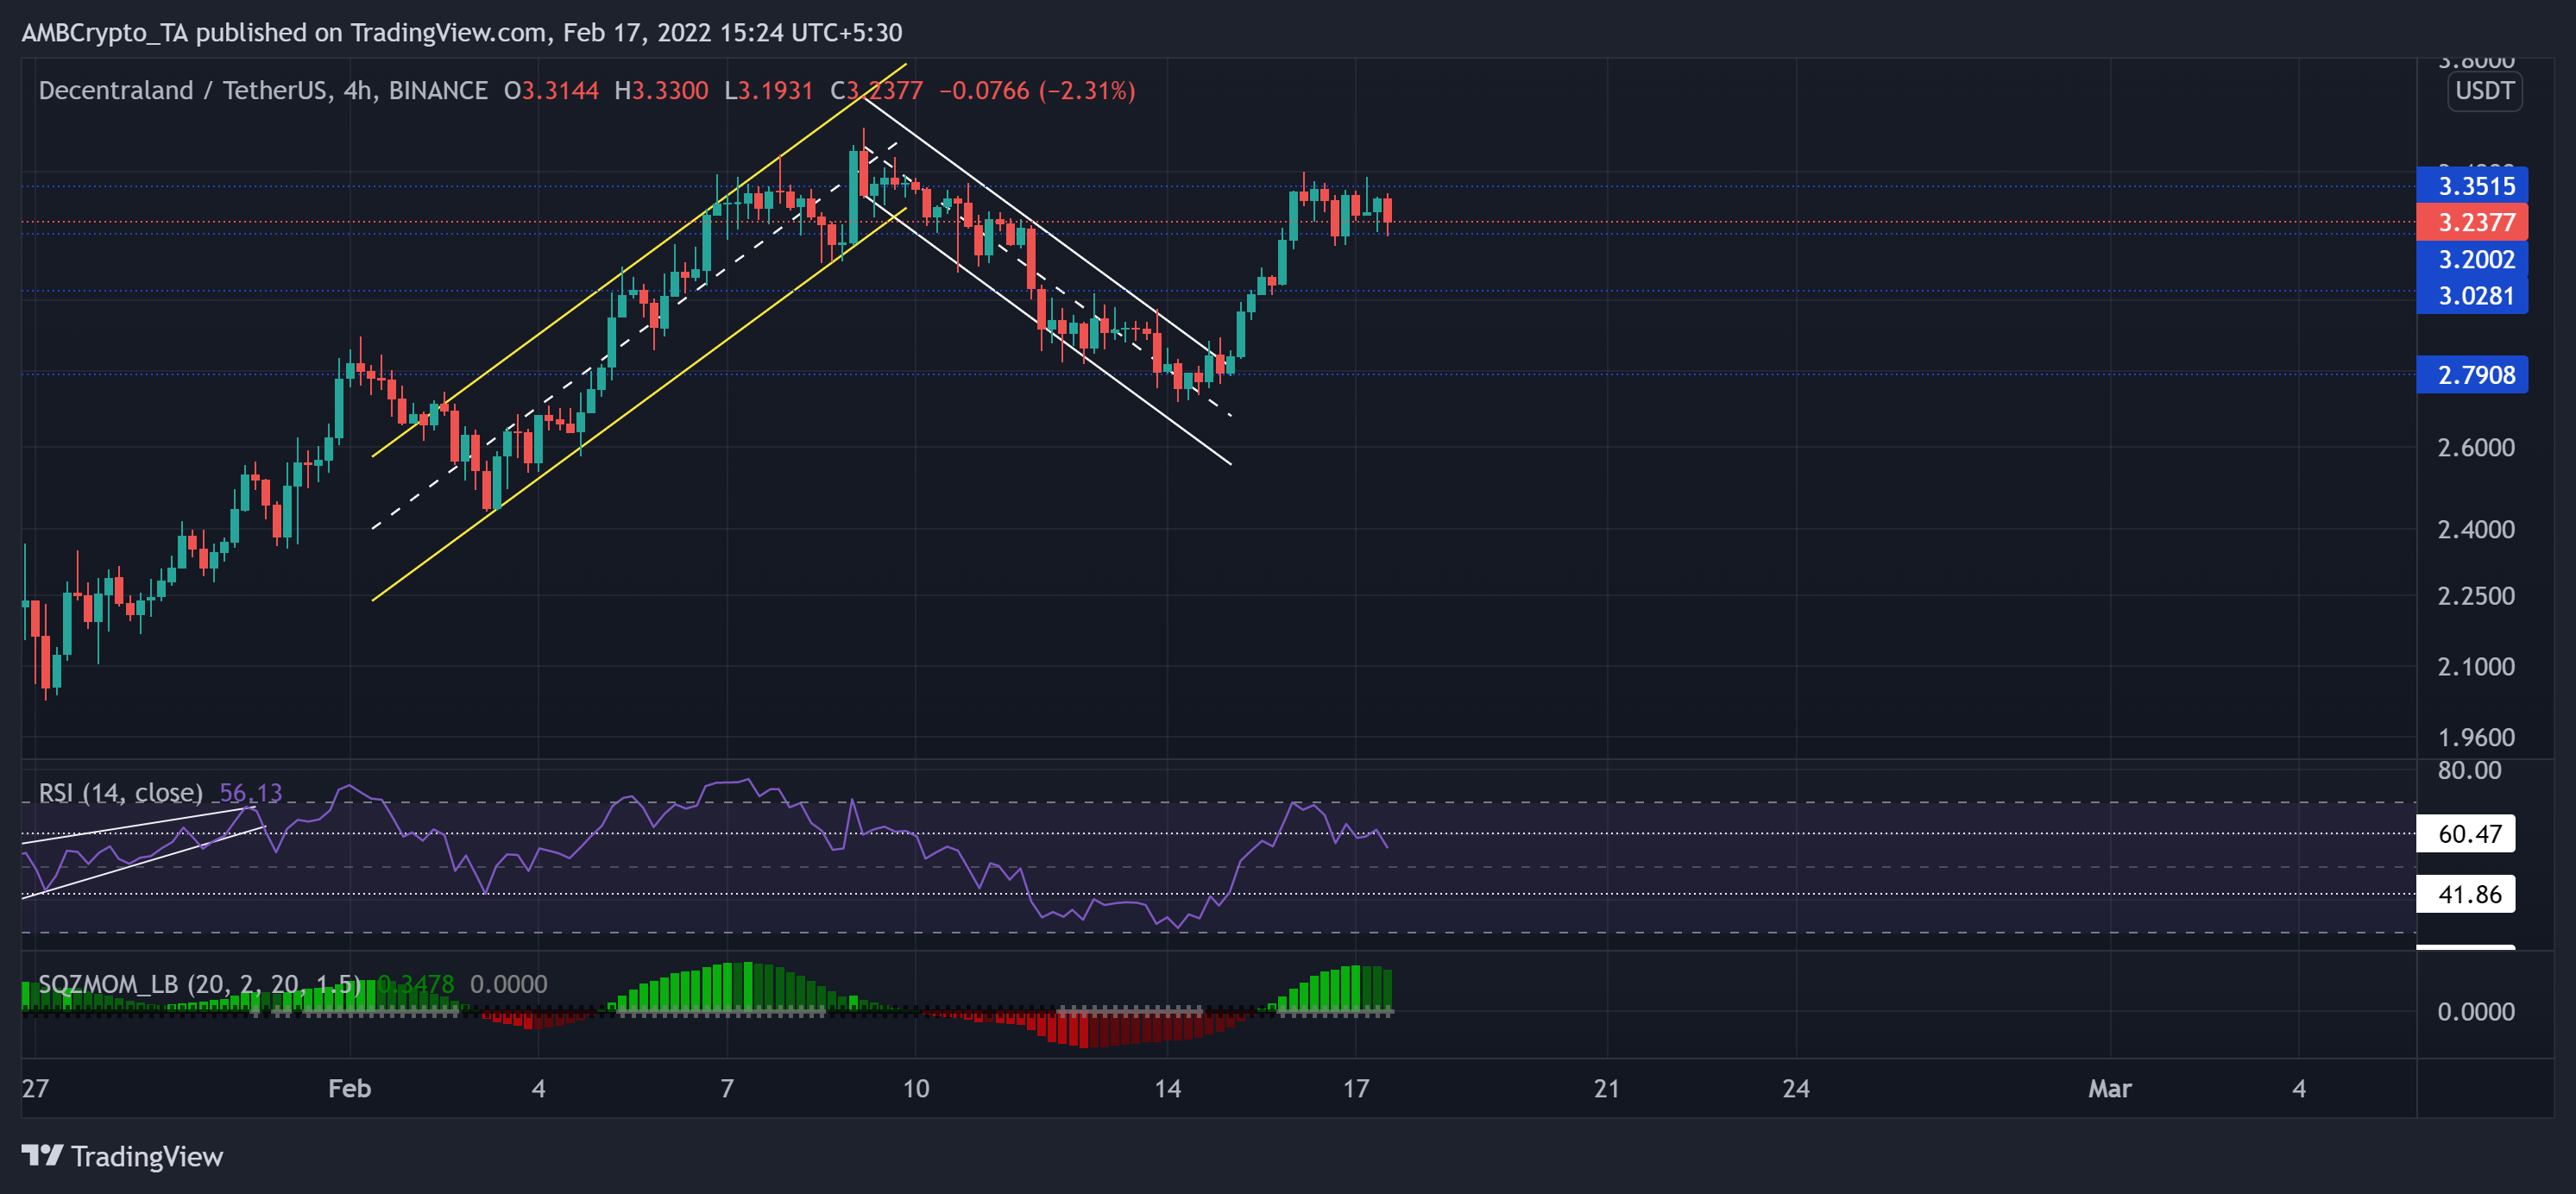
After a nearly 46% loss (from 17 January), it pulled back until its 11-week low on 22 January. Since then, the alt saw a staggering 107.4% ROI until 10 February.
While the $3.3-resistance stood sturdy for over a month, MANA witnessed an up-channel (yellow) breakdown and tested the $2.7-mark. Since then, it broke out of another channel and found an oscillating range between $3.3-$3.2 over the last day. Any close below its immediate support could lead to a $3-mark test.
At press time, MANA was trading at $3.23. Since falling from the overbought region, the RSI now aimed to challenge the half-line support. To top it up, the Squeeze Momentum Indicator hinted at a high volatility phase.