Shiba Inu demand remains weak – Will more losses follow?
The $0.0000154-$0.0000157 region remains a short-term target for SHIB.

- The 1-day price chart showed further losses were likely, but the H4 chart disagreed.
- A lack of demand meant that the 9% bounce in the past ten days could quickly reverse.
The withdrawal of 151.61 billion Shiba Inu [SHIB] tokens from Coinbase, worth $2.41 million, was an interesting development. Sustained outflows of the memecoin would be a good sign of accumulation across the market.
The daily price action remained bearish, but there was a market structure shift on the 4-hour chart. Was there enough demand to sustain this lower timeframe shift, or should traders brace for more losses?
Shiba Inu OBV at key juncture

The $0.00002 bullish breaker block had already been flipped to resistance before the early February sell-off.
The next support level was at $0.00001288, but the consolidation around $0.000016 in October 2024 highlighted it as another demand zone.
The OBV was below the lows from October, even though the price was at the lows. This indicated intense selling pressure over the past two months.
The OBV was unable to scale the October lows, and this could delay bullish efforts at a recovery. The RSI was also below 50 to highlight bearish dominance.
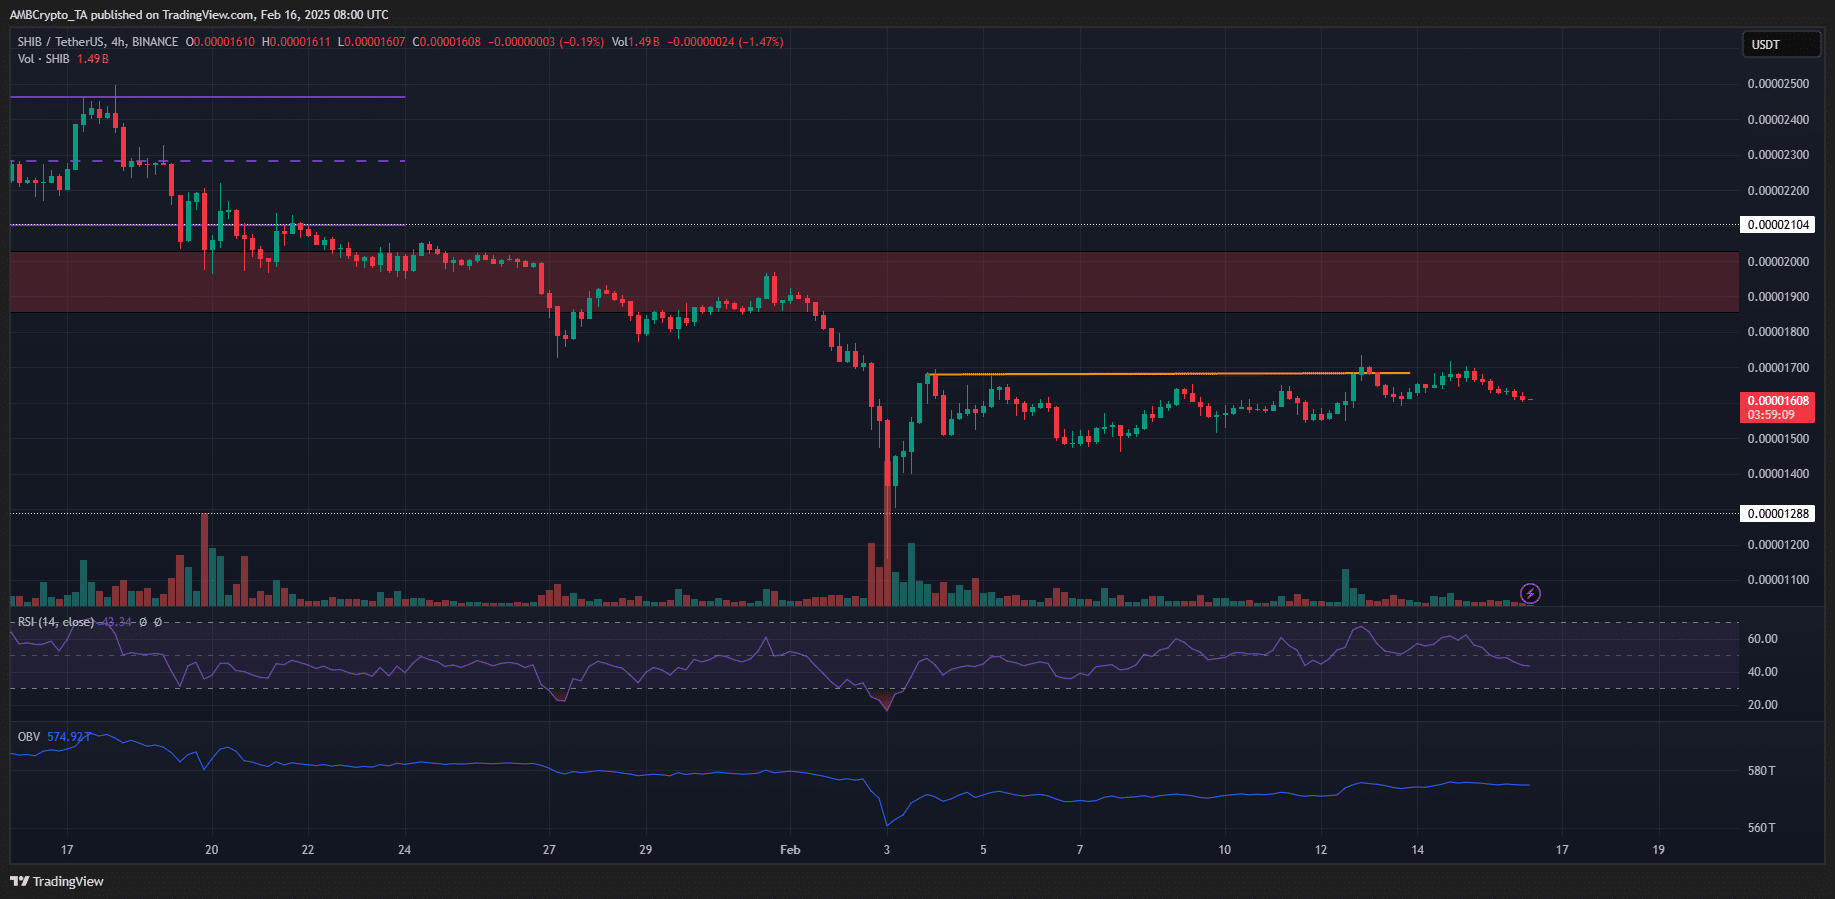
On the H4 chart, a bullish market structure break (orange) was seen. Alongside this, the price has made higher lows over the past week.
The OBV, which we saw at the October lows on the daily chart, has slowly trended higher.
Sustained buying pressure could push prices higher, but it was unclear if that would arrive over the coming days.
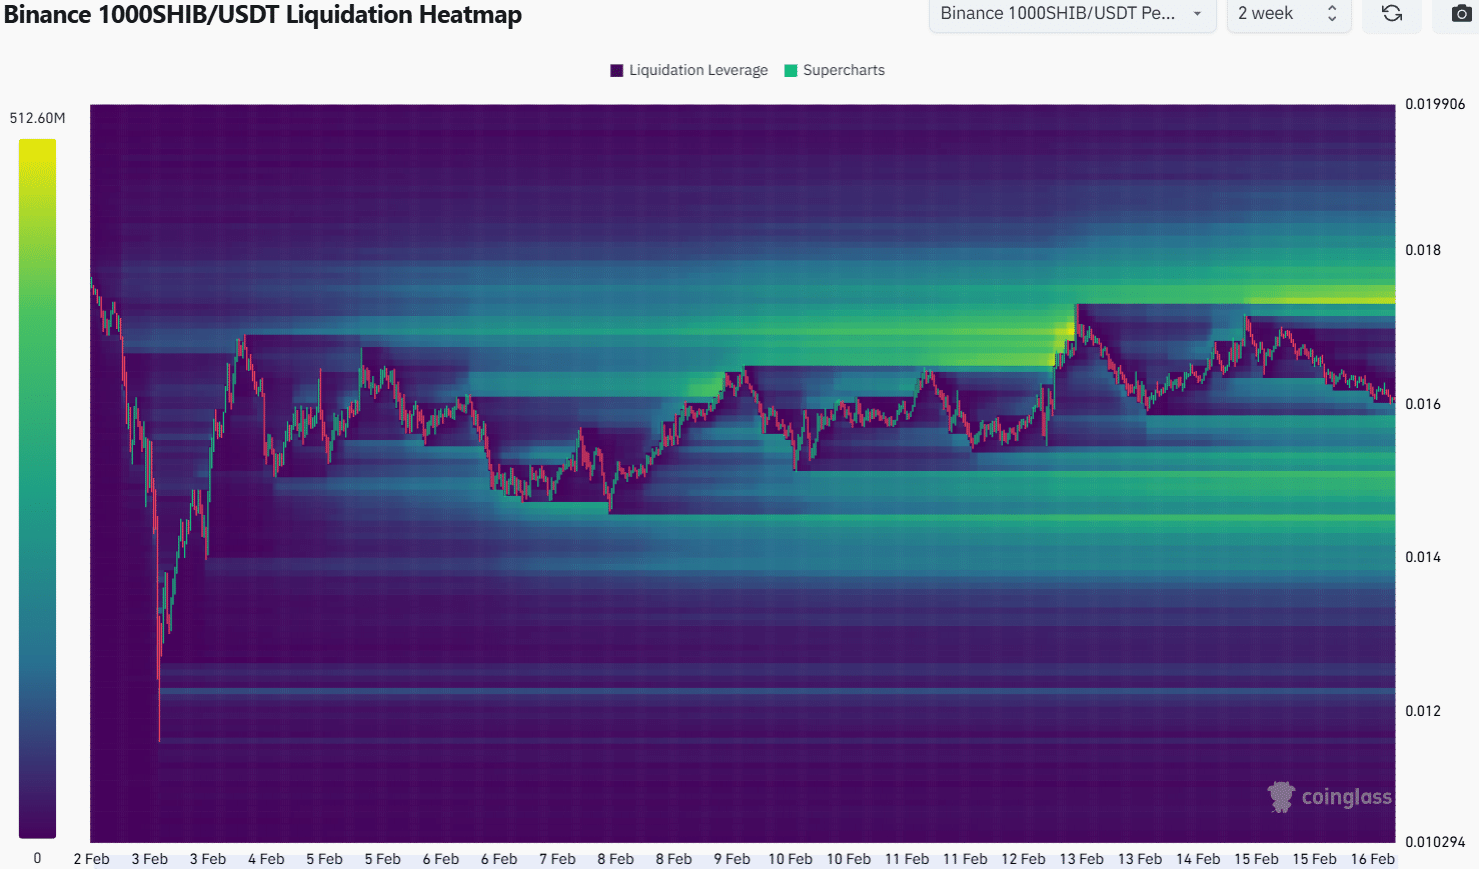
The liquidation heatmap from the bounce from the local lows earlier this month showed that the $0.0000154-$0.0000157 region was a short-term target.
The $0.0000174 was a magnetic zone to the north, another short-term price target.
This level was just above the local highs seen on the 4-hour chart. Hence, traders already in a long position could book profits at this level, as the market-wide sentiment was not bullish in the short term.
Disclaimer: The information presented does not constitute financial, investment, trading, or other types of advice and is solely the writer’s opinion