Shiba Inu: Don’t rule out THIS possibility from SHIB’s price because…
Market participants have defied the trend and continued to accumulate more SHIB.

- Shiba Inu has seen a hike in market volatility.
- Despite the risk of price decline, coin accumulation persists.
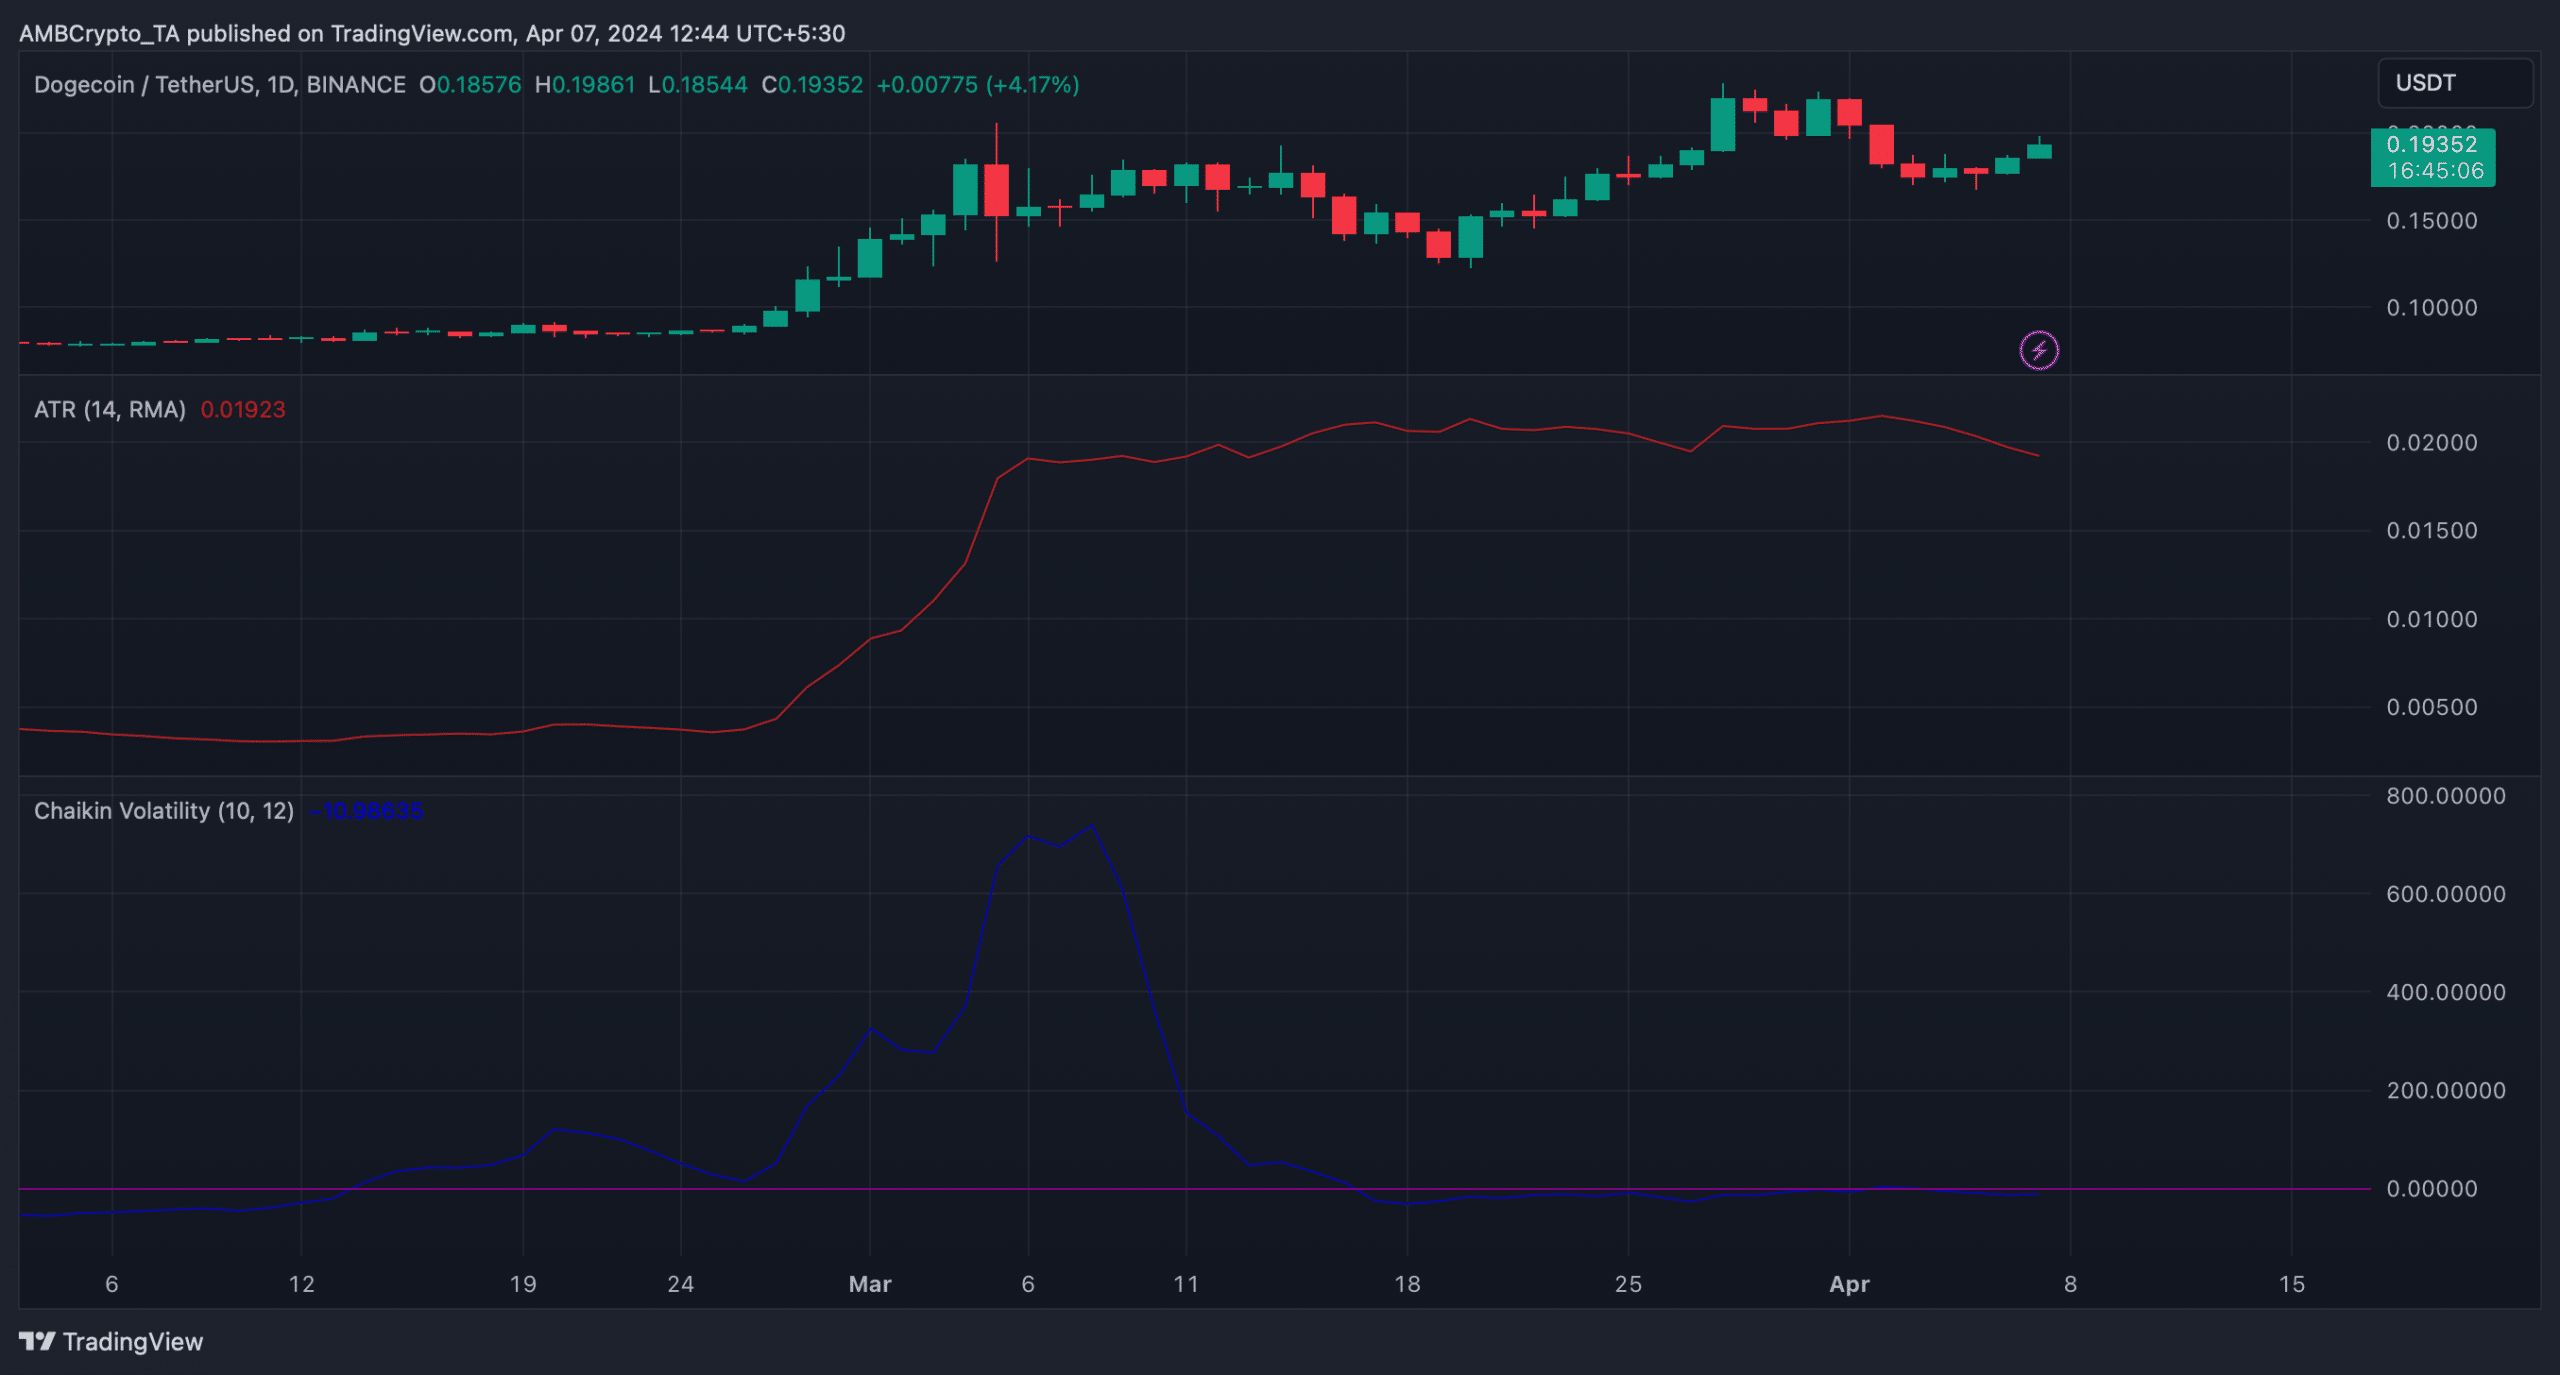
Leading meme coin Shiba Inu [SHIB] may extend its month-long decline as volatility markers assessed on a weekly chart show the coin’s market remains significantly volatile.
Exchanging hands at $0.00003 at press time, SHIB’s price has declined by 30% in the last month, according to CoinMarketCap’s data.
All bark and no bite?
Readings from the coin’s volatility markers observed on a weekly chart showed that SHIB remains prone to a further price decline as volatility lingers in the market.
For example, the gap between the upper and lower bands of the coin’s Bollinger Bands indicator has widened.
This indicator measures market volatility and identifies potential price trends. When the gap between its upper and lower bands widens, it suggests a spike in the volatility in the price of the asset in question.
Also, if this gap is widening as the price of the asset trends in a particular direction, it signals that the trend is strengthening.
In SHIB’s case, its persistent price decline, combined with the widening gap of its Bollinger Bands, suggests that the downtrend is strong.
Confirming the volatile nature of SHIB’s market, its Average True Range was in an uptrend at press time.
This metric measures market volatility by calculating the average range between high and low prices over a specified number of periods. When it surges, it suggests that the price swings are becoming more significant.
Likewise, SHIB’s Chaikin Volatility indicator has remained relatively flat since the end of March. This indicator measures the difference between an asset’s high and low prices over a specified period.
Generally, when the Chaikin Volatility indicator rallies to return higher values, it signals significant potential price swings.
SHIB soldiers remain resilient
Although SHIB remains at risk of a further decline, accumulation persists among market participants. The coin’s key momentum indicators also observed on a weekly chart, confirmed this.
Read Shiba Inu’s [SHIB] Price Prediction 2024-25
At press time, its Relative Strength Index (RSI) was 61.54, and its Money Flow Index (MFI) was 75.57.
These indicators showed that buying activity persisted despite the possibility of a further decline in SHIB’s value.