Shiba Inu: Here’s what 79% correlation with BTC could imply for SHIB traders

Disclaimer: The findings of the following analysis are the sole opinions of the writer and should not be considered investment advice.
Post its decline below the daily 20 EMA (red), Shiba Inu [SHIB] dived to test its five-month trendline resistance (yellow, dashed). After declining below this level, the bears have heightened their influence over the last few days.
The current setup continued to take a bearish tilt, especially after the recent bearish engulfing candlesticks. Any close above or below the trendline resistance could influence the upcoming trend of the dog-themed token. (For brevity, SHIB prices are multiplied by 1,000 from here on).
At press time, SHIB traded at $0.00807, up by 6.07% in the last 24 hours.
SHIB Daily Chart
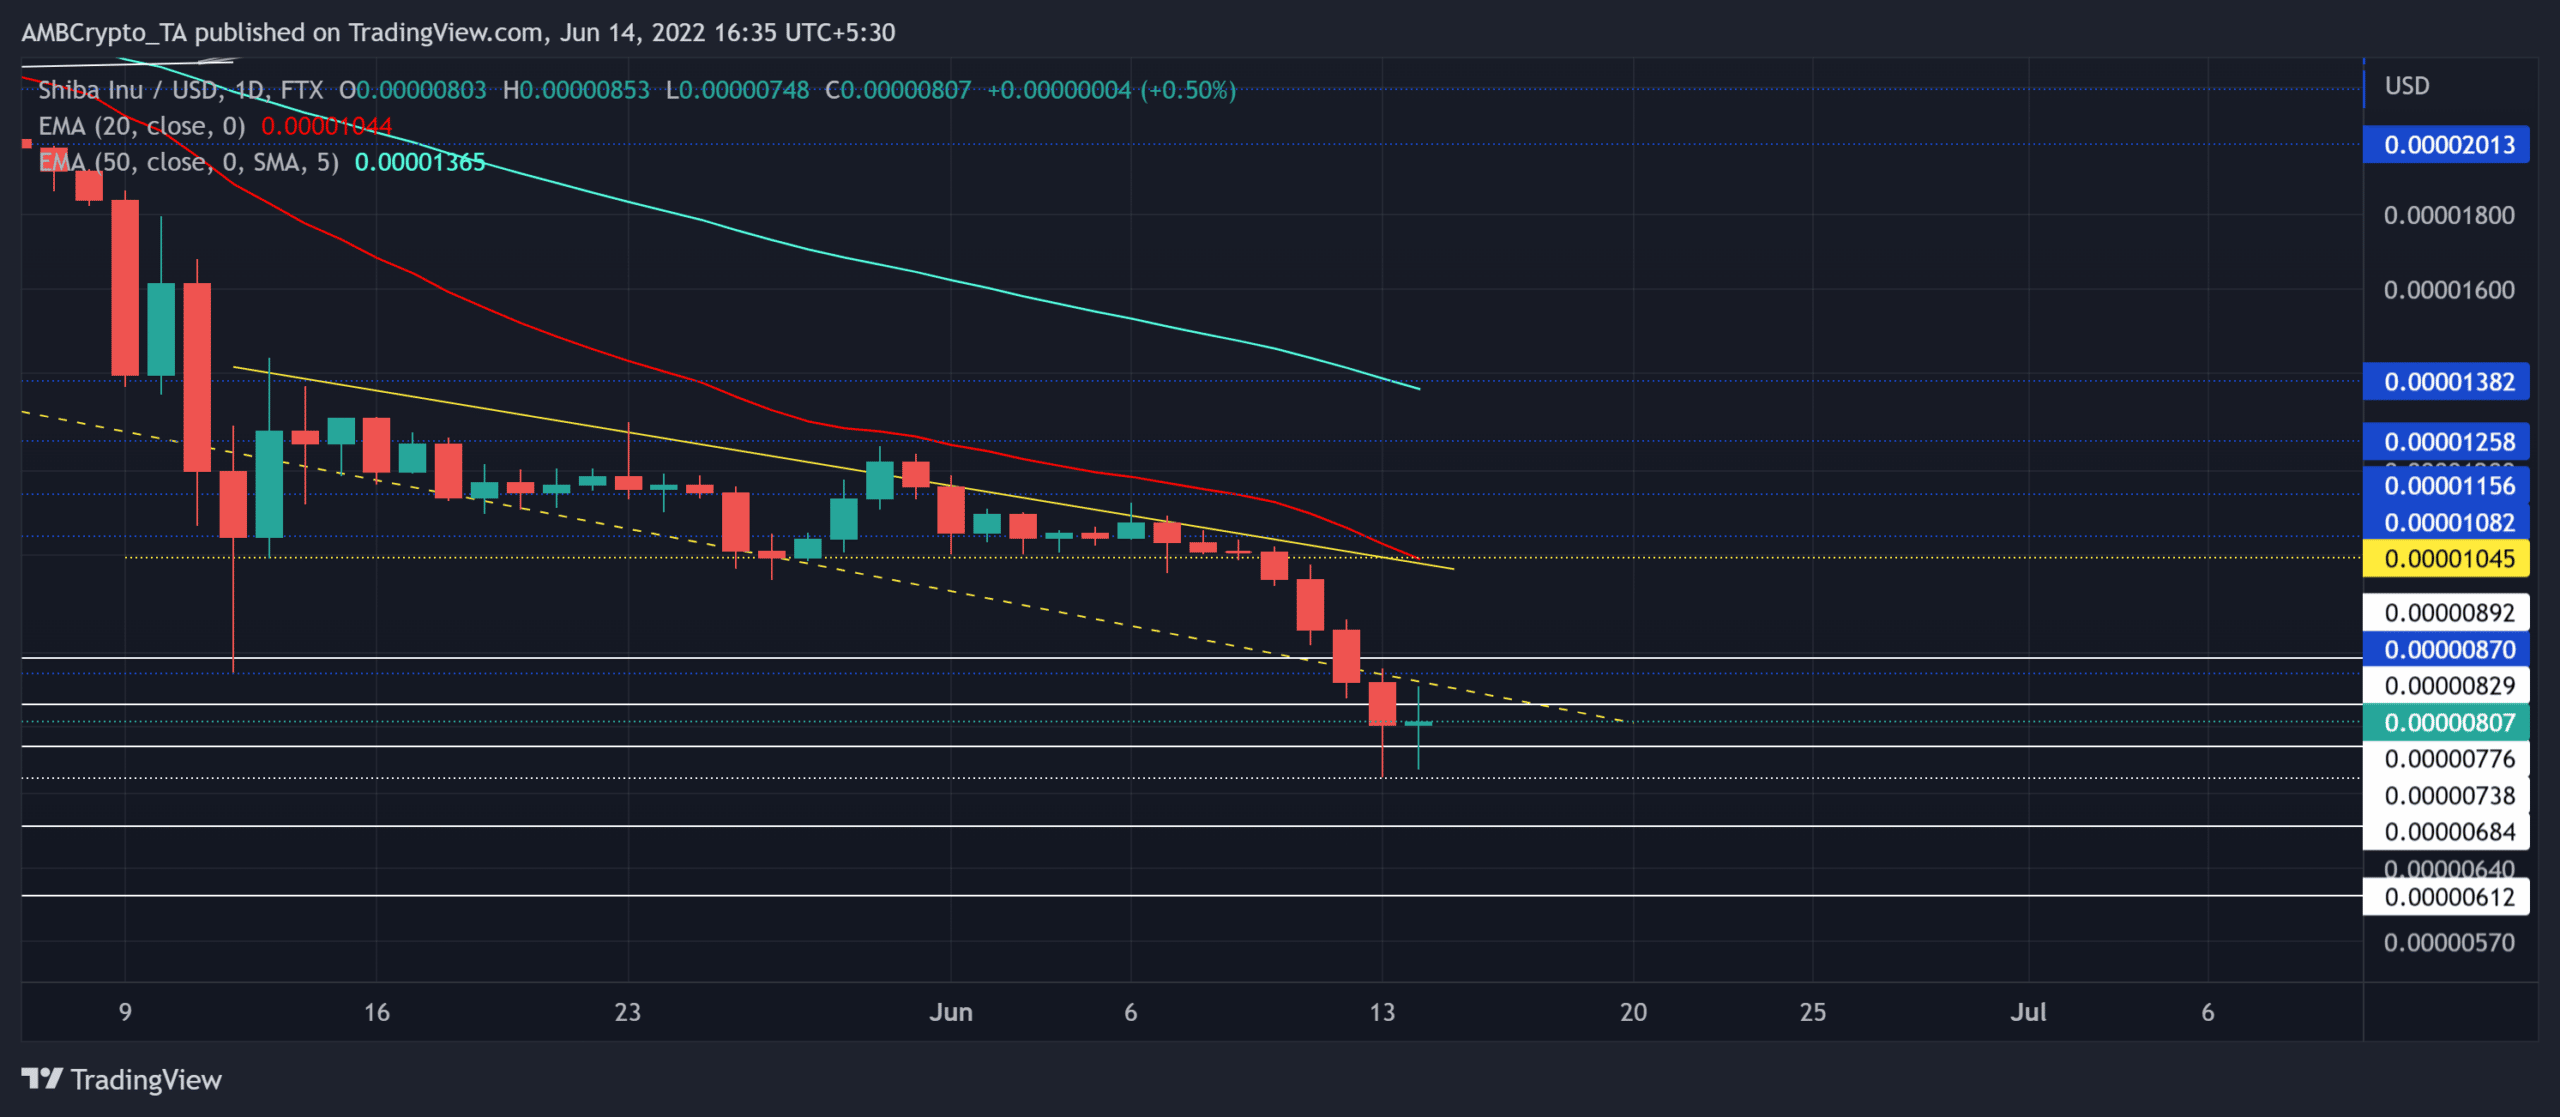
SHIB’s symmetrical triangle-like structure saw an expected breakdown due to the token’s previous downtrend. The fall below the $0.02-level marked an over 63% plunge toward its eight-month low on 13 June.
Over the last month, the alt saw a descending triangle on the daily timeframe. The recent breakdown reaffirmed the bearish strength. As a result, the gap between the south-looking 20 EMA and the 50 EMA (cyan) has been hitting a record high.
With relatively lower trading volumes, SHIB still stood fragile near the $0.008-zone. Given the current sentiment, a reversal from the immediate trendline resistance could intensify the bearish propensity. In this case, the potential targets stood in the $0.0068-zone.
Should a sudden spike in buying volumes occur, any breach above the trendline resistance could be short-lived by the 20 EMA.
Rationale

After testing the 38-mark several times, the RSI took a substantial plunge into the oversold region. From here on, a revival was plausible but would likely be short-term.
While the MACD lines undertook a bearish crossover below the zero-mark, the indicator suggested a selling edge.
Furthermore, the squeeze momentum indicator continued to take its position below its equilibrium whilst flashing grey dots. Thus, depicting a high volatility break.
Conclusion
The broader indications suggested a bearish directional bias. Unless a strong reason is observed otherwise by the investors/traders, trading against the trend may not be favorable.
A compelling close below the $0.00776-level can open doorways for a shorting opportunity. The stop loss could be set in the $0.00862-$0.00892 range to effectively manage the risk.
Moreover, the alt shares a staggering 79% 30-day correlation with Bitcoin. Hence, keeping an eye on Bitcoin’s movement with the overall market sentiment could be essential for making a profitable move.
![Stacks [STX] crashes to $0.13 even as PoX-5 testnet goes live – Why?](https://ambcrypto.com/wp-content/uploads/2026/07/IMG-20260725-WA0006.jpg)