Shiba Inu – How to make sense of conflicting signals after memecoin’s price drop?
More depreciation for SHIB. Maybe, but it might not be all bad news for traders.

- Shiba Inu bulls tried and failed to shift the momentum bullishly
- Liquidation heatmap showed that a 10% price bounce could occur next week
Shiba Inu’s [SHIB] price fell by over 8% in the last 24 hours and 10% over the last 7 days. In an analysis from last week, it was revealed that the $0.000012-support zone could likely see a price bounce towards the $0.000014-level or higher.
This did not come to pass, however. Instead, the $0.0000125-level formed a short-term resistance that the SHIB bulls have struggled to push past. This also meant that bullish conviction was low, and further losses might be imminent.
Analysts expect Q2 2025 to be an ideal time to accumulate altcoins. Given the consolidation in recent weeks, perhaps long-term Shiba Inu investors need to scoop up more tokens. In the lower timeframes, some volatility can be expected in the near term.
Is this a buying opportunity, or should traders remain wary?
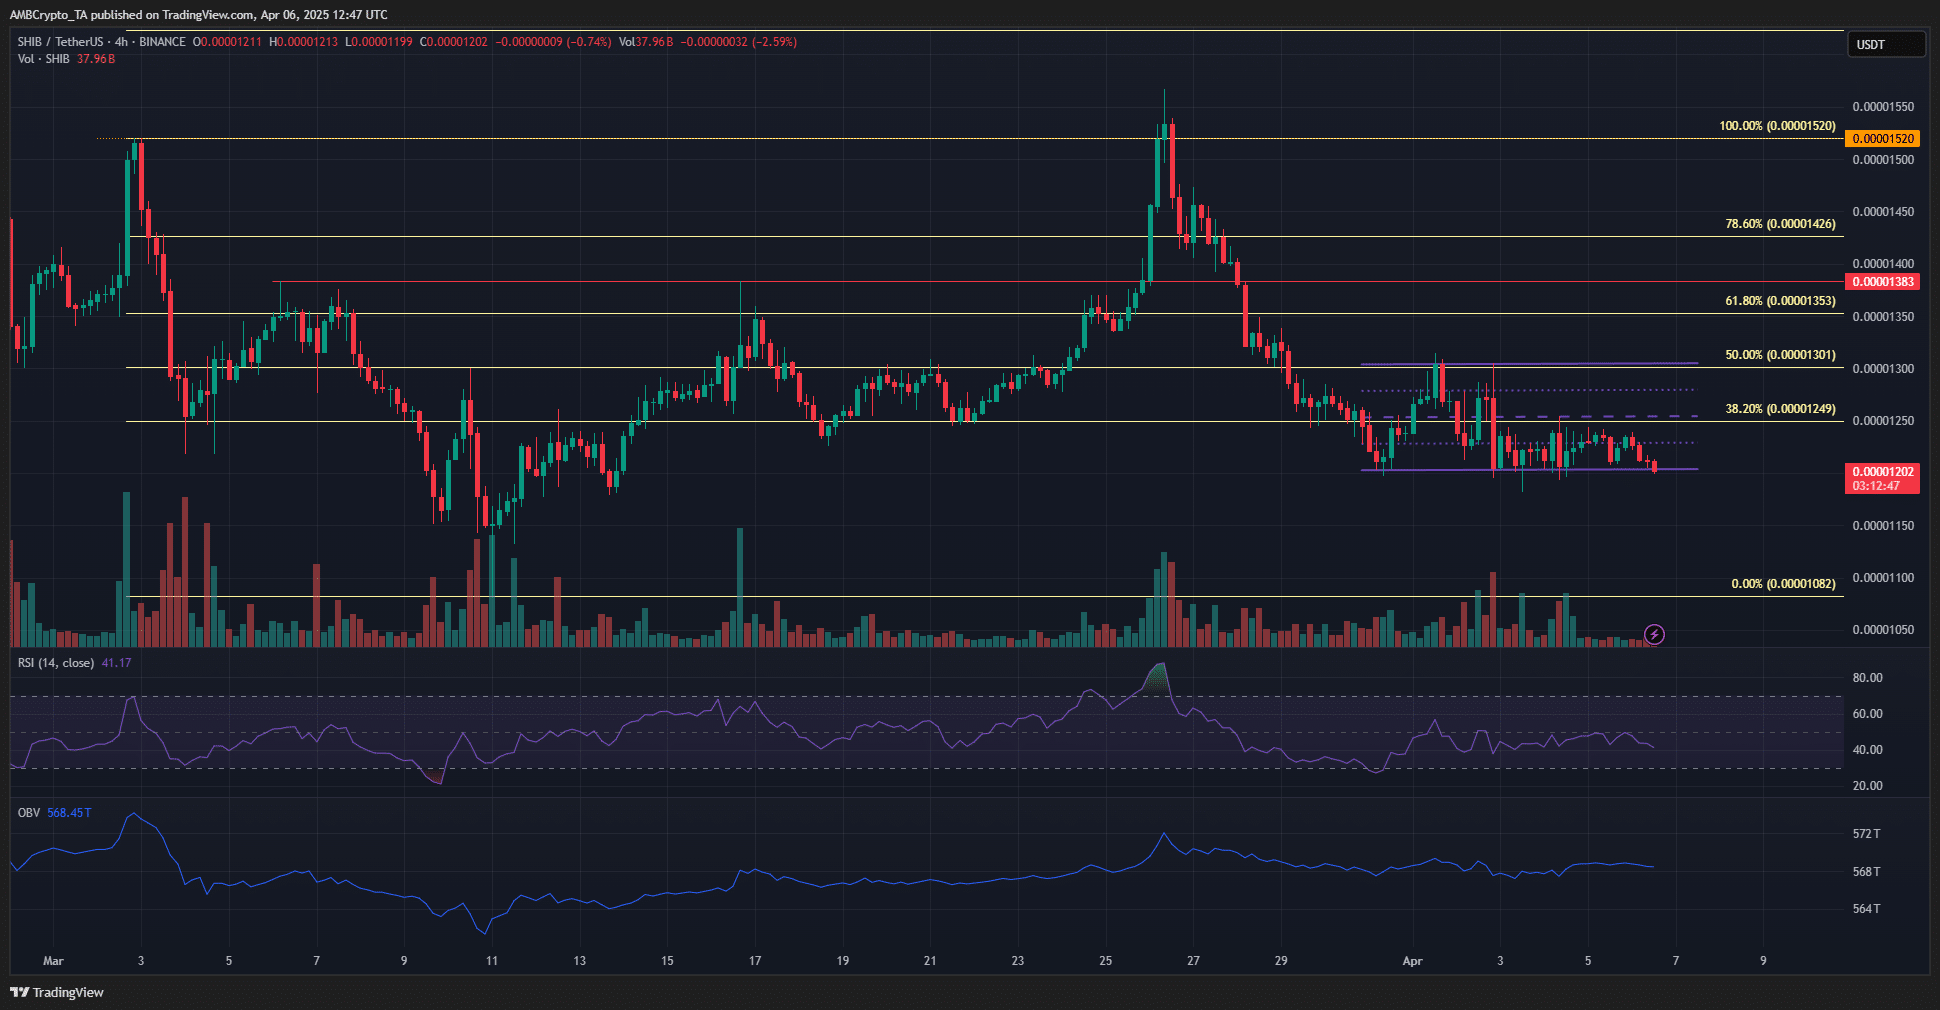
Over the past week, the memecoin has traded within a range that extended from $0.000012 to $0.000013. During this time, the RSI on the 4-hour chart tried to scale the neutral 50 level, but was unsuccessful.
A few hours before press time, SHIB bulls made another attempt to flip the momentum bullishly. They were met with failure. The mid-range level at $0.0000125 as well as the $0.0000124 level have both served as resistance.
The OBV was on a sideways trend and did not exhibit bullish or bearish dominance over the past week. As such, the range formation can be expected to continue. Some near-term volatility is possible, but the trading volume has been quite low.
Even though Shiba Inu was at the short-term range low, a price bounce towards the highs might not be likely. The immediate resistance levels at $0.0000125 may be likely to prevent a bounce. Traders can wait for a hike in trading volume to look to buy.
A breakdown below the range is also possible due to the low volume.
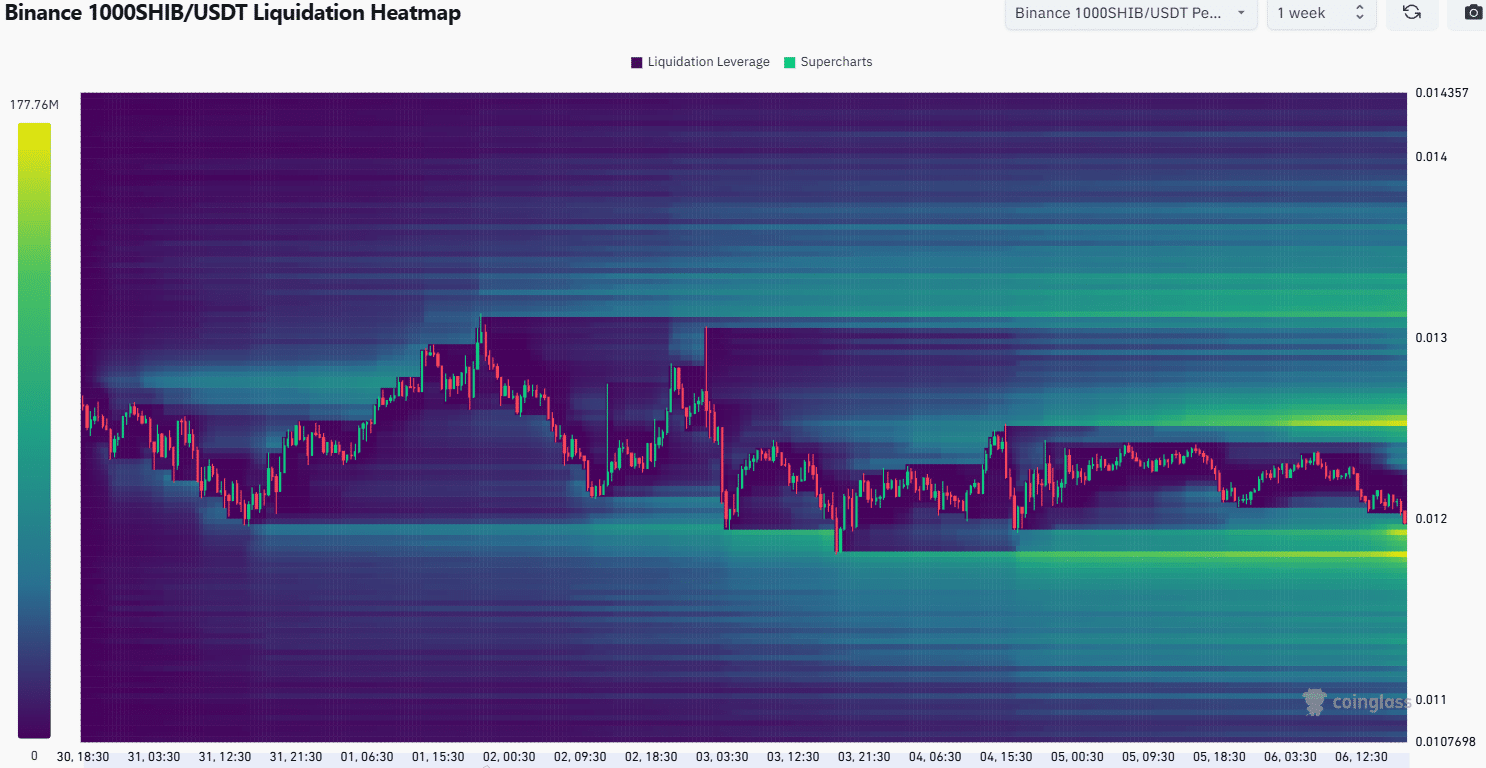
Finally, the liquidation heatmap of the past week outlined the range formation, roughly. The liquidity pockets to watch would be $0.0000119 and $0.0000118, as well as $0.0000125 marking the local highs.
Hence, at the time of writing, it seemed likely that Shiba Inu would fall further in the coming hours, before bouncing towards its range highs. Swing traders can look to go long, but must be extra careful with the position’s risk.
Disclaimer: The information presented does not constitute financial, investment, trading, or other types of advice and is solely the writer’s opinion