Shiba Inu presents a buying opportunity at this level

Disclaimer: The information presented does not constitute financial, investment, trading, or other types of advice and is solely the writer’s opinion.
- The FOMC Minutes tipped bears to overrun the market.
- SHIB’s pullback hit the May range-high of $0.00000903.
Shiba Inu [SHIB] dropped 7% post-FOMC (Federal Open Market Committee) minutes, released on 16 August, documenting reasons for July’s hawkish stance. Bitcoin [BTC] dipped below $28.5k over the same period, tipping bears to overrun the market.
Is your portfolio green? Check out the SHIB Profit Calculator
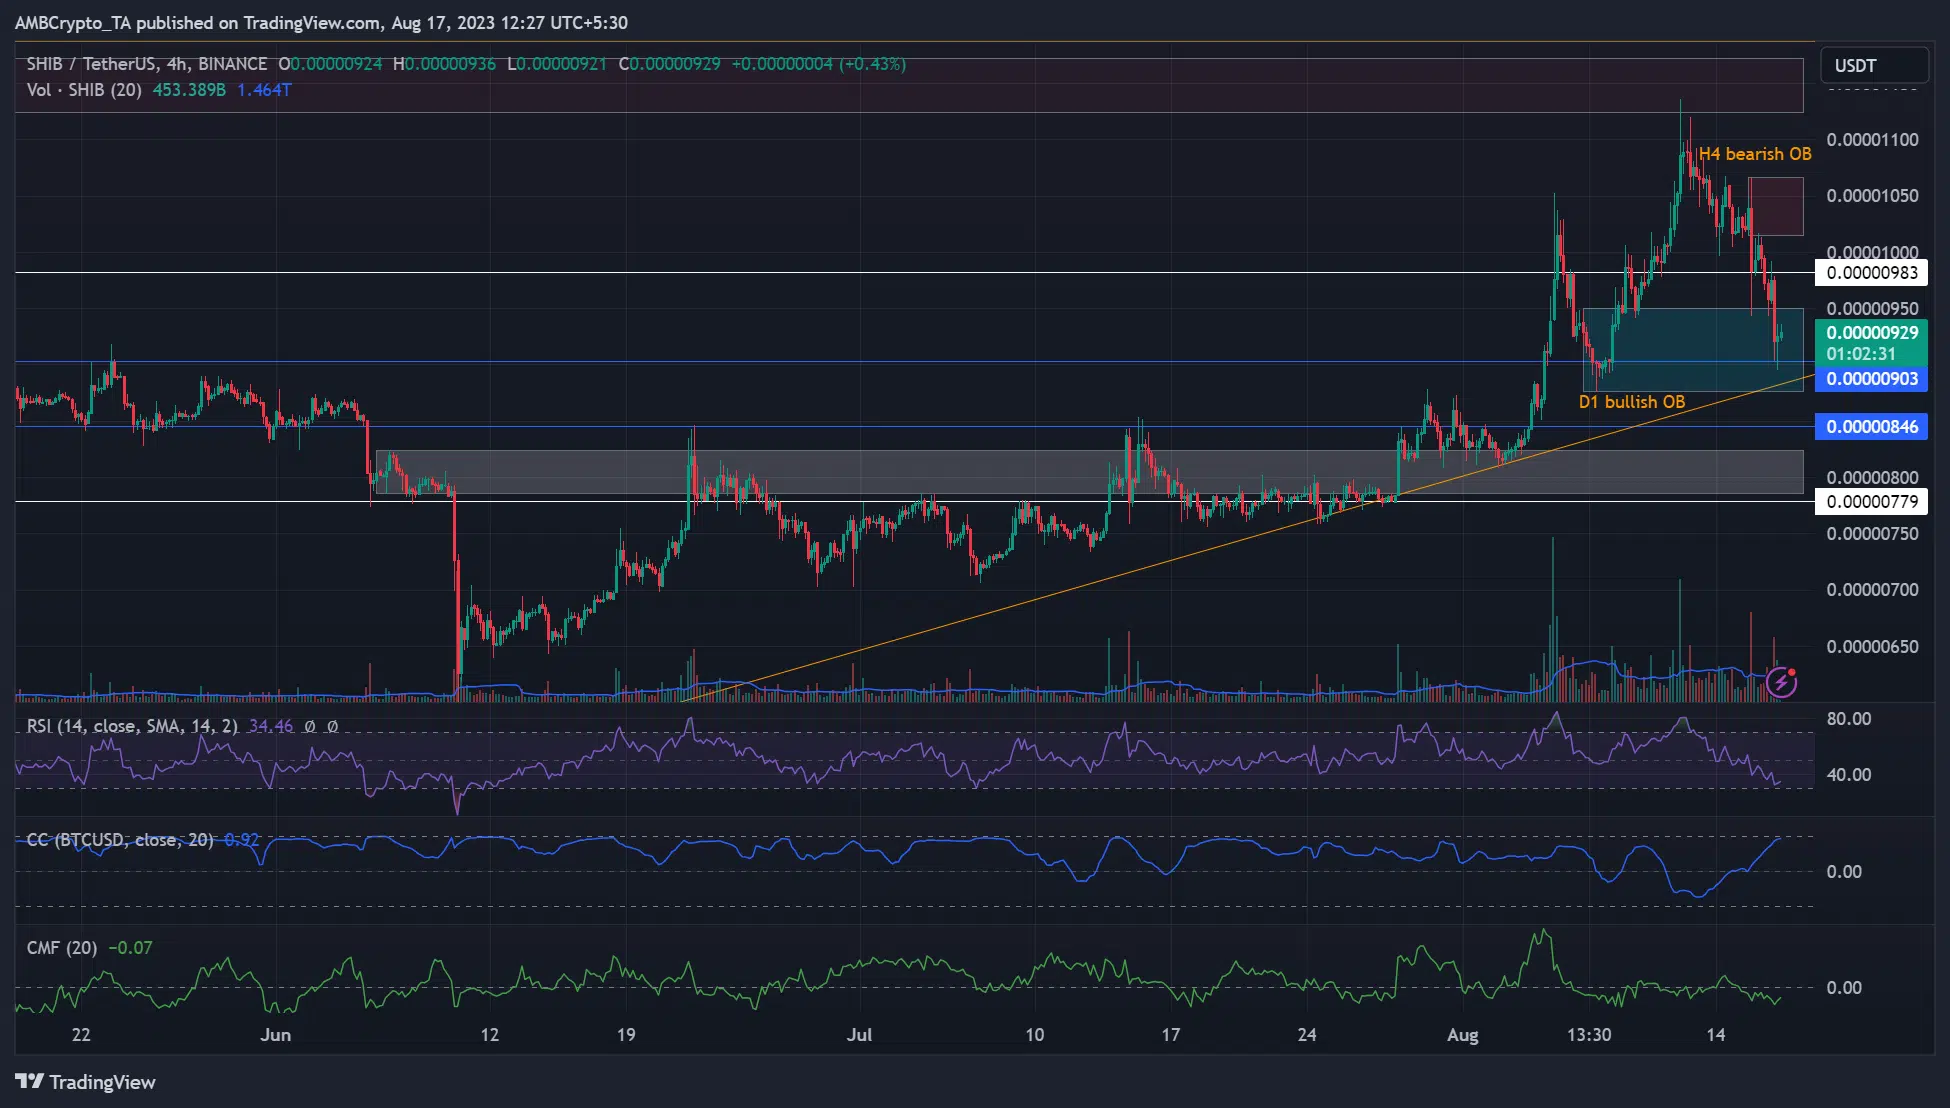
However, SHIB’s pullback hit the May range-high of $0.00000903 and eased slightly by the time of writing. BTC also hit crucial trendline support. But the recent drop quickly shifted the SHIB-BTC short-term correlation to positive.
Although the 30-day price correlation has been negative, the recent positive correlation calls for close tracking of BTC movement for optimized set-ups.
SHIB retests May range-high
SHIB’s price level at the time of writing was of interest to bulls as per price chart analysis. The retracement had eased to a daily bullish order block of $0.00000876 – $0.00000948 (cyan).
On the zoomed-out H4 chart, the above bullish OB aligned with ascending trendline support and the previous May range-high of $0.00000903. The May range-high had previously stopped the retracement seen between 6-7 August.
Ergo, the confluence area could be a solid bullish zone and a buying opportunity, targeting overhead roadblocks at $0.00001 or $0.000011.
But SHIB’s co-efficient correlation to BTC was positive at +0.9 at the time of writing, and the RSI and CMF recorded negative readings. With the currently weak BTC, any strong SHIB rebound from above the bullish zone could depend on BTC reversing recent losses in the short term.
Conversely, a breach below the trendline support (orange) could ease at the next support zone of $0.00000725 – $0.00000824 (white).
Network activity dipped and that means…
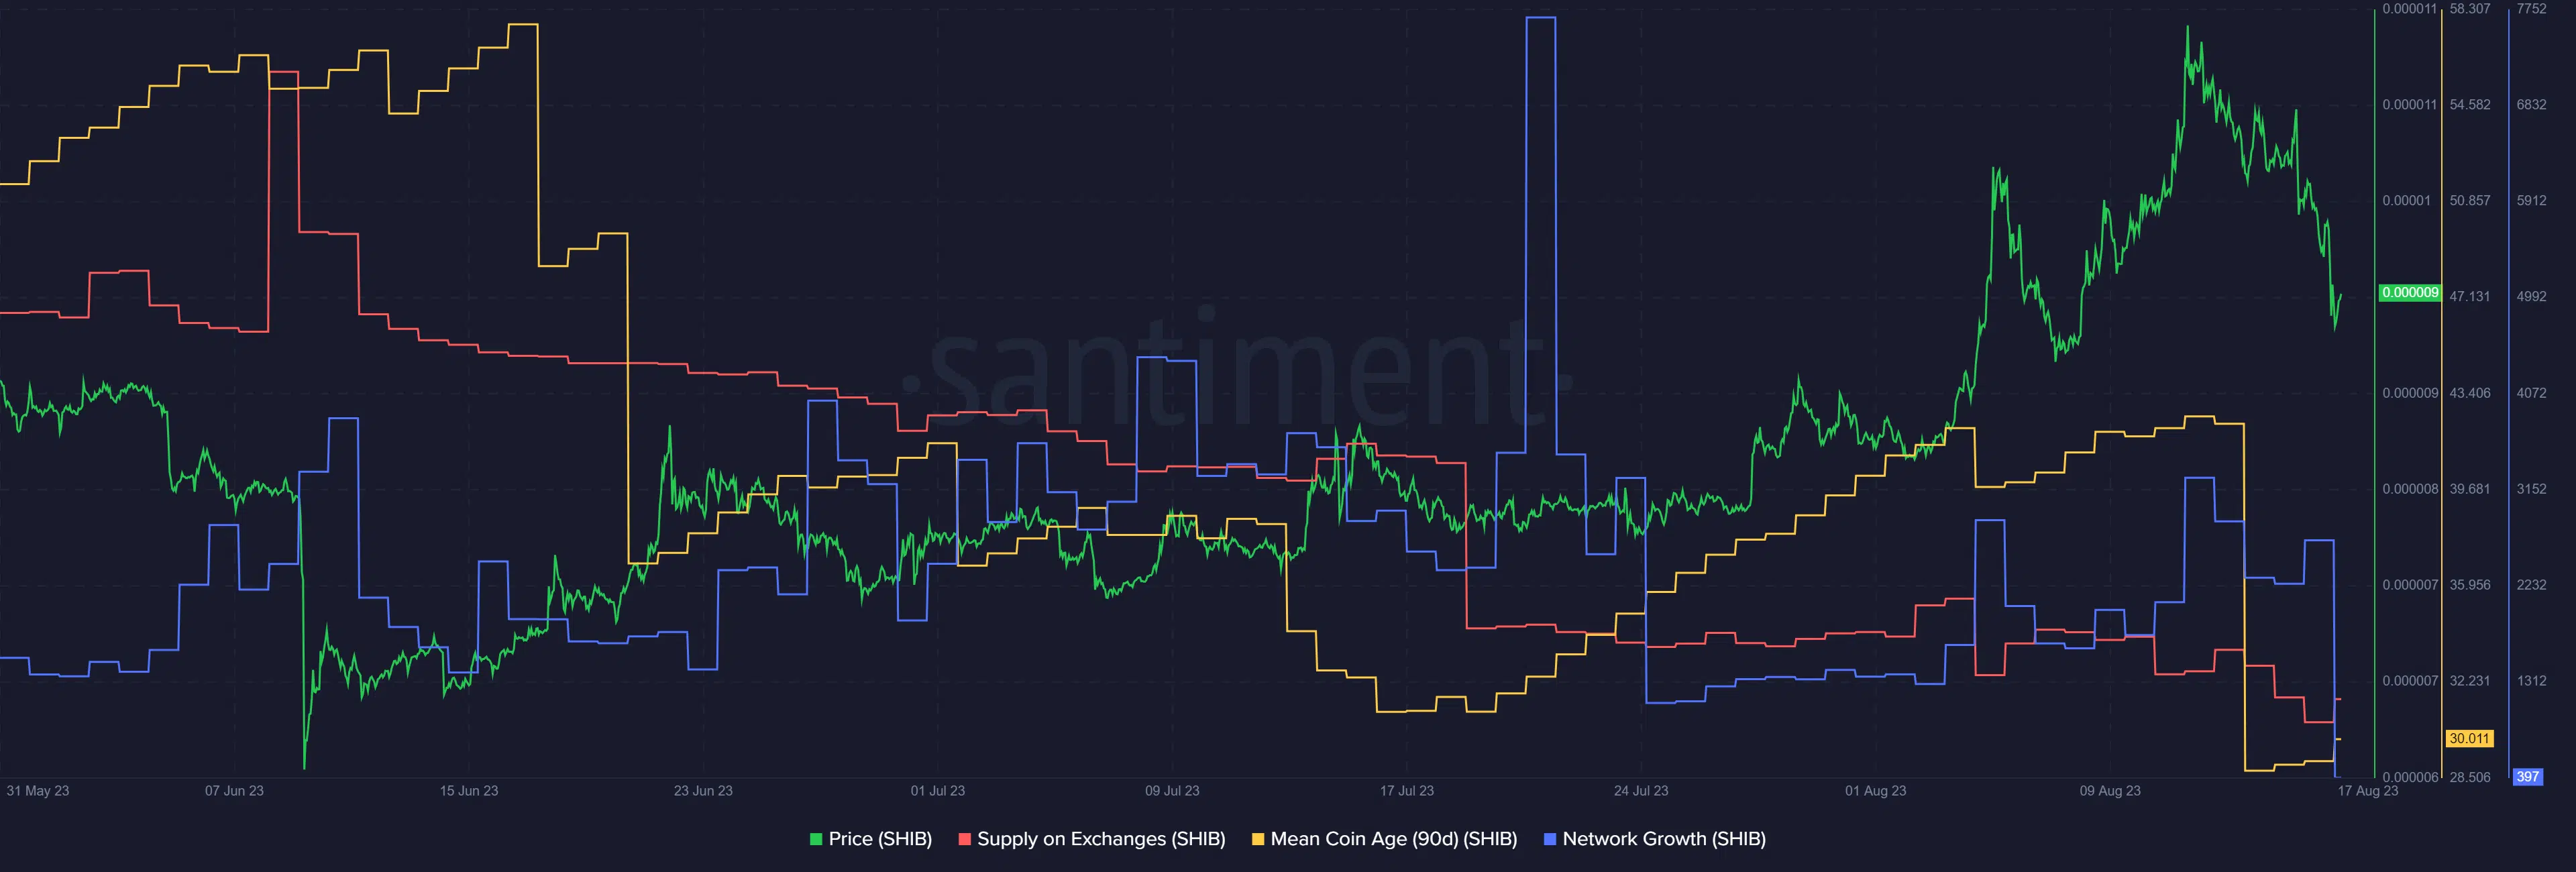
According to intelligence data platform Santiment, SHIB’s Network Growth and 90-Mean Coin Age dipped recently.
It illustrates that newly created addresses (interest on the asset) declined, and massive exchanges of the tokens occurred between addresses respectively. Both can be taken as bearish signals.
Besides, the Supply on Exchanges spiked slightly at the time of writing, demonstrating a slight increase in short-term sell pressure.
How much are 1,10,100 SHIBs worth today?
A look at the derivatives segment revealed conflicting signals, according to Coinglass. More short positions were wrecked on a 4-hour timeframe, suggesting a likely price reversal to the upside.
But volume and Open Interest dipped by over 10% and 15% in the past 24 hours, underscoring the prevalent bearish grip in the futures market. So, the confluence area ($0.00000876 – $0.00000948) could be a great buying opportunity, but only if BTC reverses recent losses.


