- Shiba Inu’s current price action showed a slight bearish edge, but hopes for a recovery are still alive.
- For SHIB bulls to regain control, the memecoin need to hold above the $0.0000144 level and reclaim the $0.0000156 resistance.
Shiba Inu [SHIB] has recently experienced increased selling pressure and failed to sustain bullish momentum after reversing from its 50-day EMA.
Despite a brief uptick, the token’s price movement showed weakness, struggling to maintain its position above near-term moving averages.
Shiba Inu bulls struggle to break the 50-EMA barrier
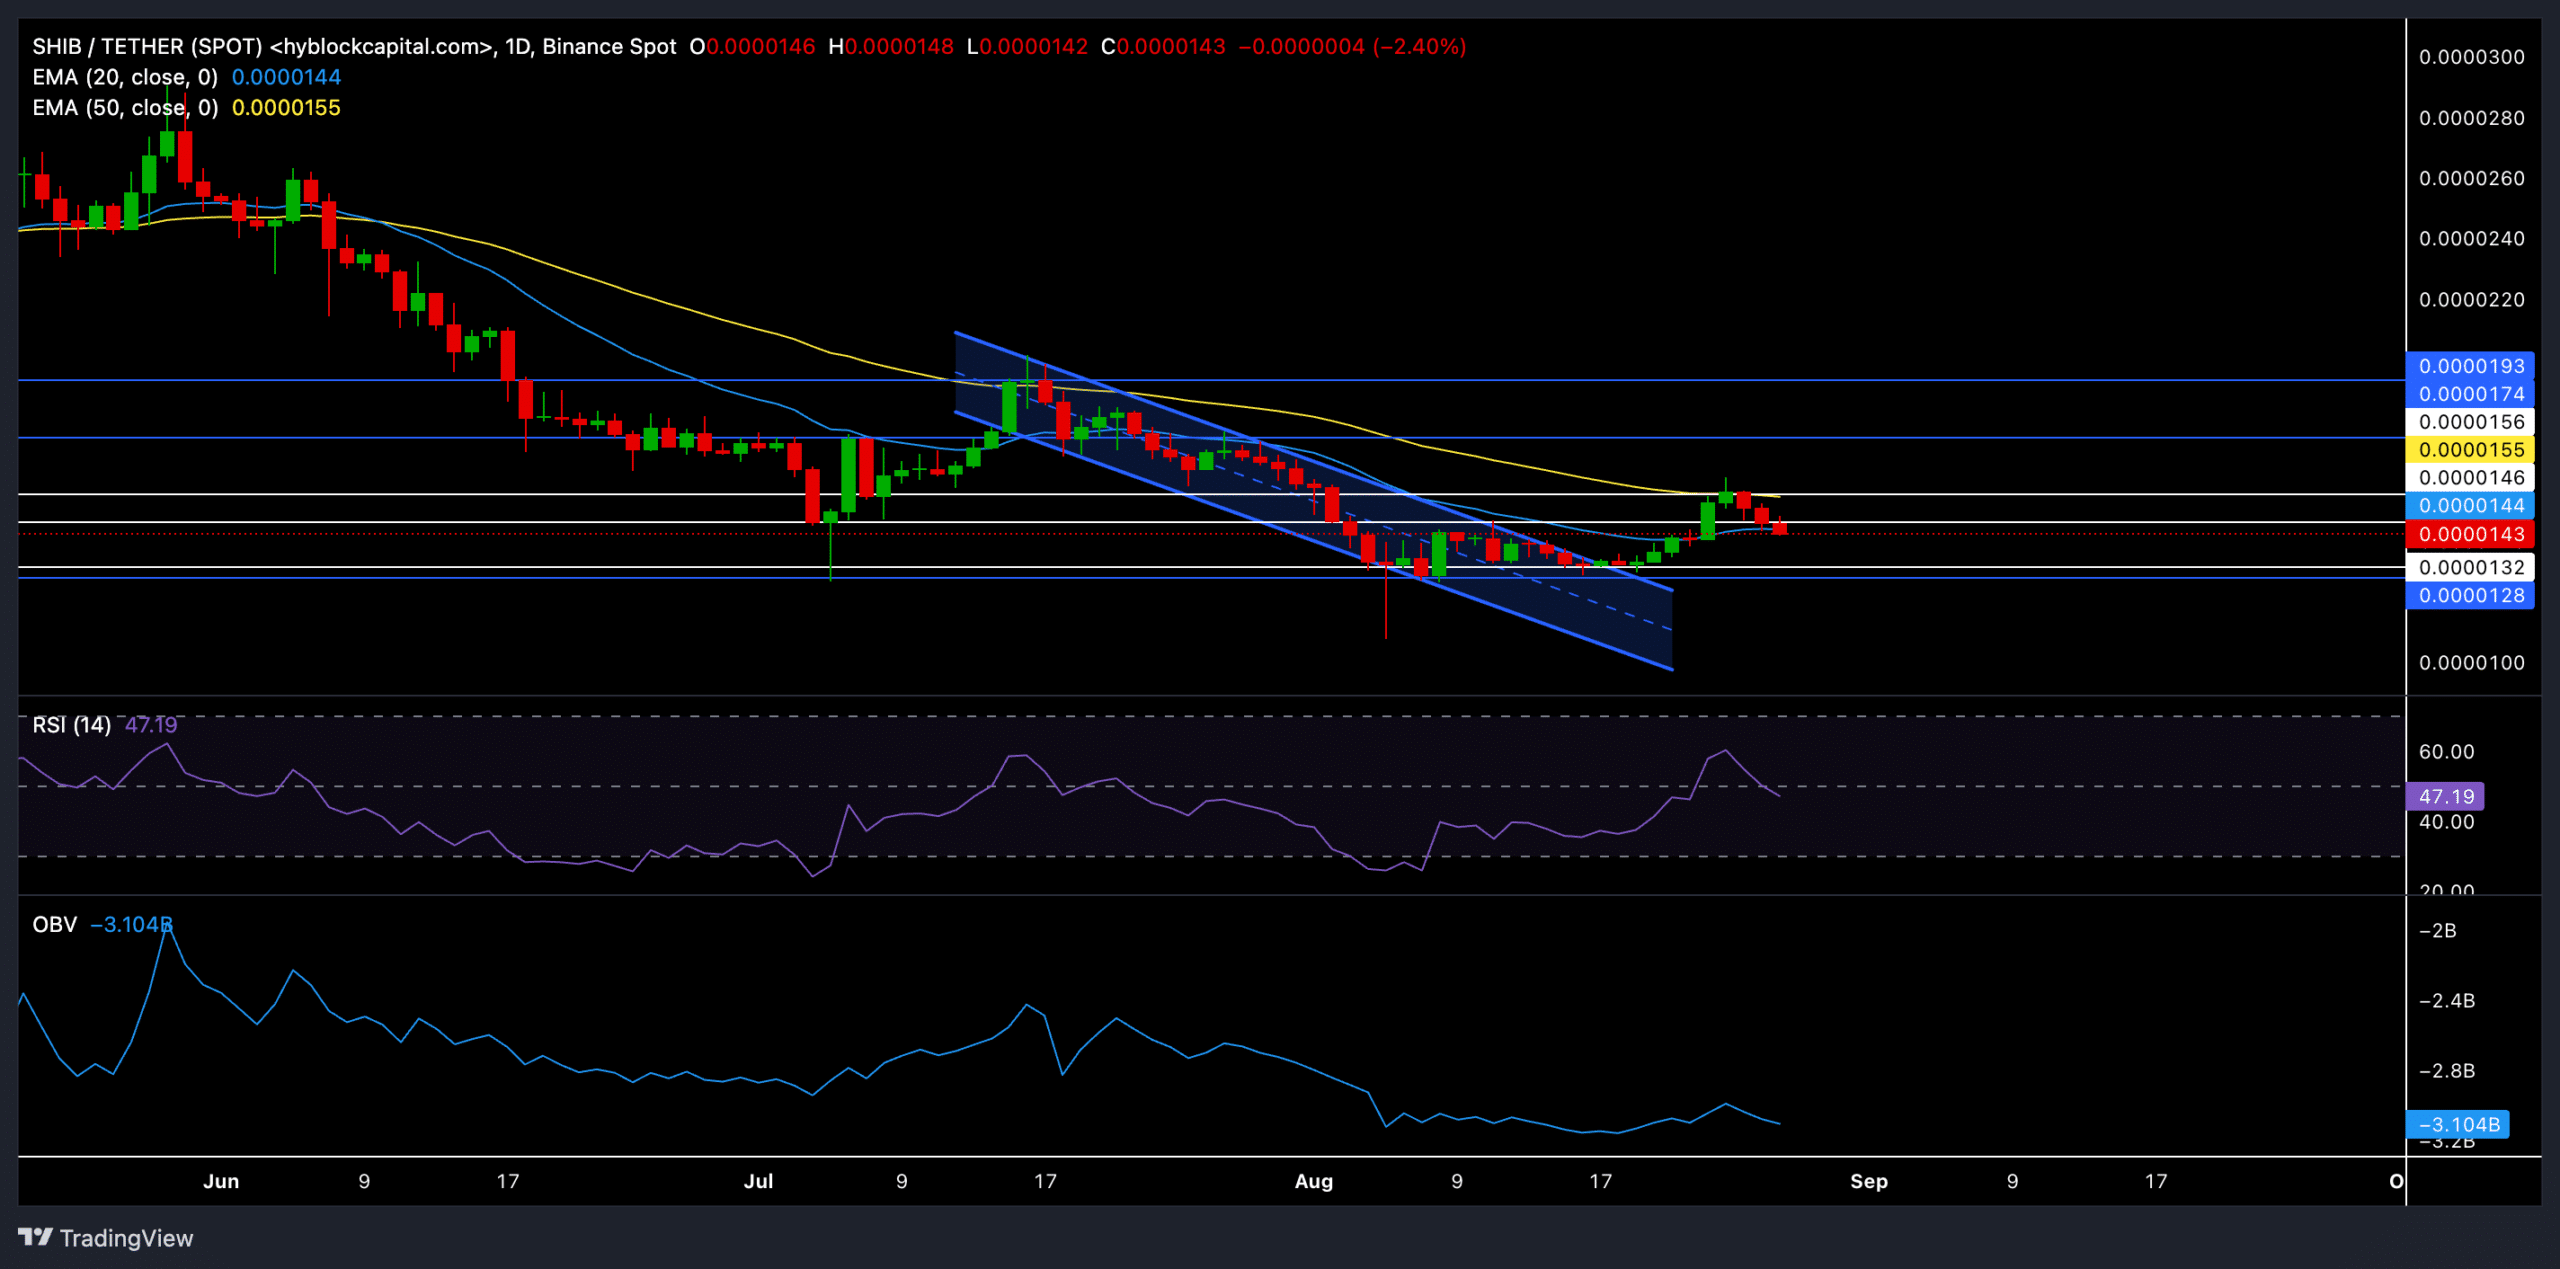
Source: TradingView SHIB/USDT
Shiba Inu daily chart revealed that memecoin was in a rather long-term downtrend after recently witnessing a descending channel.
The $0.0000128 support propelled a strong rebound that helped SHIB break out of its down channel. But the 50-day EMA has been a strong barrier, forcing the price to reverse and invalidating recent gains.
The altcoin traded at $0.0000144 at press time, down nearly 2% in the last 24 hours.
The 20 EMA (red) and the 50 EMA (cyan) slightly trended downward, showing a slight bearish edge at the time of writing.
If the bears maintain their grip, they could propel a near-term downtrend. In this case, the key support range to watch out for is between $0.0000132 and $0.0000128. A breakdown below these levels could trigger further declines.
The Relative Strength Index (RSI) hovered near the 47 mark, reflecting a neutral to bearish sentiment. A continued drop below the midline could aggravate the selling pressure, pushing SHIB further down.
The On-Balance-Volume (OBV) indicator shows a downward trajectory, indicating that selling has exceeded buying volume. However, any significant rebound in OBV could signal a potential bullish divergence, offering a glimmer of hope for the bulls.
Traders should watch for a potential rebound from the $0.0000132 support level, as a failure to hold this could lead to a deeper decline. Conversely, a break above the $0.0000155 resistance could signal a reversal, pushing SHIB toward the $0.0000174 level in the coming days.
Derivatives market sentiment

Source: Coinglass
The derivatives data provided additional insight into the current market sentiment. The open interest for SHIB has dropped by 5.55% to $32.16 million, signaling a reduction in speculative interest.
Despite the volume increasing by 12.66% to $88.86 million, the overall long/short ratio remained below 1, with a 24-hour ratio of 0.7455, indicating more short positions than longs.
Is your portfolio green? Check out the SHIB Profit Calculator
The 1-hour and 12-hour liquidation data show that long positions are being liquidated at a higher rate, further supporting the bearish outlook.
Keeping an eye on Bitcoin’s movement and overall market sentiment will also be crucial in anticipating SHIB’s next move.
![Dogecoin [DOGE] drops 16% – But is a $0.25 rally now loading?](https://ambcrypto.com/wp-content/uploads/2025/06/08519350-41B0-4D47-8530-DADB272A4AD3-400x240.webp)