Shiba Inu price prediction – All about SHIB’s latest buy opportunity
What next for one of the market's leading memecoins? More corrections, or is a rally incoming now?

- Despite its recent price troubles, SHIB’s long-term outlook remains bullish
- SHIB’s key on-chain indicator flashed a buy signal too
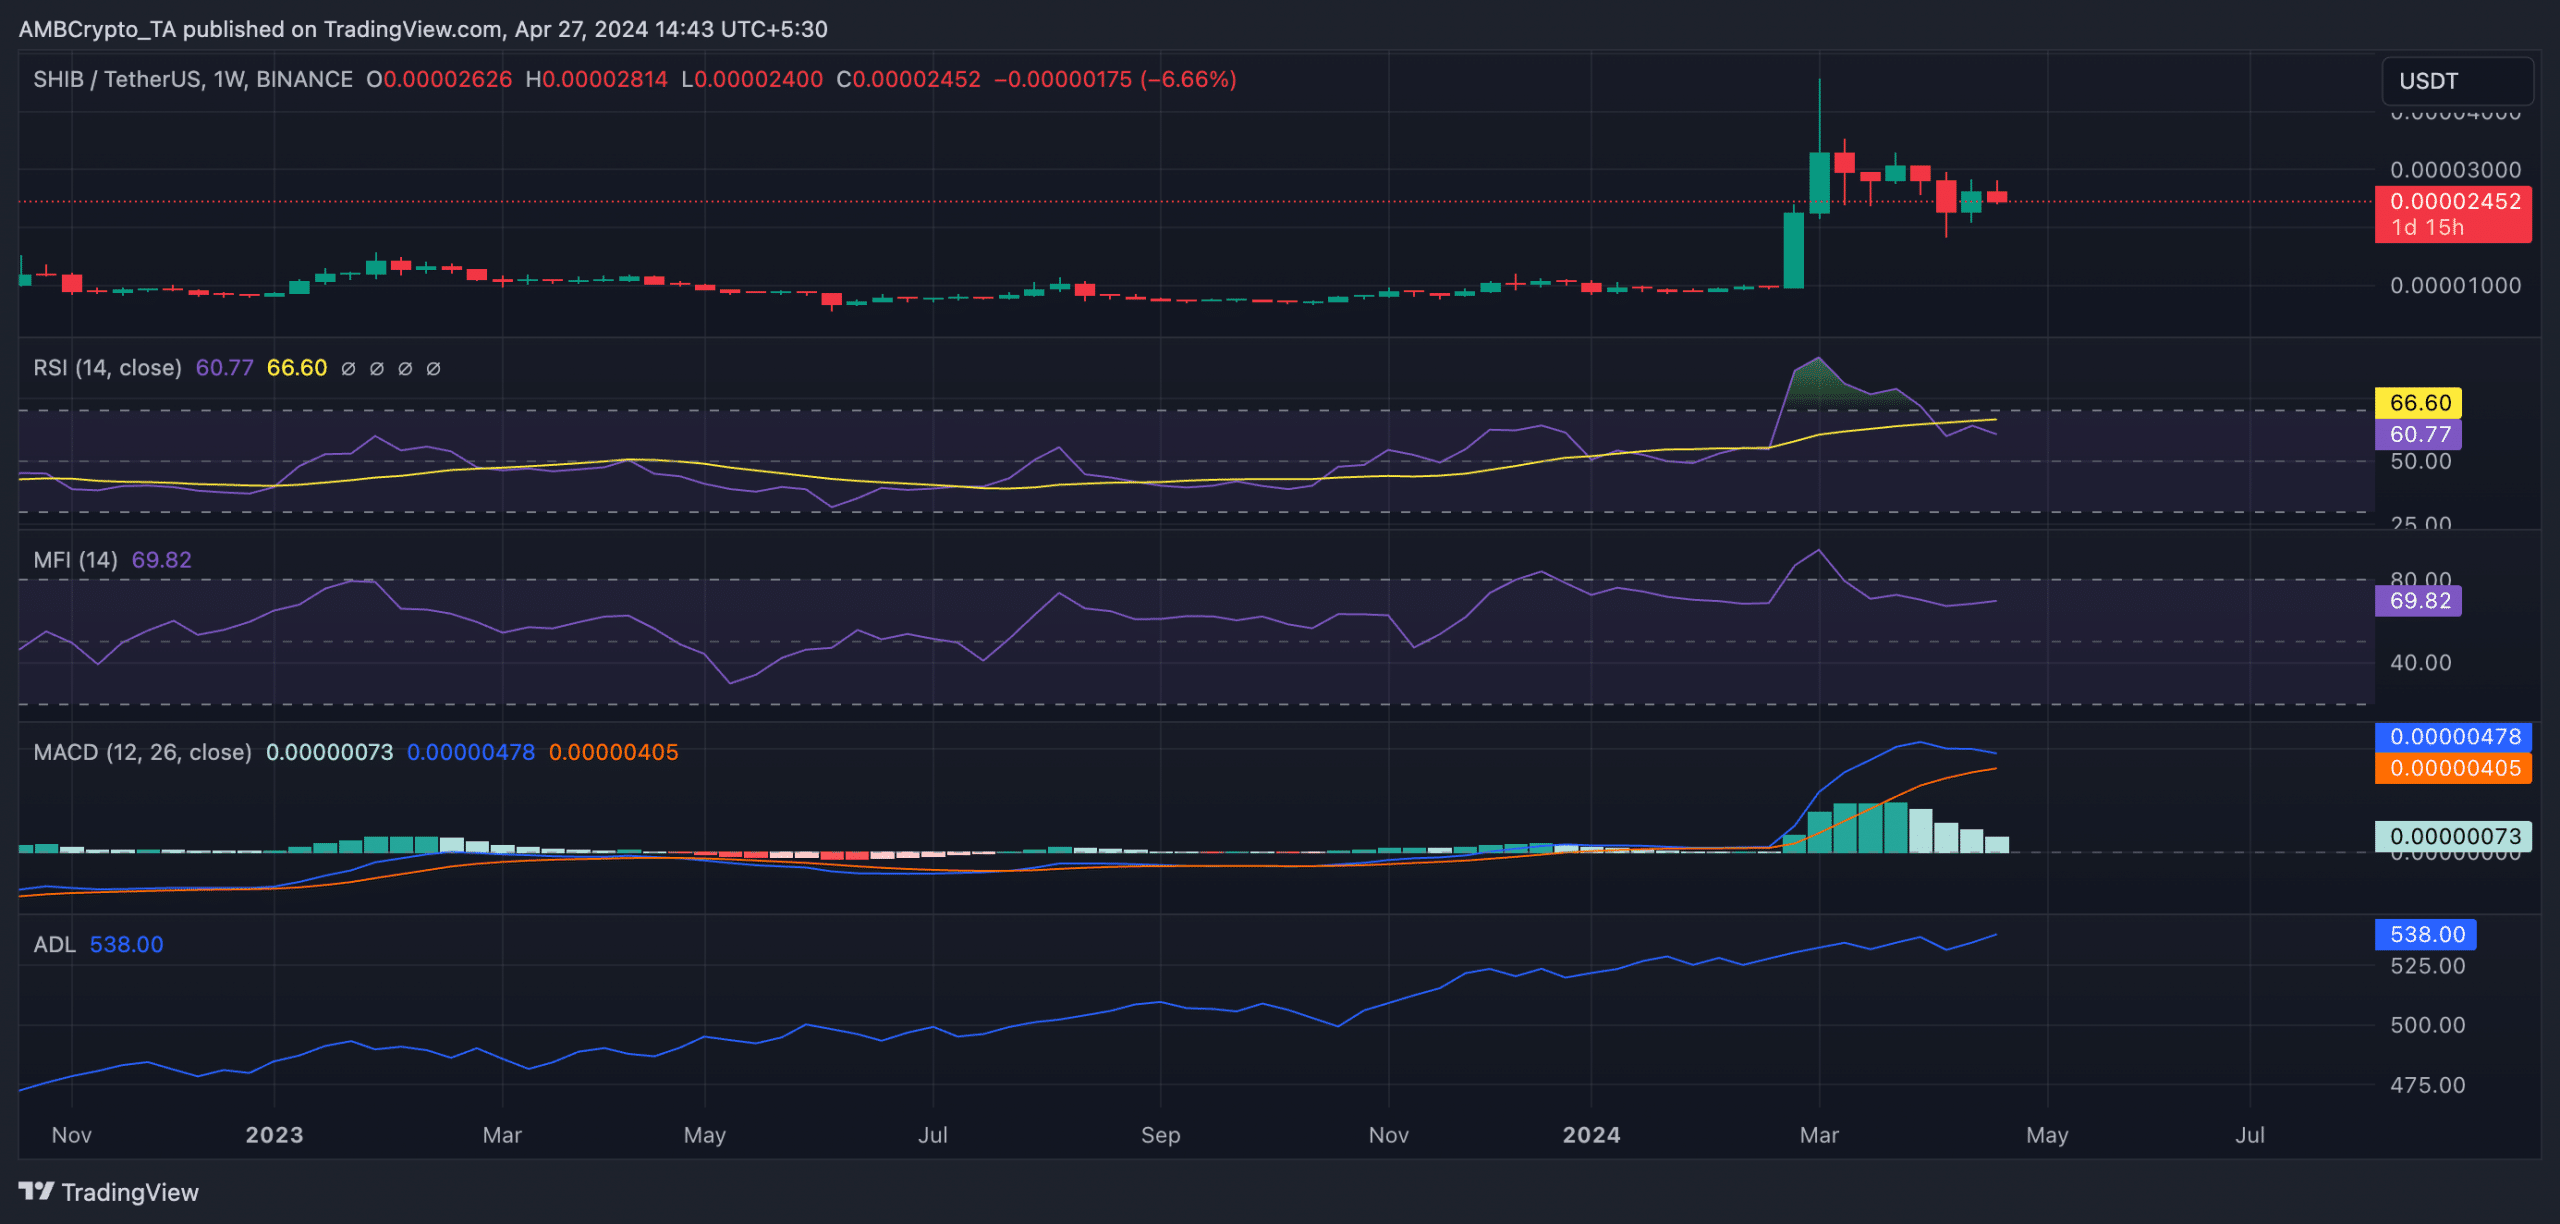
According to key technical indicators observed on its weekly chart, leading memecoin Shiba Inu [SHIB] is primed for a long-term rally, despite its recent price troubles.
At the time of writing, the altcoin was valued at $0.000025. According to CoinMarketCap, its value has fallen by 20% in just over a month.
SHIB prepares for a lift-off
The first indicator worthy of note here is SHIB’s Moving average convergence/divergence (MACD), which tracks its market trends and changes in price momentum. At press time, the coin’s MACD line (blue) lay above its signal line (orange).
This is regarded as a bullish sign, and traders often interpret it as a sign to take long positions and exit short ones.
Also, despite its recent price troubles, SHIB’s momentum indicators highlighted sustained demand for the memecoin. Its Relative Strength Index (RSI) was 60.77, while its Money Flow Index (MFI) had a reading of 69.82. At these values, these indicators suggested that SHIB traders favoured the coin’s accumulation over its distribution.
Confirming the preference for SHIB accumulation by market participants, its Accumulation/Distribution Line (A/D Line) was on an uptrend too, at press time.
This indicator measures the cumulative flow of money into or out of an asset over a specific period. When it rises this way, it indicates that more money is flowing into the asset due to a hike in buying pressure. By doing so, it confirms the possibility of a price incline on the charts.
SHIB Whales unmoved by losses
Despite the memecoin’s double-digit price decline over the past month, SHIB whales that hold between 100 and 1,000,000 SHIB coins have intensified their accumulation practices.
In fact, at press time, this cohort of investors totalled 299,000, with their count rising by 4% in the last 30 days, according to Santiment’s data.
These memecoin holders have also remained resilient, despite daily transactions involving SHIB continuing to return losses. As per Santiment, the daily ratio of SHIB’s transaction volume in profit to loss was 0.359.
Simply put, this means that for every SHIB transaction that returned a loss, only 0.359 transactions ended in profit.
Is your portfolio green? Check the SHIB Profit Calculator
Now might be the time to buy
Finally, on-chain data revealed that SHIB’s Market Value to Realized Value (MVRV) ratio flashed a buy signal. According to Santiment, SHIB’s MVRV ratios on the 30-day and 365-day moving averages were -132% and -147%, respectively, at the time of writing.
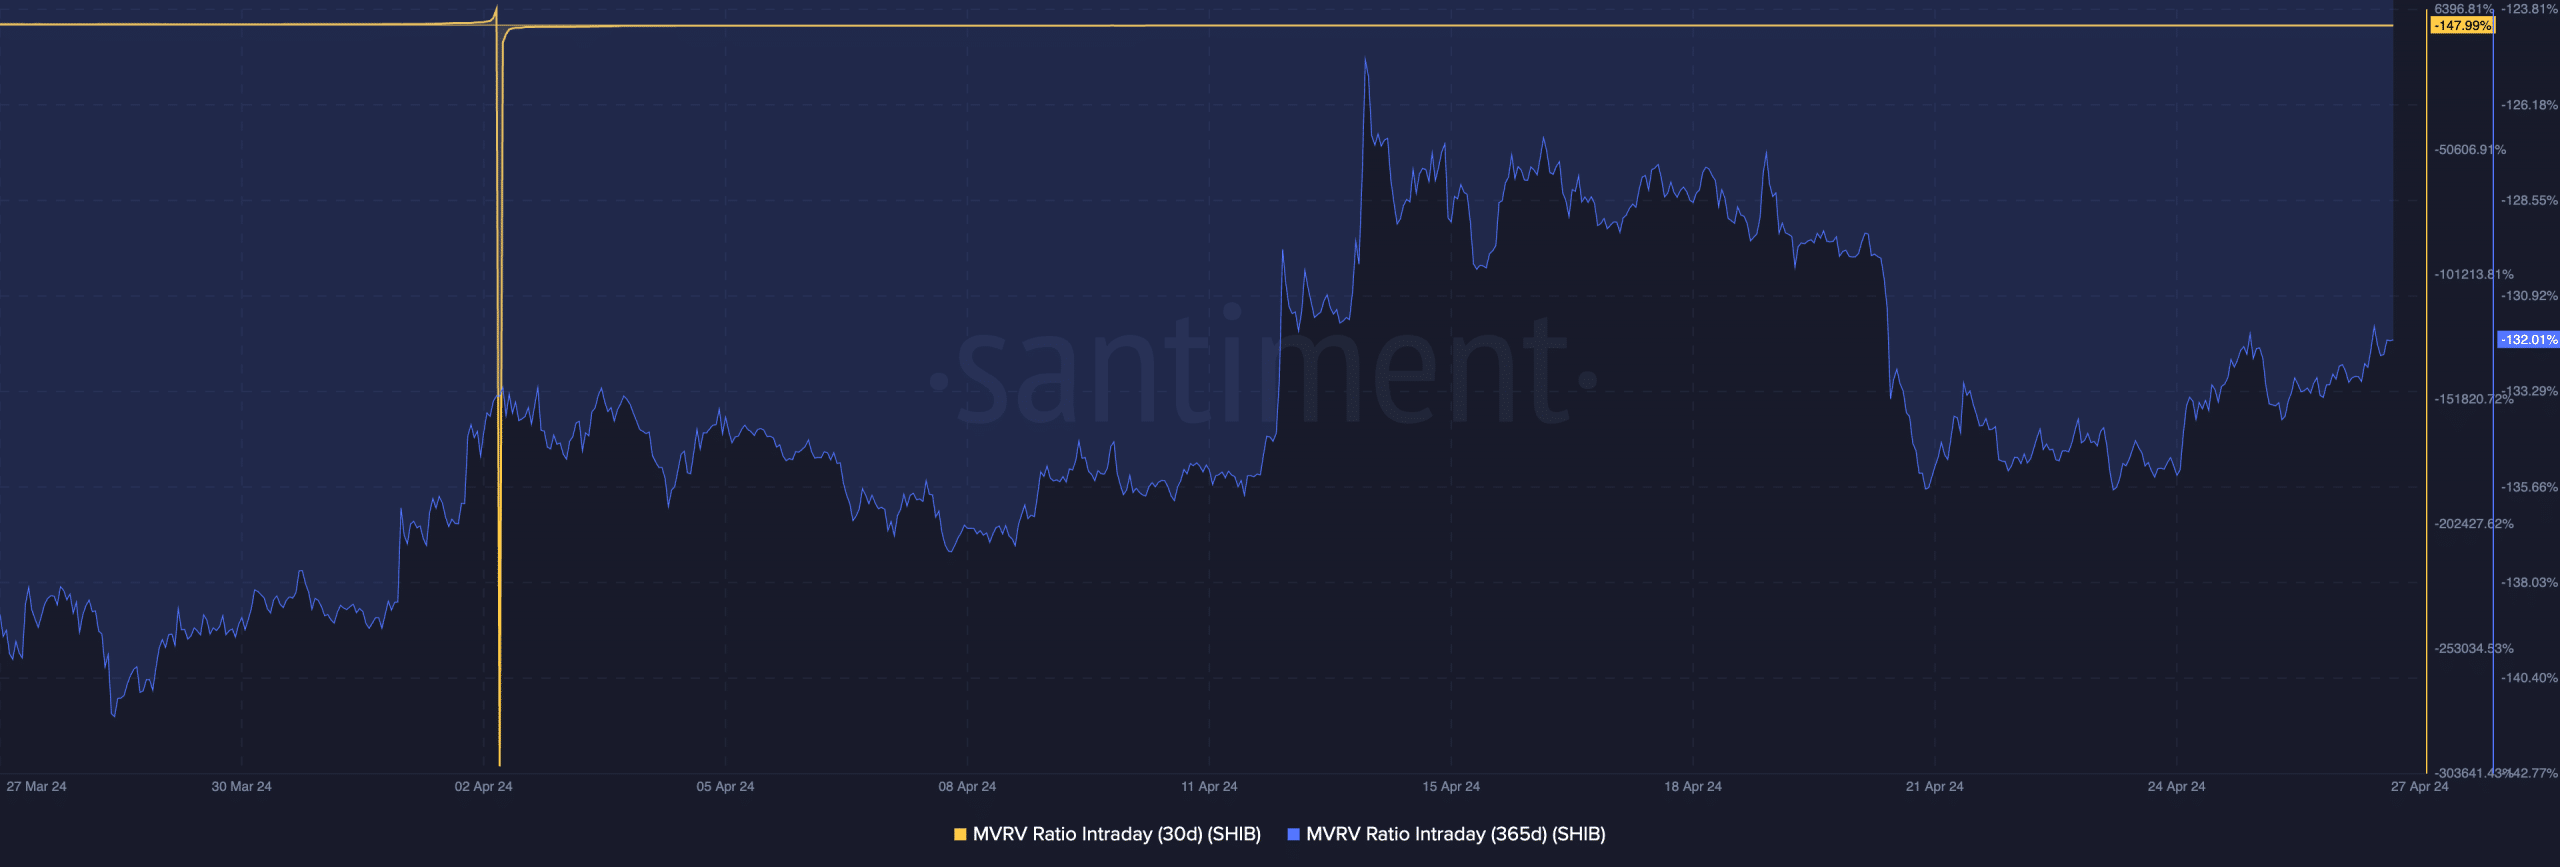
The MVRV ratio tracks the ratio between an asset’s current market price and the average price of every coin or token acquired for that asset.
When it is negative in this manner, the asset in question is said to be undervalued. This means that the asset’s market value is below the average purchase price of all its tokens that are in circulation, which many view as a good buying opportunity.