Shiba Inu price prediction – SHIB to reverse its 2024 gains now?

- SHIB was trading within a bullish symmetrical pattern; However, it is likely to fall
- Multiple indicators suggested that SHIB can drop further, rather than achieving the anticipated breakout
After a major rally propelled Shiba Inu (SHIB) to its highest point of the year at $0.00004567, the popular memecoin has since reversed most of these gains. In fact, it has lost over 71.69% of its value.
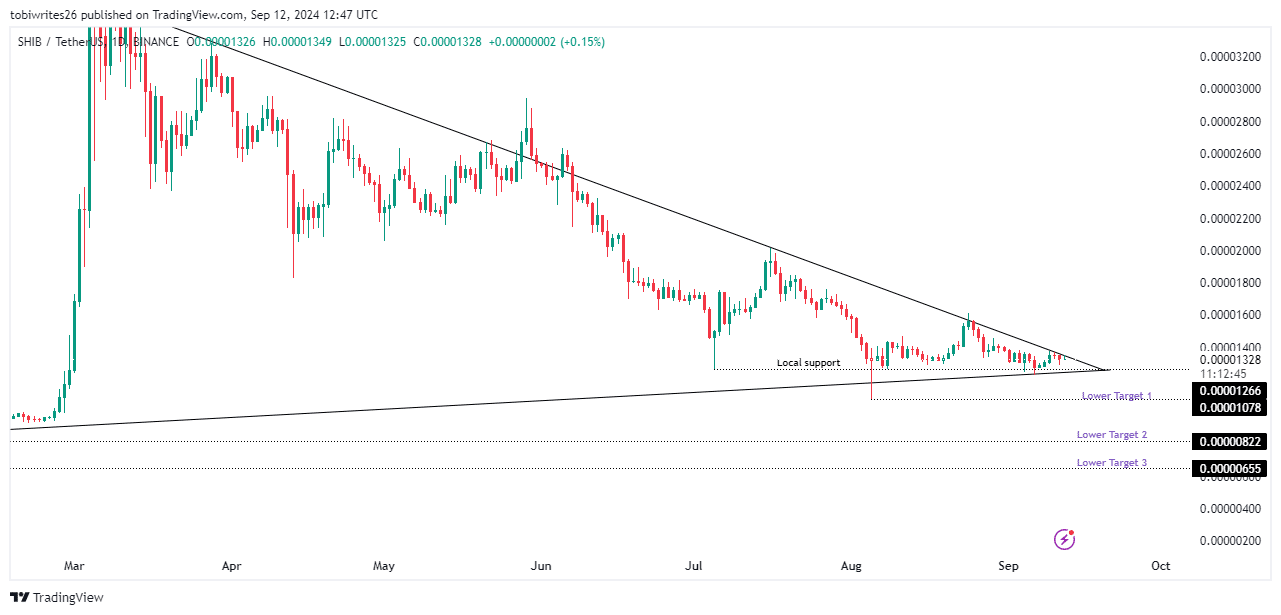
During this period, SHIB’s price action began to develop a symmetrical pattern, typically a precursor to a rally. However, this time, the pattern is likely to fail, as AMBCrypto uncovered more fundamental issues with SHIB.
Yearly low in sight for SHIB as symmetrical pattern might fail
SHIB, at press time, was trading within a symmetrical pattern, one defined by an upper resistance line that creates selling pressure and a lower support line that provides buying pressure. Typically, a breakout is anticipated as the price approaches the converging point of these lines.
Despite expectations of an acceleration following a bounce off the local support at $0.00001266, the buying pressure seemed to be insufficient to break through the upper resistance line.
If the resistance remains un-breached, the price can be expected to reverse, with potential targets at $0.00001078, $0.00000822, and $0.00000655. Specifically, a drop to $0.00000822 would erase all gains made by SHIB holders from the rallies between February and March.
Coinglass data also revealed that the Open Interest pointed to a potential reversal, having fallen from $26.41 million on 10 September to $24.99 million, at the time of writing.
Impending major fall predicted by metrics
Additionally, exchange netflows data from Coinglass indicated that SHIB has seen some positive flows, suggesting that investors have been moving their holdings to exchanges, potentially to sell. This could lead to a bout of price depreciation if selling pressure persists.
Positive exchange netflows usually signify more cryptocurrencies moving into exchanges than out – A sign of selling intent.
AMBCrypto’s analysis also found that positive exchange flows were correlated with a hike in active addresses, as indicated by CryptoQuant. Simply put, these traders are now actively selling their SHIB.
The likelihood of SHIB’s price falling further is high, especially if the Exchange Netflows and active selling continue at their current rates.
Greater bearish sentiment surfaces for SHIB
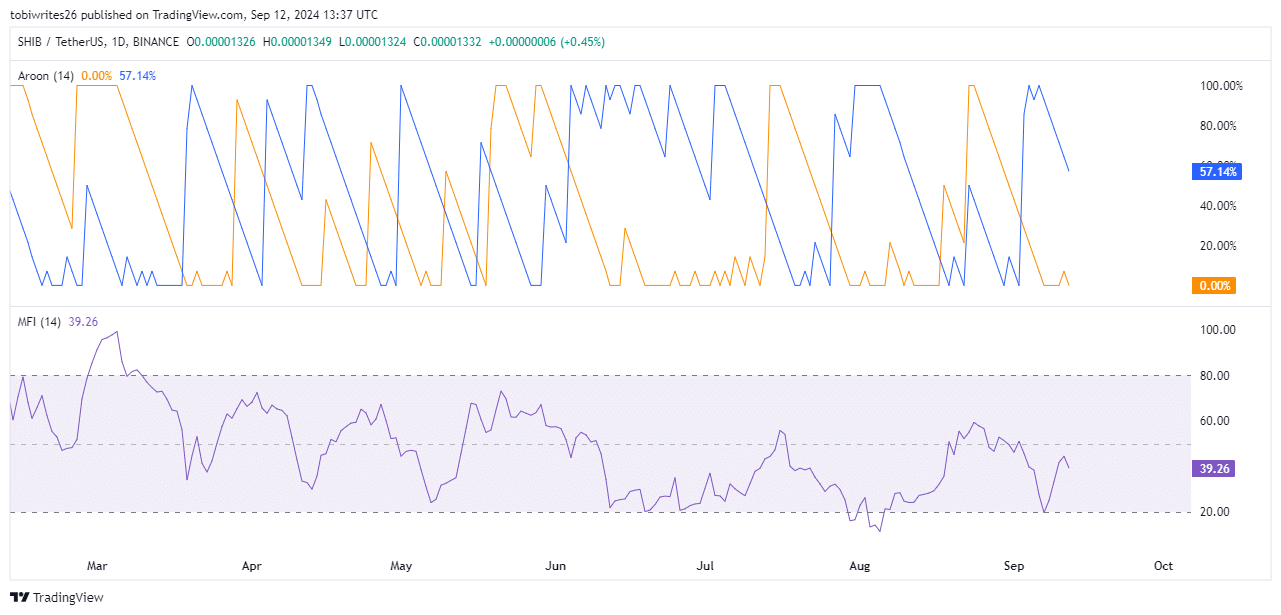
Finally, indicators such as the Aroon line and the Money Flow Index (MFI) implied an upcoming drop that could further depress SHIB’s price.
The Aroon Down line (blue) with a reading of 57.14% was positioned above the Aroon Up line (orange) at 0.00% – A sign of bearish momentum.
In plain terms, it suggested that recent lows have been more frequent than highs. This highlighted that sellers have been dominating the market and that the price may continue to fall.
Additionally, the Money Flow Index was hovering near the neutral mark at 39.33, but it begun to trend south – An indication of moderate selling pressure. It also alluded to growing bearish sentiment, although without drastic market movements.
A further decline in the MFI would likely result in a significant drop in SHIB’s value.

