Shiba Inu rebounds: The bullish case for a price surge
Shiba Inu's price action showed conflicting signs of different timeframes- but bulls have the upper hand now.

- Shiba Inu retraced nearly 20% after its rally to $0.0000152 last week
- While this price plunge was a setback, bulls have reason to believe the meme coin is headed higher
The 1-day price chart of Shiba Inu [SHIB] showed signs of accumulation. The bulls challenged the $0.0000152 resistance level on the 26th of March.
Although they faced an 18% price drop in the following days, the clues showed the memecoin was beginning to turn bullish.
The failed SHIB rally of last week

The 20% rejection from the local resistance level at $0.0000152 can be seen as a sign of bearish strength. However, that view might miss some nuances of Shiba Inu’s price action.
The trend of Bitcoin [BTC] has been bearish over the past week. In this period, BTC fell from $87.6k to $82.4k, a 5.8% drop.
This incited panic across the market, leading to sell-offs across the altcoin market, including SHIB. However, the market structure of Shiba Inu was bullish on the daily chart.
Its move beyond $0.0000138 shifted the structure. Meanwhile, the $0.0000115 level was the low that needed to be breached to flip the structure bearishly once again. This level was 9.6% below current market prices.
Alongside the price rally last week, the OBV has been trending higher for three weeks now. This signaled increased buying pressure.
The RSI was also recovering and could climb beyond neutral 50 once again to reflect bullish momentum.
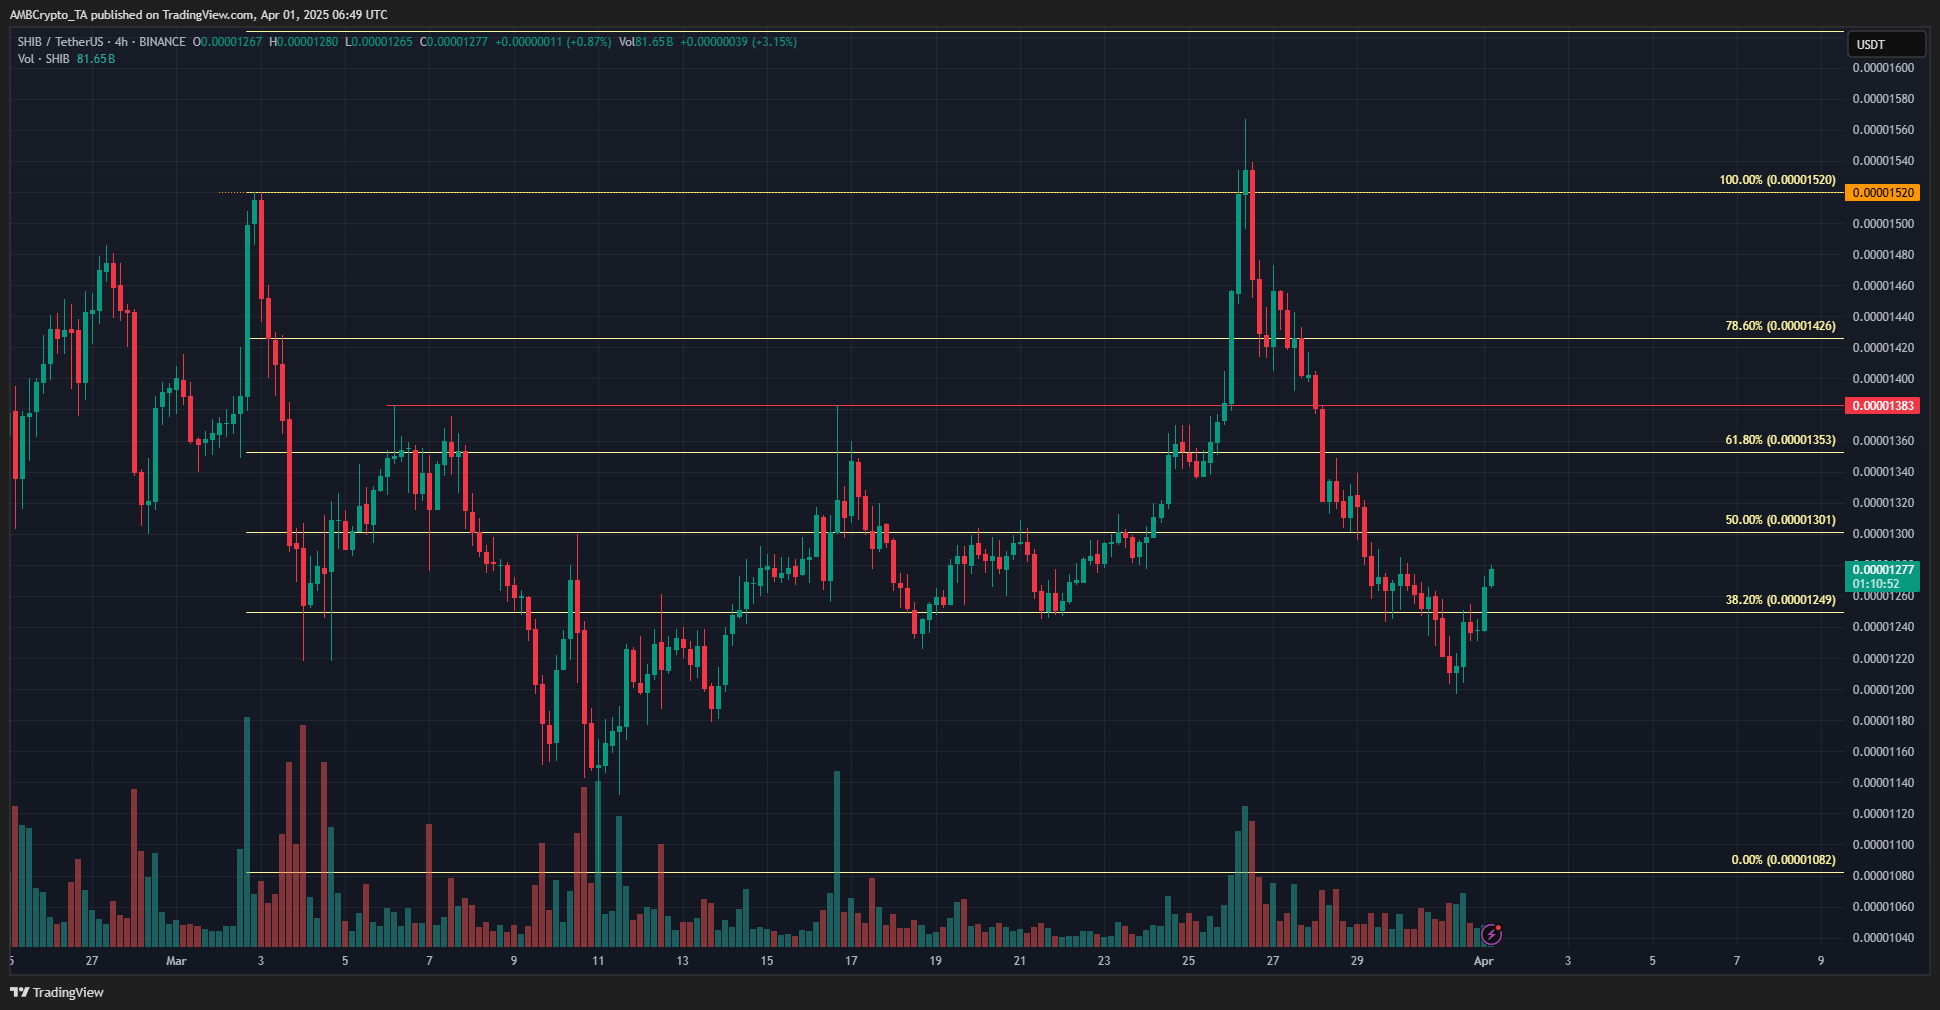
The 4-hour chart highlighted the steep losses since last Wednesday. The price was unable to defend the two short-term support levels at $0.000013 and $0.0000125 on the way down.
However, the 20% price bounce within the past 24 hours brought Shiba Inu back above $0.0000125.
Therefore, the 4-hour chart showed a bearish Shiba Inu structure, while the 1-day chart showed a bullish structure.
The higher timeframe is more important in general, which means that swing traders and investors have reason to look to open long positions.
Disclaimer: The information presented does not constitute financial, investment, trading, or other types of advice and is solely the writer’s opinion