Shiba Inu [SHIB] bulls fight to defend support zone, could force a 14% bounce
![Shiba Inu [SHIB] bulls fight to defend support zone, could force a 14% bounce](https://ambcrypto.com/wp-content/uploads/2023/04/PP-2-SHIB-cover-e1682670314249.jpeg)
Disclaimer: The information presented does not constitute financial, investment, trading, or other types of advice and is solely the writer’s opinion.
- The 12-hour market structure was bearish.
- Despite this bearish leaning, there was a good chance that Shiba Inu could see a bounce in prices.
Shiba Inu (SHIB) has oscillated between two levels of resistance and support over the past seven weeks. Neither bulls nor bears have yet mustered the strength to force a breakout in their direction.
Realistic or not, here’s SHIB’s market cap in BTC’s terms
On-chain metrics showed that strong selling pressure was not seen in recent weeks. With Bitcoin (BTC) above the $28.8k level, it appeared that the crypto market could move upwards again, although there were significant resistance levels overhead to watch out for.
Range formation for SHIB traders but demand did not materialize yet
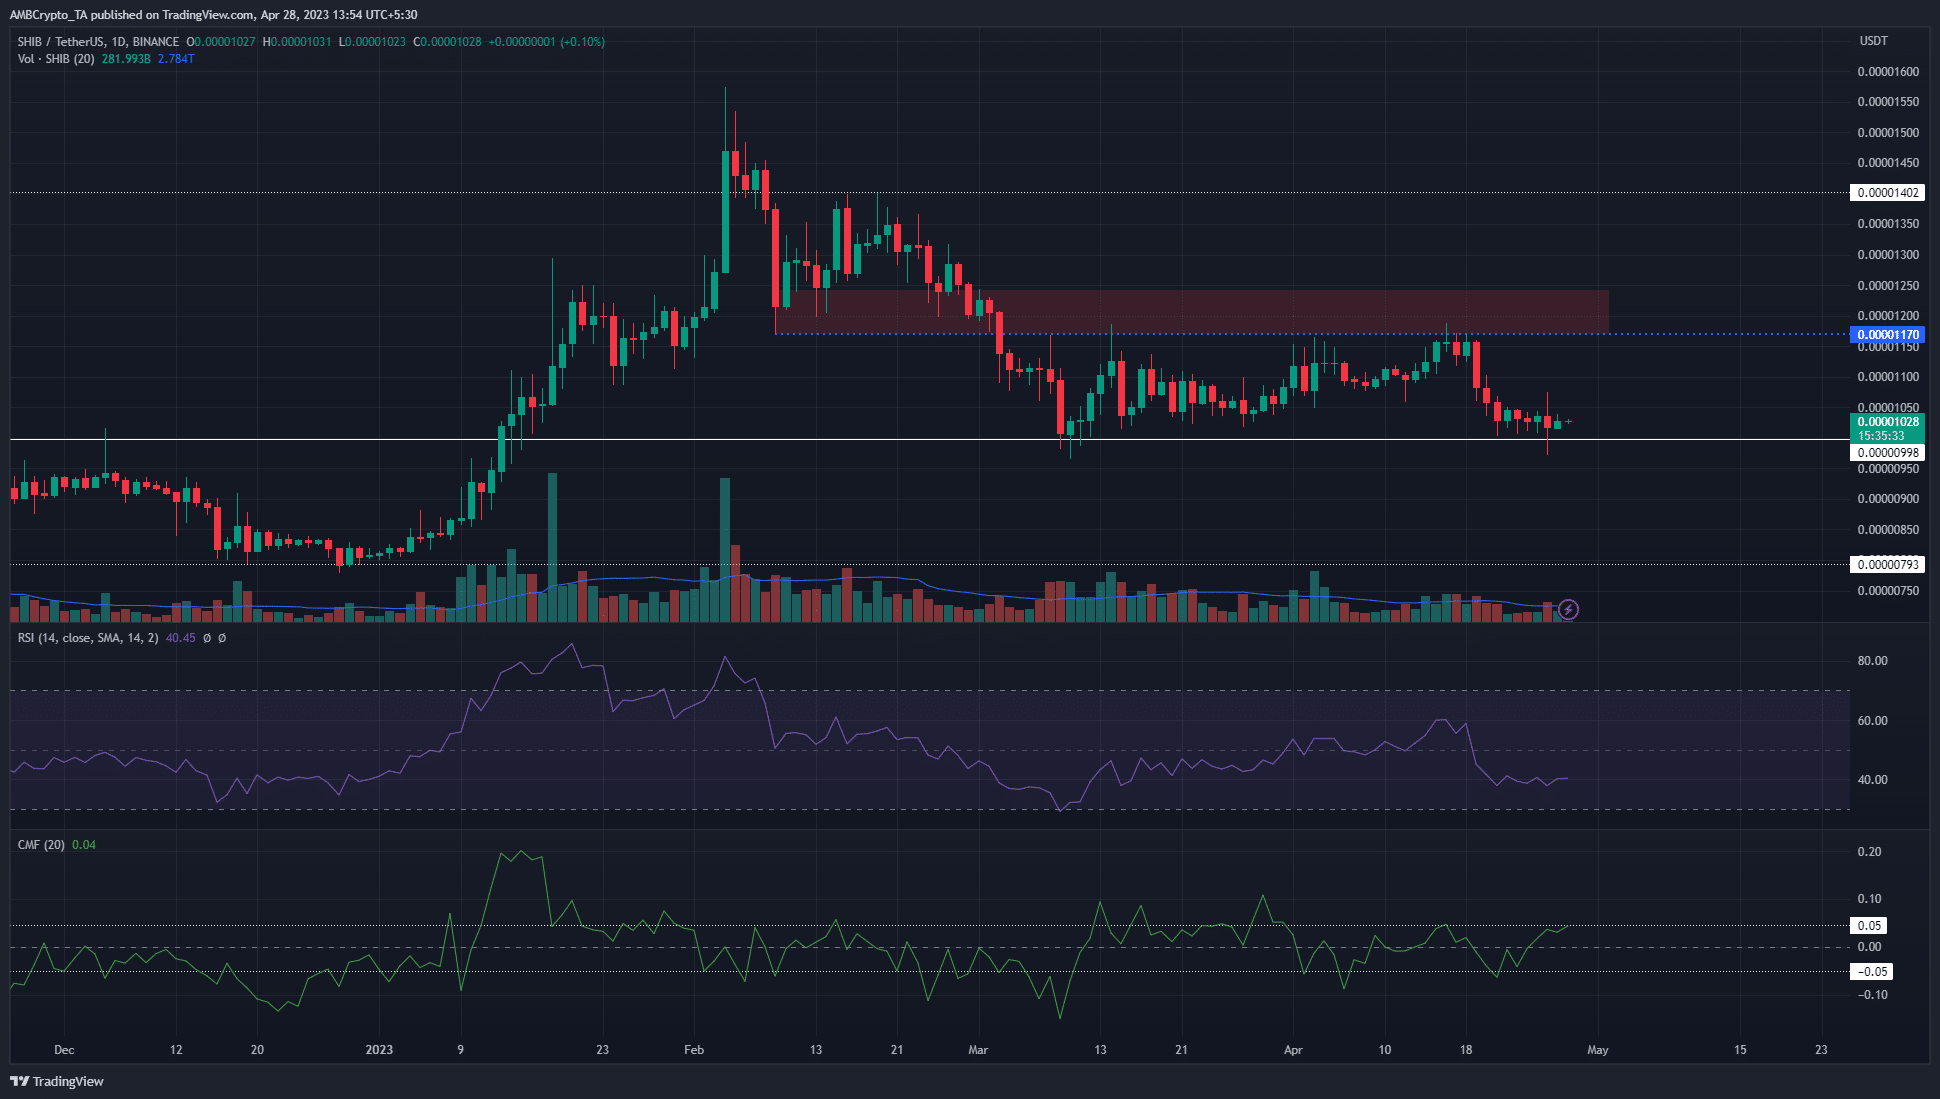
In the past two months, Shiba Inu has traded within a range that extended from $0.00000987 to $0.0000117. The red box highlighted a bearish breaker on the four-hour chart that formed in early February.
This area had been a bullish order block, but it was broken on 2 March. Since then, it has served as a strong resistance zone. SHIB bulls have been unsuccessful in breaching this region over the past two months.
At press time, the market structure on the 12-hour chart was bearish. The RSI was beneath 50 but only showed weak bearish momentum and not a strong trend yet. The CMF continued to bounce between -0.05 and +0.05 and showed that significant capital flow was not yet seen, but the bulls might change this soon.
Shiba Inu traders can look to long SHIB since the $0.00000987 support has served well in recent weeks. It was a good risk-to-reward trade, with the only concern being the lack of trading volume recently. This was indicative of a lack of demand for the meme coin.
How much are 1,10,100 SHIBs worth today?
Exchange flows did not ring alarm bells in recent weeks

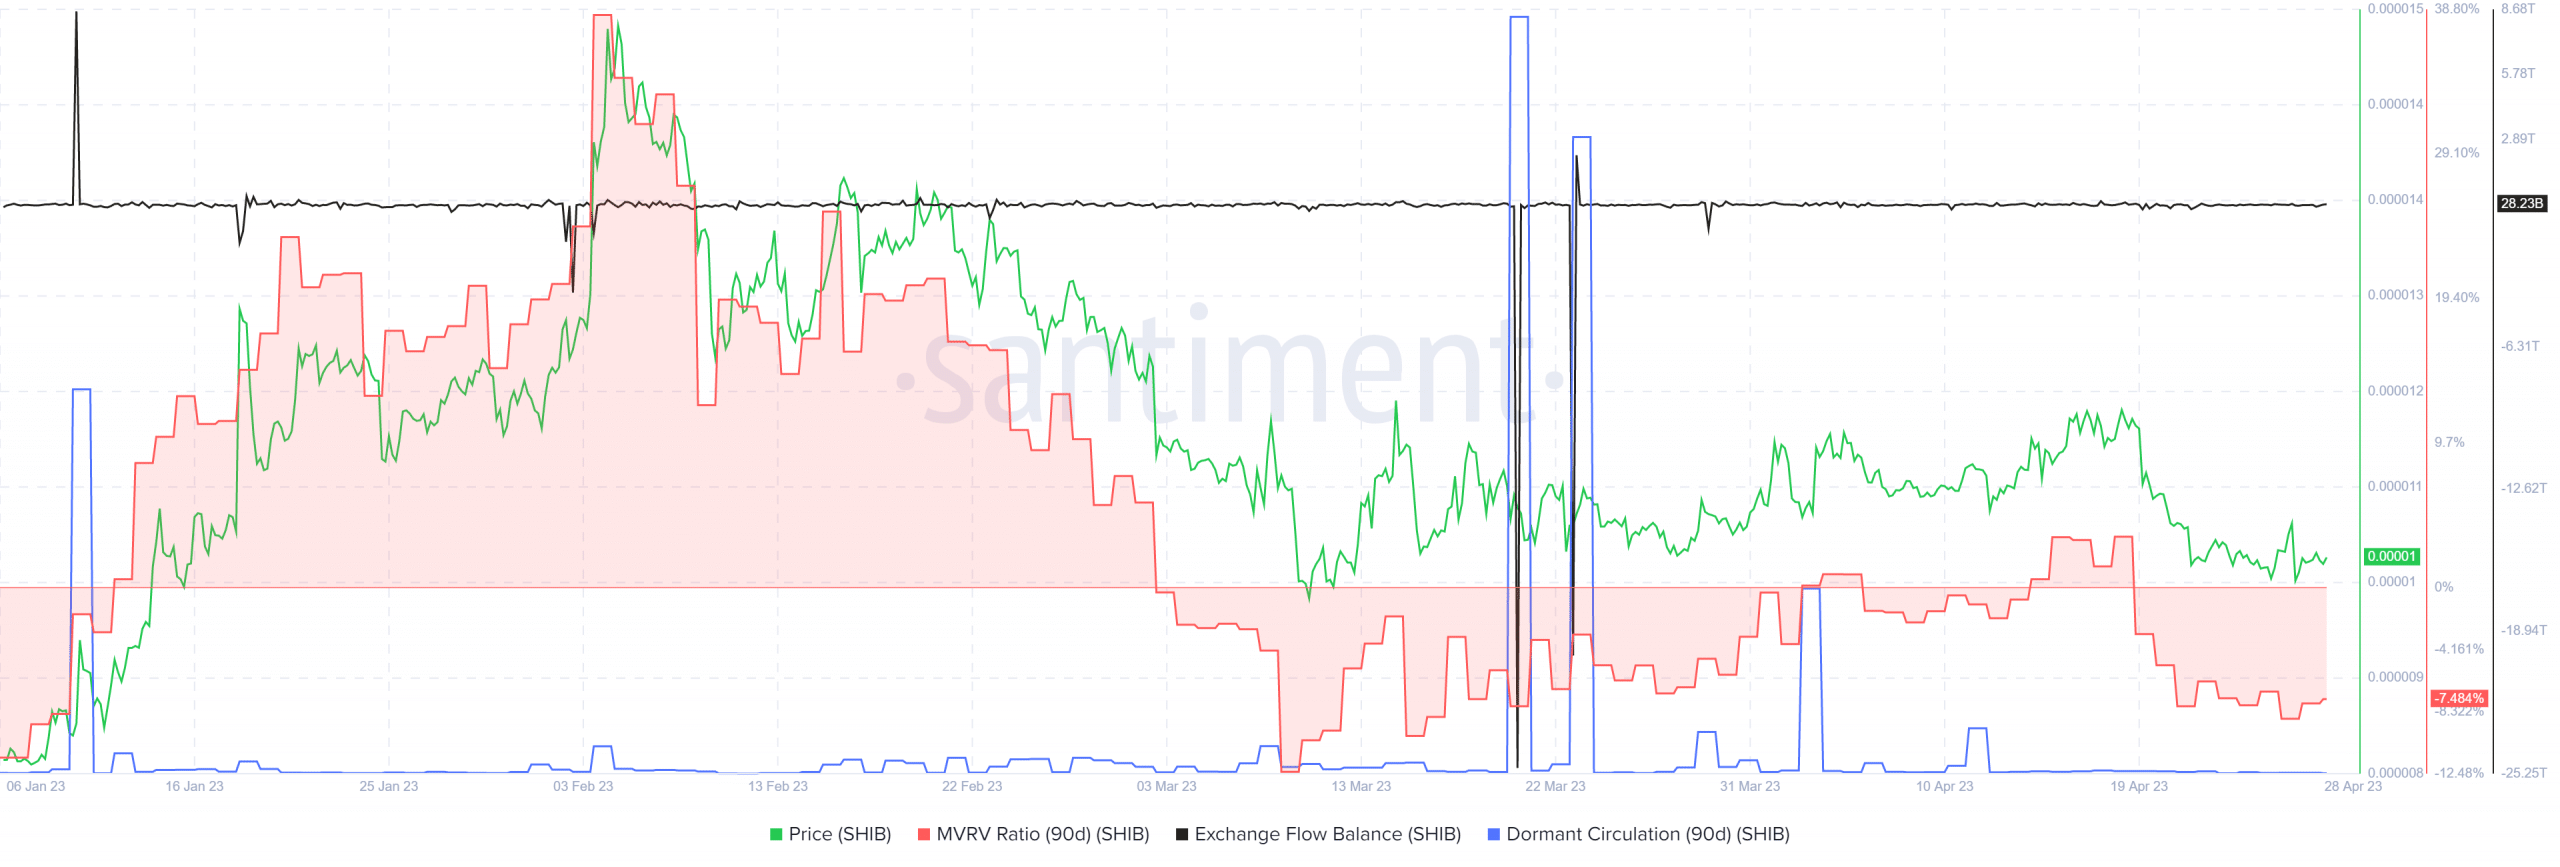
Source: Santiment
In March, there was a huge spike in both the exchange flow balance and dormant circulation metrics. This indicated enormous selling pressure on 20 and 23 March. Since then, neither metric rose to those levels. The dormant circulation has been extremely low in the past two weeks, which highlighted the possibility of SHIB accumulation.
The MVRV ratio was below zero and showed that holders were at a loss. Significant exchange outflows near the two-month range lows could be indicative of accumulation from bulls, and traders can watch out for this development.


