Shiba Inu [SHIB] investors should consider these levels before making a strong call

Leading meme coin Shiba Inu [SHIB] looks to have left its dominance to fate. After initially surpassing Polygon [MATIC] and Tron [TRX] earlier, SHIB has reversed its motion. Now ranked 15th in terms of market cap, the SHIB price decreased despite a previous green week.
At the time of this writing, SHIB declined 4.25% within the last 24 hours. Its price was also at $0.000011 with a reduced 24-hour volume. However, investors may be considering looking at these levels as a bottom. Before making a decision, it could be important to look at some metrics.
But what exactly?
One of the most notable changes in the SHIB ecosystem is its active withdrawals. According to Santiment data, SHIB active withdrawals had significantly decreased. On 21 July, active withdrawals were still as high as 788, considering that SHIB had made traders some profits. However, it has gone on a downward trend since then. At press time, it was merely 172.
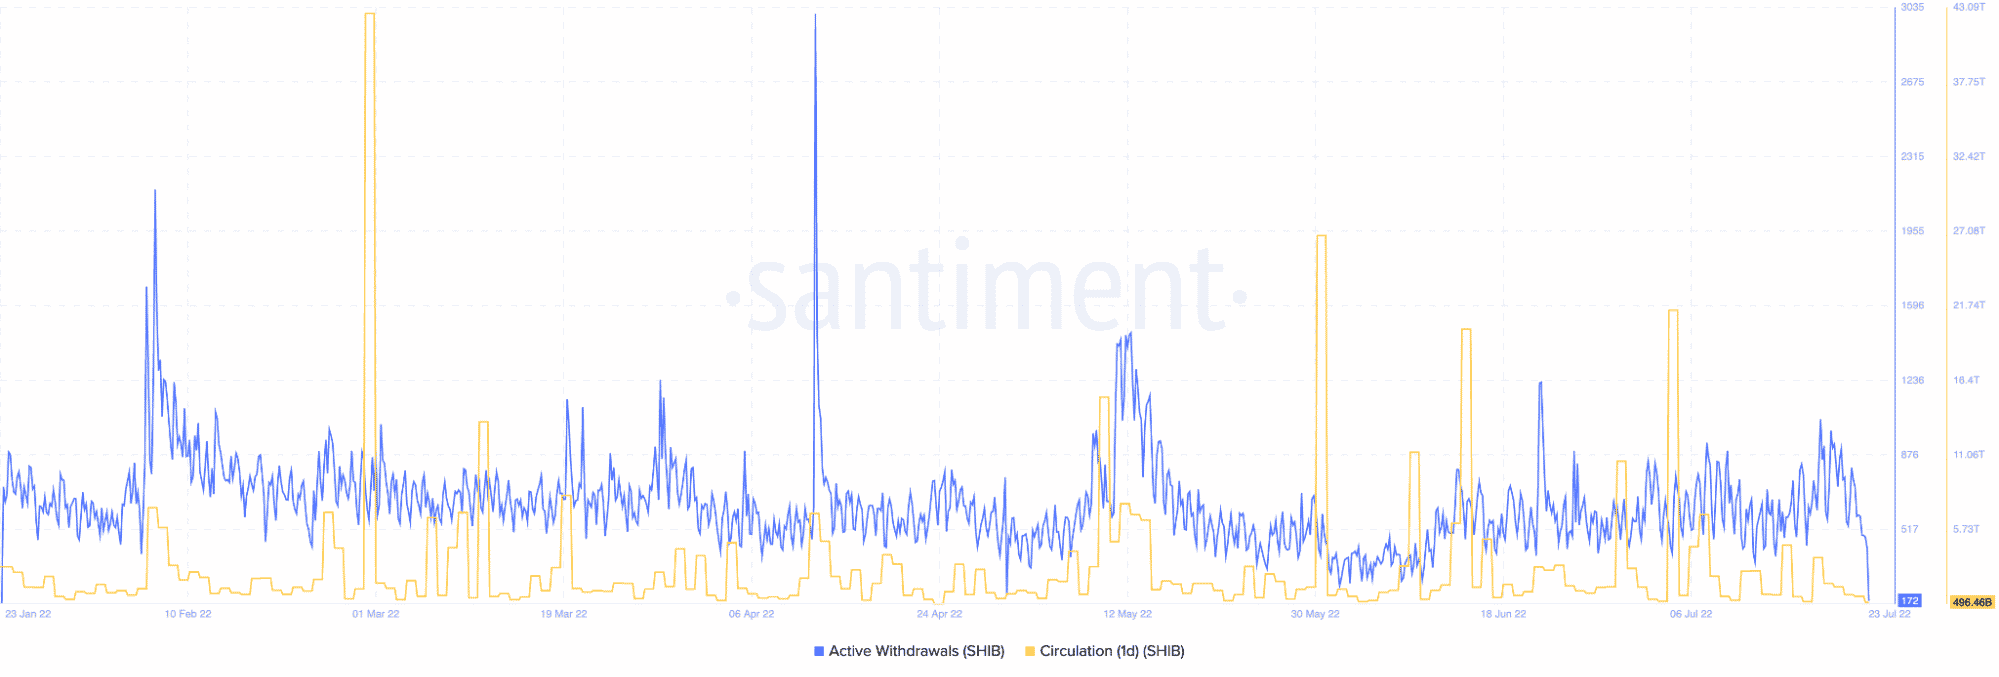
Similarly, the one-day (1d) circulation within the Shiba Inu ecosystem had also fallen. As of 21 July, it was 1.56 trillion. As of 23 July, it stood at 496.46 billion. Despite massive whale action a few weeks ago leading to a short bull run, the effect seems to have halted.
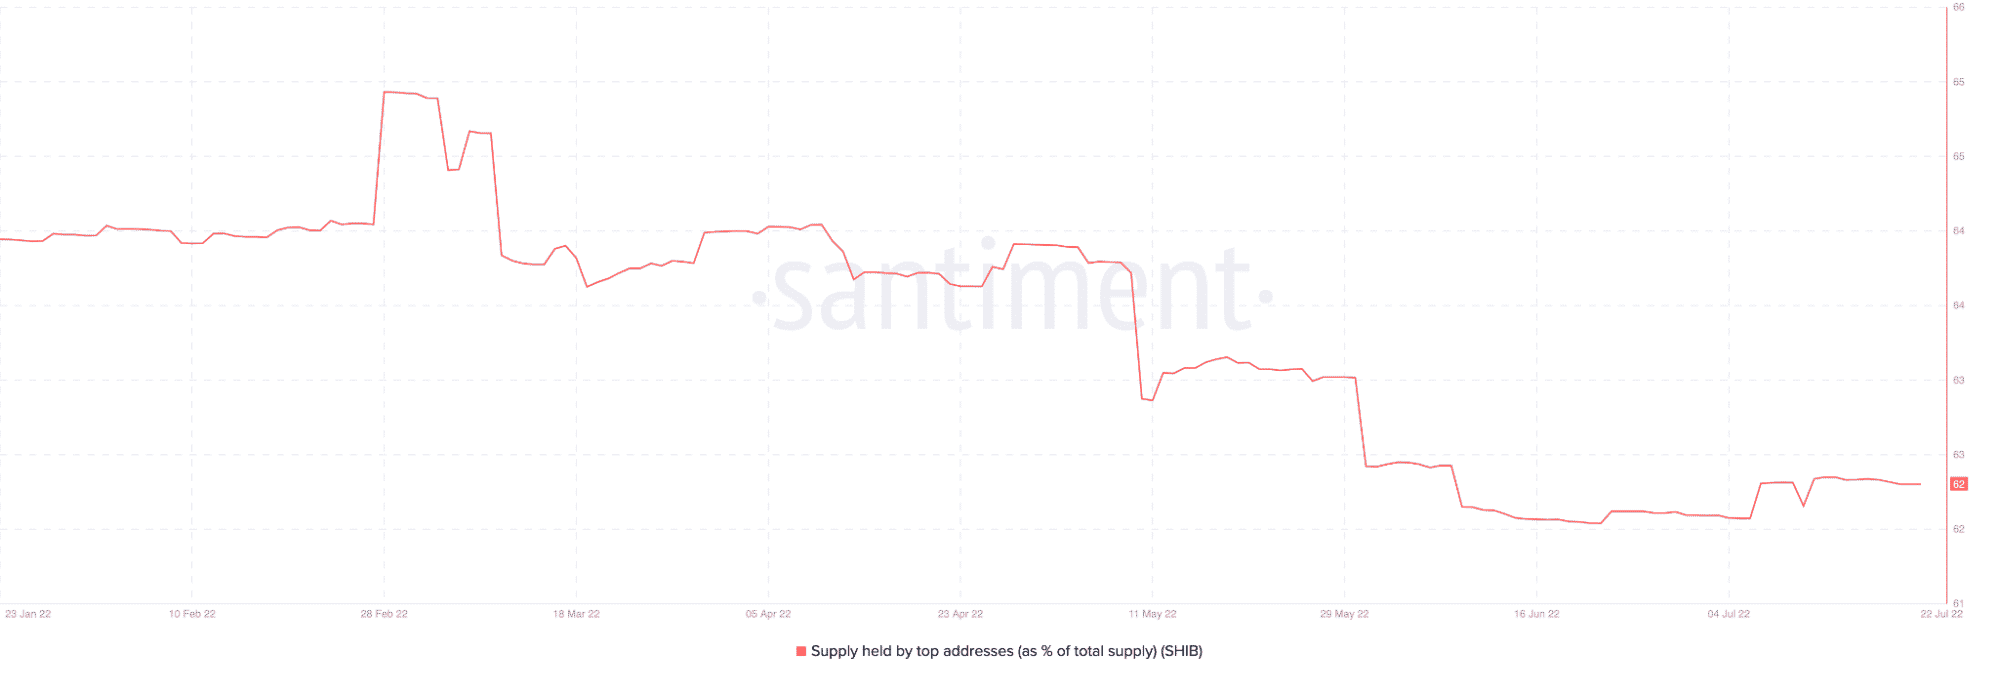
Reports showed that whale activity had remained stable since last week. The supply held by top addresses remained stagnant at 62. So, it may seem that following a bearish or bullish target should not be the most critical concern for investors. Yet, it is still essential to review its potential price movement.
Which way forward?
The Moving Average Convergence Divergence (MACD) seems undecided with the next SHIB momentum. According to TradingView results, the MACD indicated some form of neutral stance as the buyers and sellers seem to be in a spring struggle for control. At press time, sellers still had some edge over the bullish faithful.
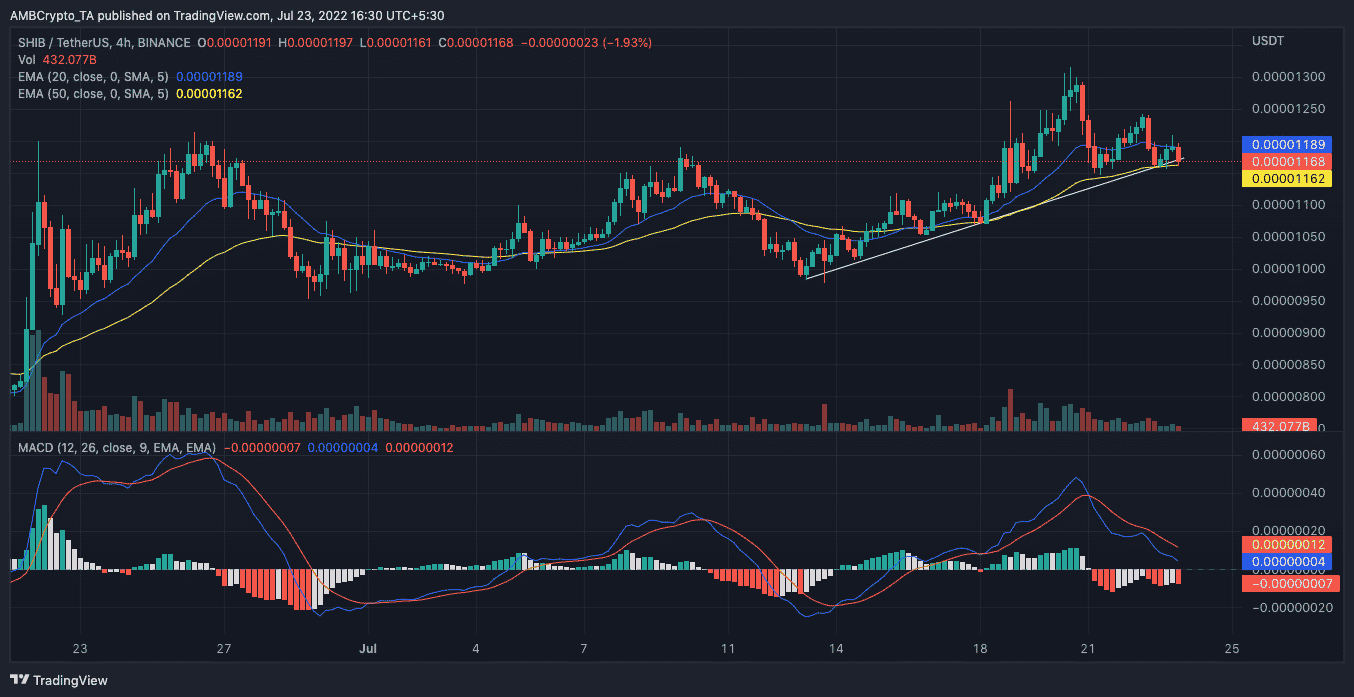
However, the Exponential Moving Average (EMA) disagreed slightly with the MACD results. The 20-period EMA (blue) was above the 50 EMA (orange), indicating that buyers were experiencing more stability than the sellers.