Shiba Inu: Shorting opportunities could arise if SHIB falls below this range

After constantly failing to sustain above the four-hour 20 EMA (red) and the 50 EMA (cyan), Shiba Inu [SHIB] continued to exhibit a bearish preference.
The current setup revealed a descending triangle structure as the sellers ramp up their efforts to find fresher grounds. The immediate trendline resistance (white, dashed) would play a crucial role in influencing the upcoming movements.
At press time, SHIB traded at $0.01065. (For brevity, SHIB prices are multiplied by 1,000 from here on).
SHIB 4-hour Chart
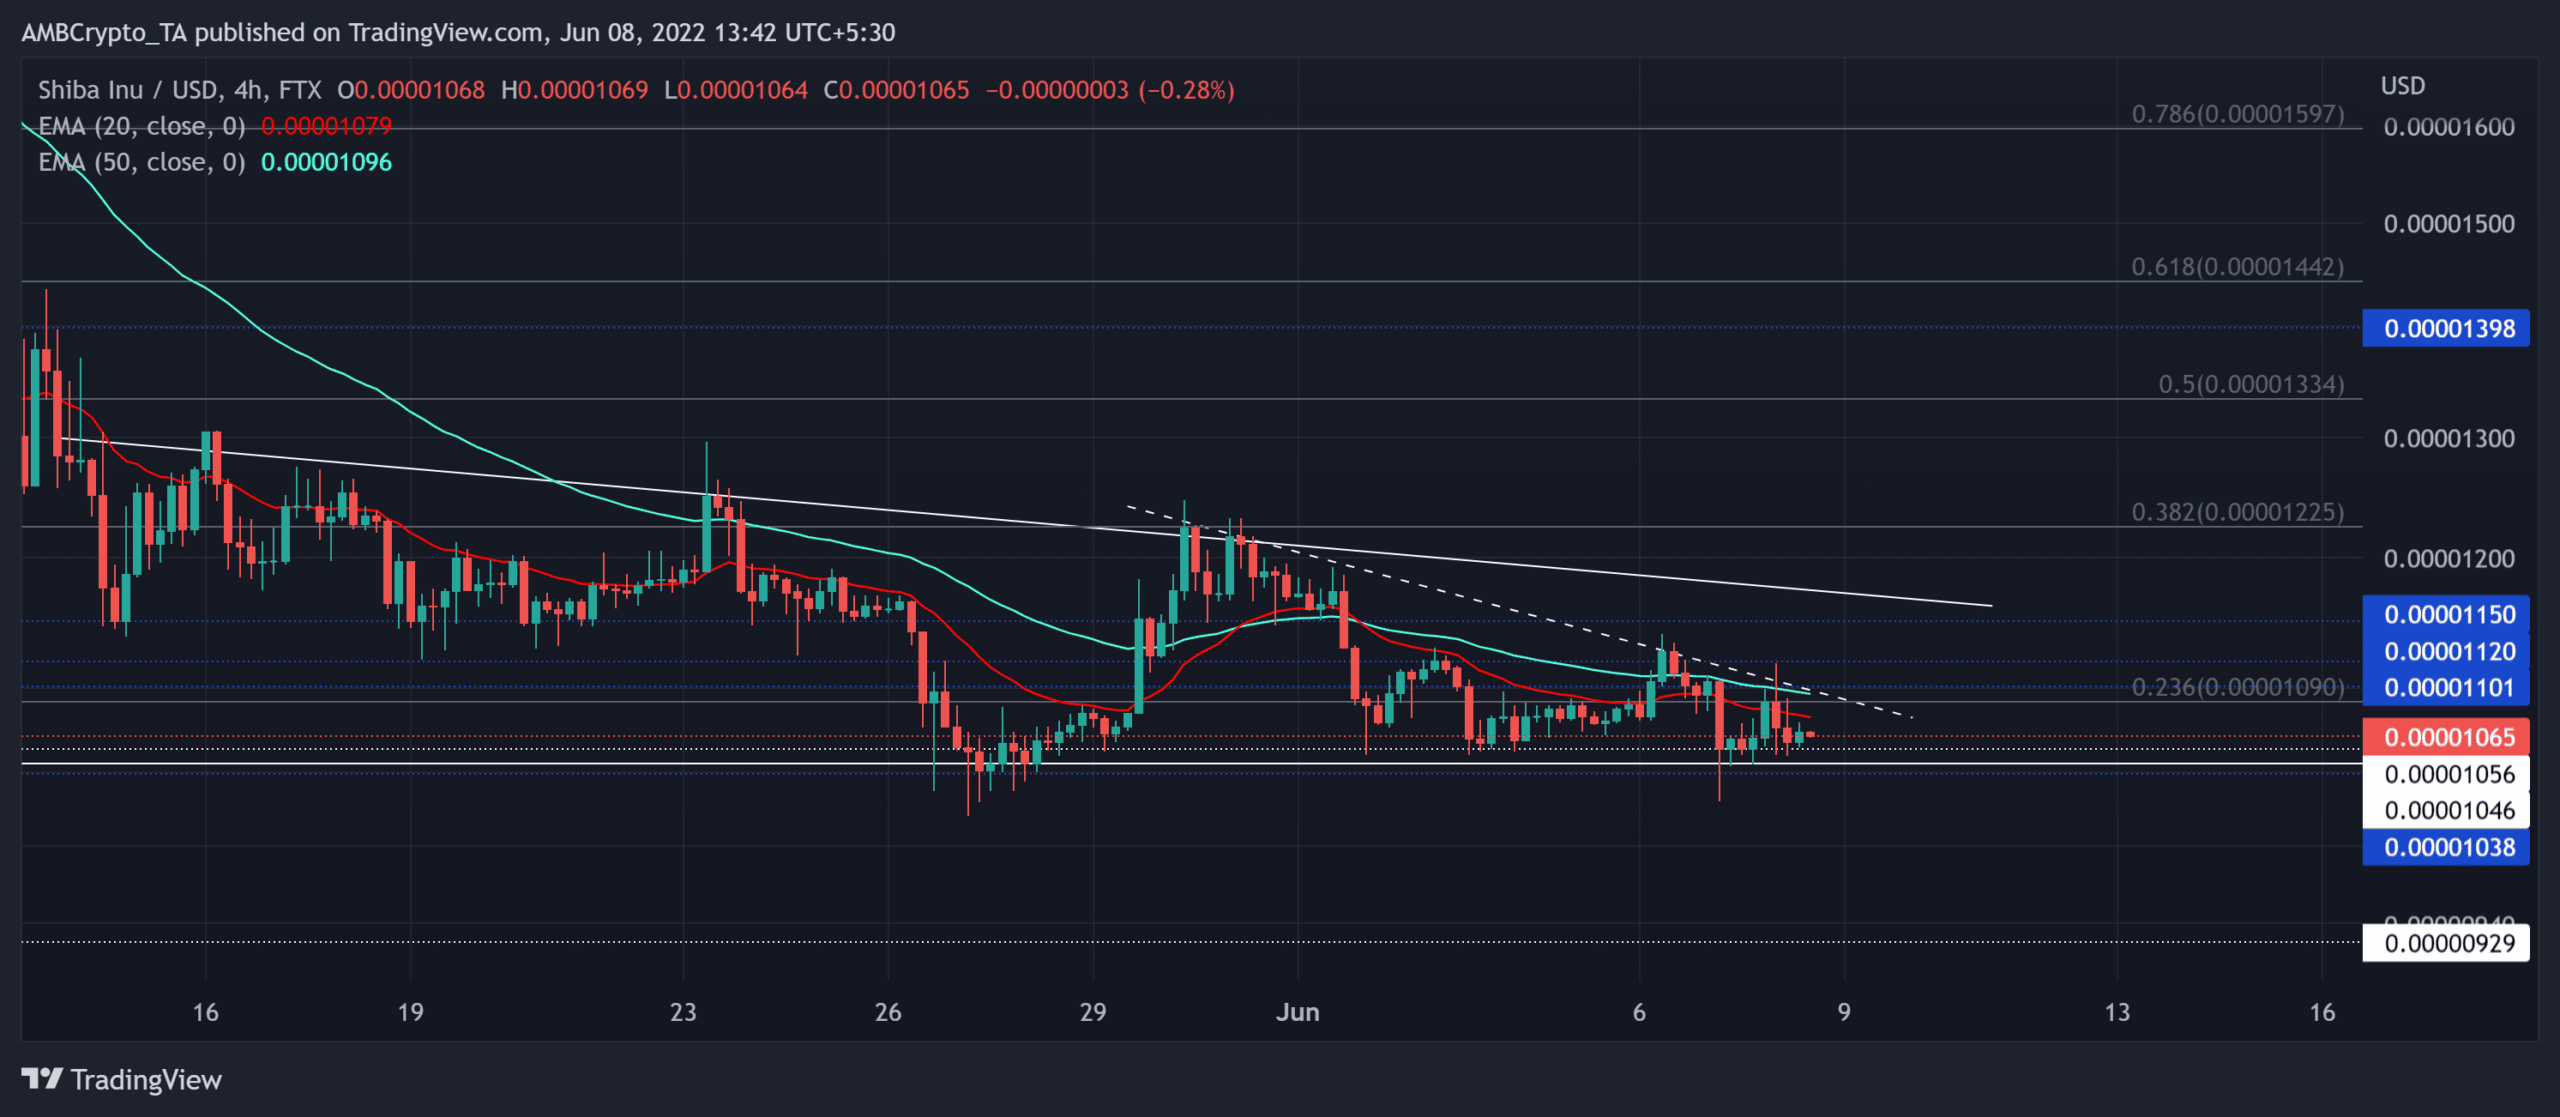
After consolidating within the bounds of a symmetrical triangle for three months, the meme-coin saw a down break due to its previous downtrend. This fall registered a 60% drop (from 21 April) toward its seven-month low on 12 May.
Over the last month, SHIB saw a string of lower peaks while maintaining its horizontal support at the $0.01046-level. Thus, it chalked out a descending triangle on the four-hour timeframe.
With the 20 EMA looking south yet again, the near-term recovery prospects seemed relatively weak. Further, the volumes have also been receding. The recent selling volumes were higher than the buyer orders.
With the price action hovering near the moving averages, the alt would aim to break its compression phase and break into high volatility in the days to come.
An immediate recovery can see a reversal from the 23.6% Fibonacci level that coincided with the trendline resistance. A fall below the $0.01046-$0.01038 range would lay forth shorting opportunities. In this case, the take-profit levels could be in the $0.0095-zone.
However, a revival beyond the 23.6% level could provide the bulls a much-needed force to inflict a near-term uptrend toward the $0.0115-mark.
Rationale

The RSI has been moving around the neutral zone for the last few days. A consistent sway below the equilibrium could ultimately play out in favor of the sellers.
Interestingly, the OBV’s lower troughs bullishly diverged with the price action over the past day. Thus, a near-term bounce-back from its immediate support seemed plausible. However, the altcoin’s directional trend [ADX] seemed substantially weak.
Conclusion
Considering the juncture of multiple resistances near the 23.6% level and the south-looking 20 EMA, the bears could assume a short-term edge. A breach of its seven-month support could trigger a shorting signal with take-profit levels as suggested above.
The alt shares a 37% 30-day correlation with Bitcoin. Hence, keeping an eye on Bitcoin’s movement with the overall market sentiment could be essential for making a profitable move.