Shiba Inu slips 10% in a day: What’s behind the plunge?
SHIB has initiated a decline toward the lower line of its symmetrical triangle, hinting at a move toward a key support level.

- SHIB’s value has dropped by almost 10% in the past 24 hours.
- With significant bearish influence, the meme asset may witness a further decline.
Leading memecoin Shiba Inu [SHIB] has failed to record any rally post-ETF approval, causing its price to drop by almost 10% in the past 24 hours.
According to CoinMarketCap, at press time, the meme asset exchanged hands at $0.000023.
SHIB poised for more losses
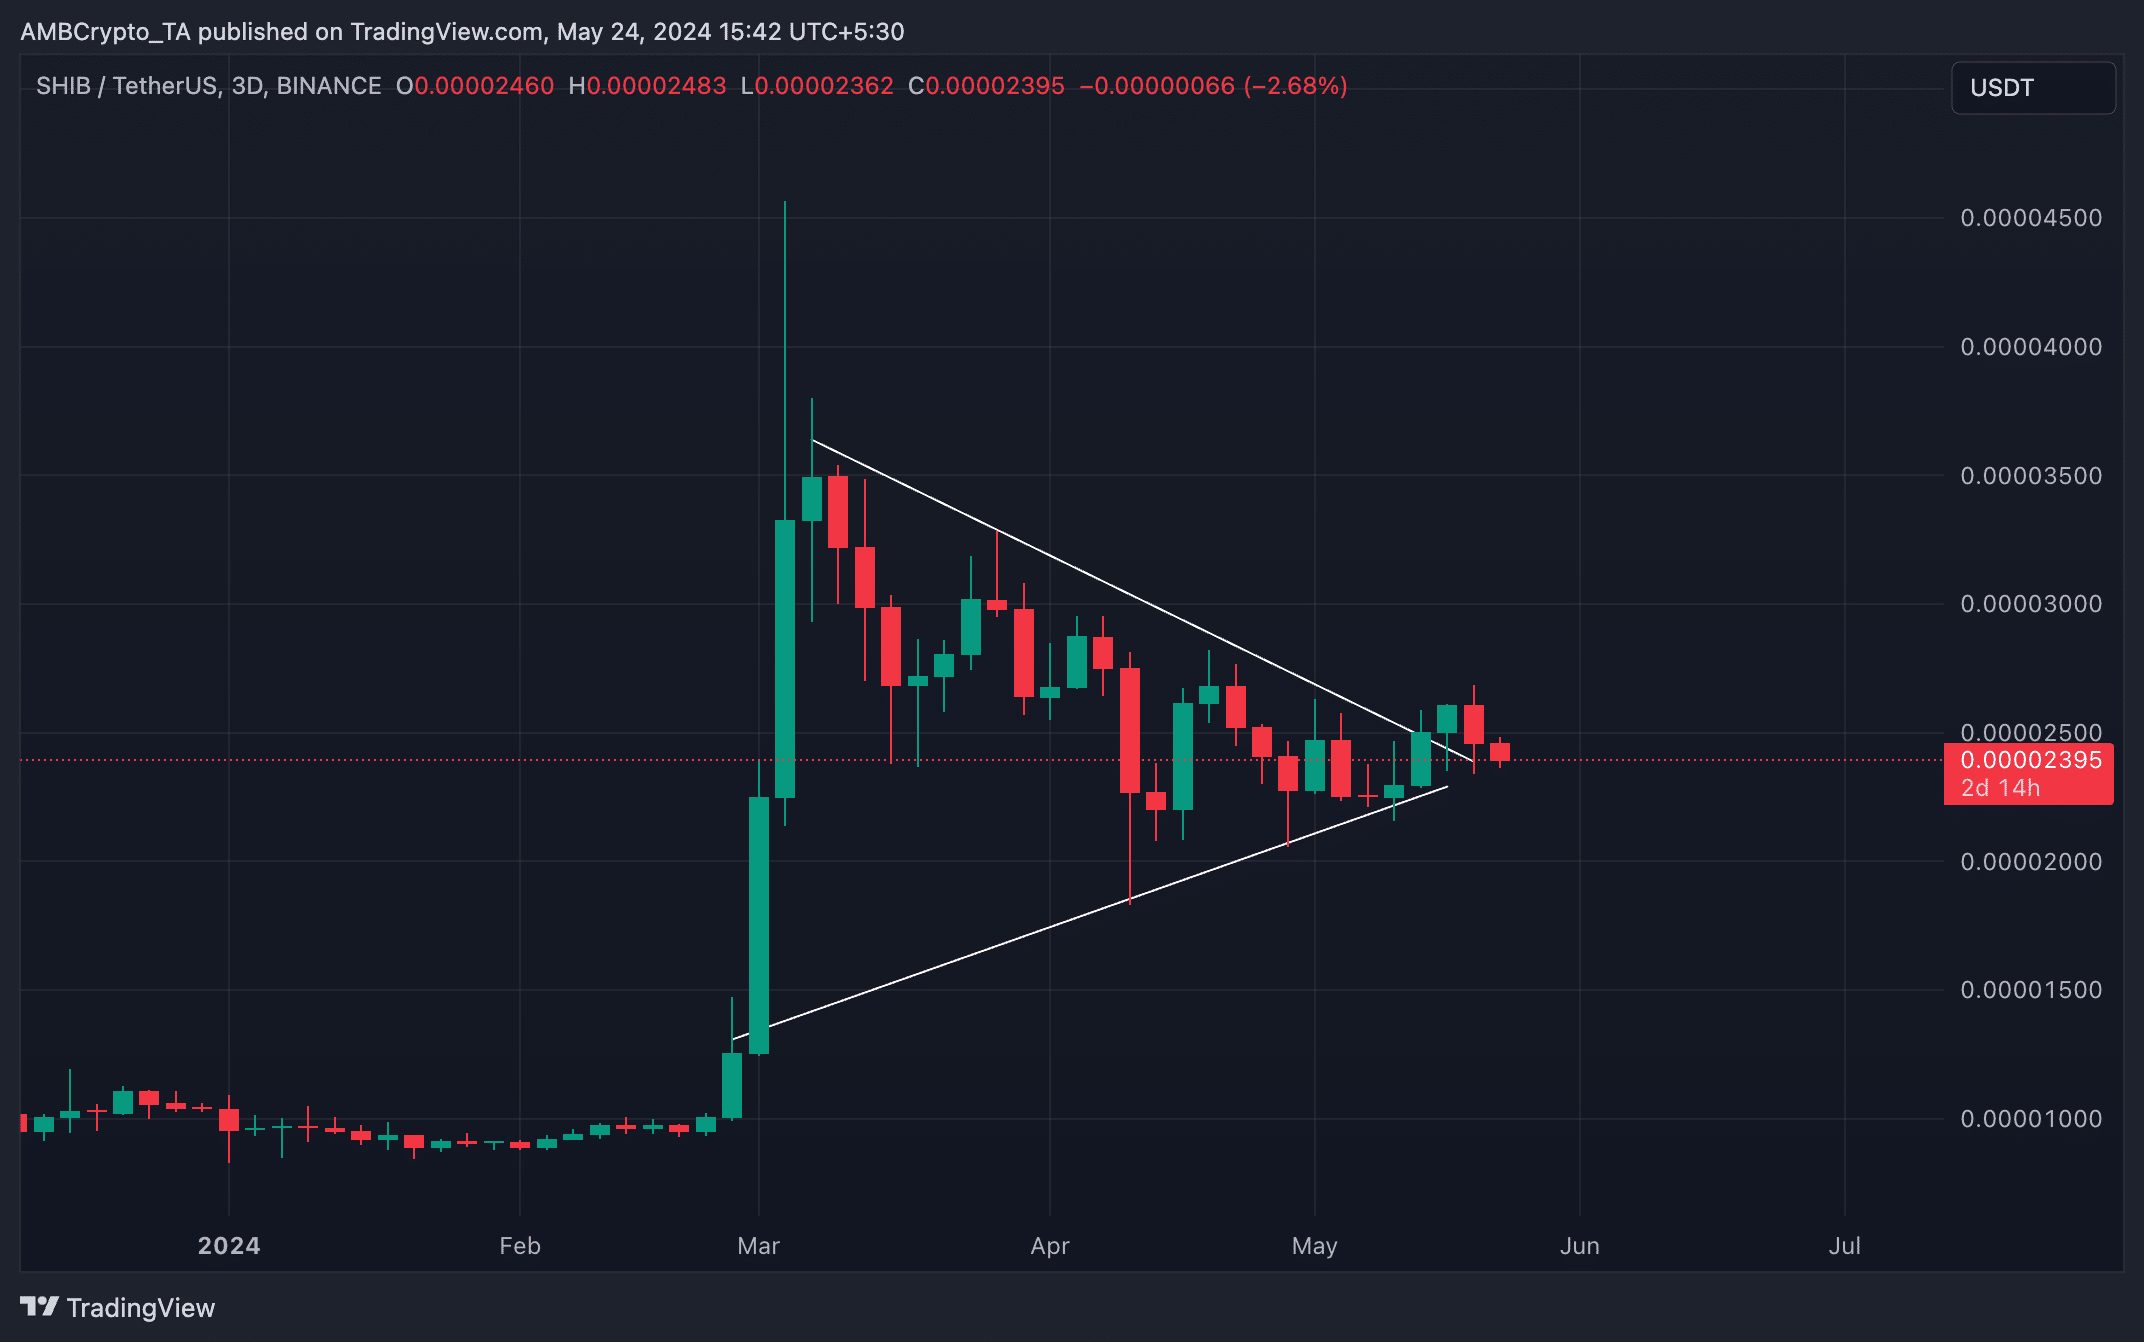
An assessment of SHIB’s price movements on a 3-day chart revealed that it broke out of a symmetrical triangle in an uptrend on 18th May.
However, the coin’s price peaked at a high of $0.000026 and has since dropped 12%.
When an asset trades within a symmetrical triangle, its price continues to hit various lower highs and higher lows. It suggests that the asset’s price is consolidating within a tight range, with buyers pushing prices up to meet resistance and sellers pushing them down to find support.
SHIB’s upward breakout on 18 May was a rally past resistance. However, the 12% decline in its value in the past two days has forced its price back toward the lower line of the triangle, which forms support.
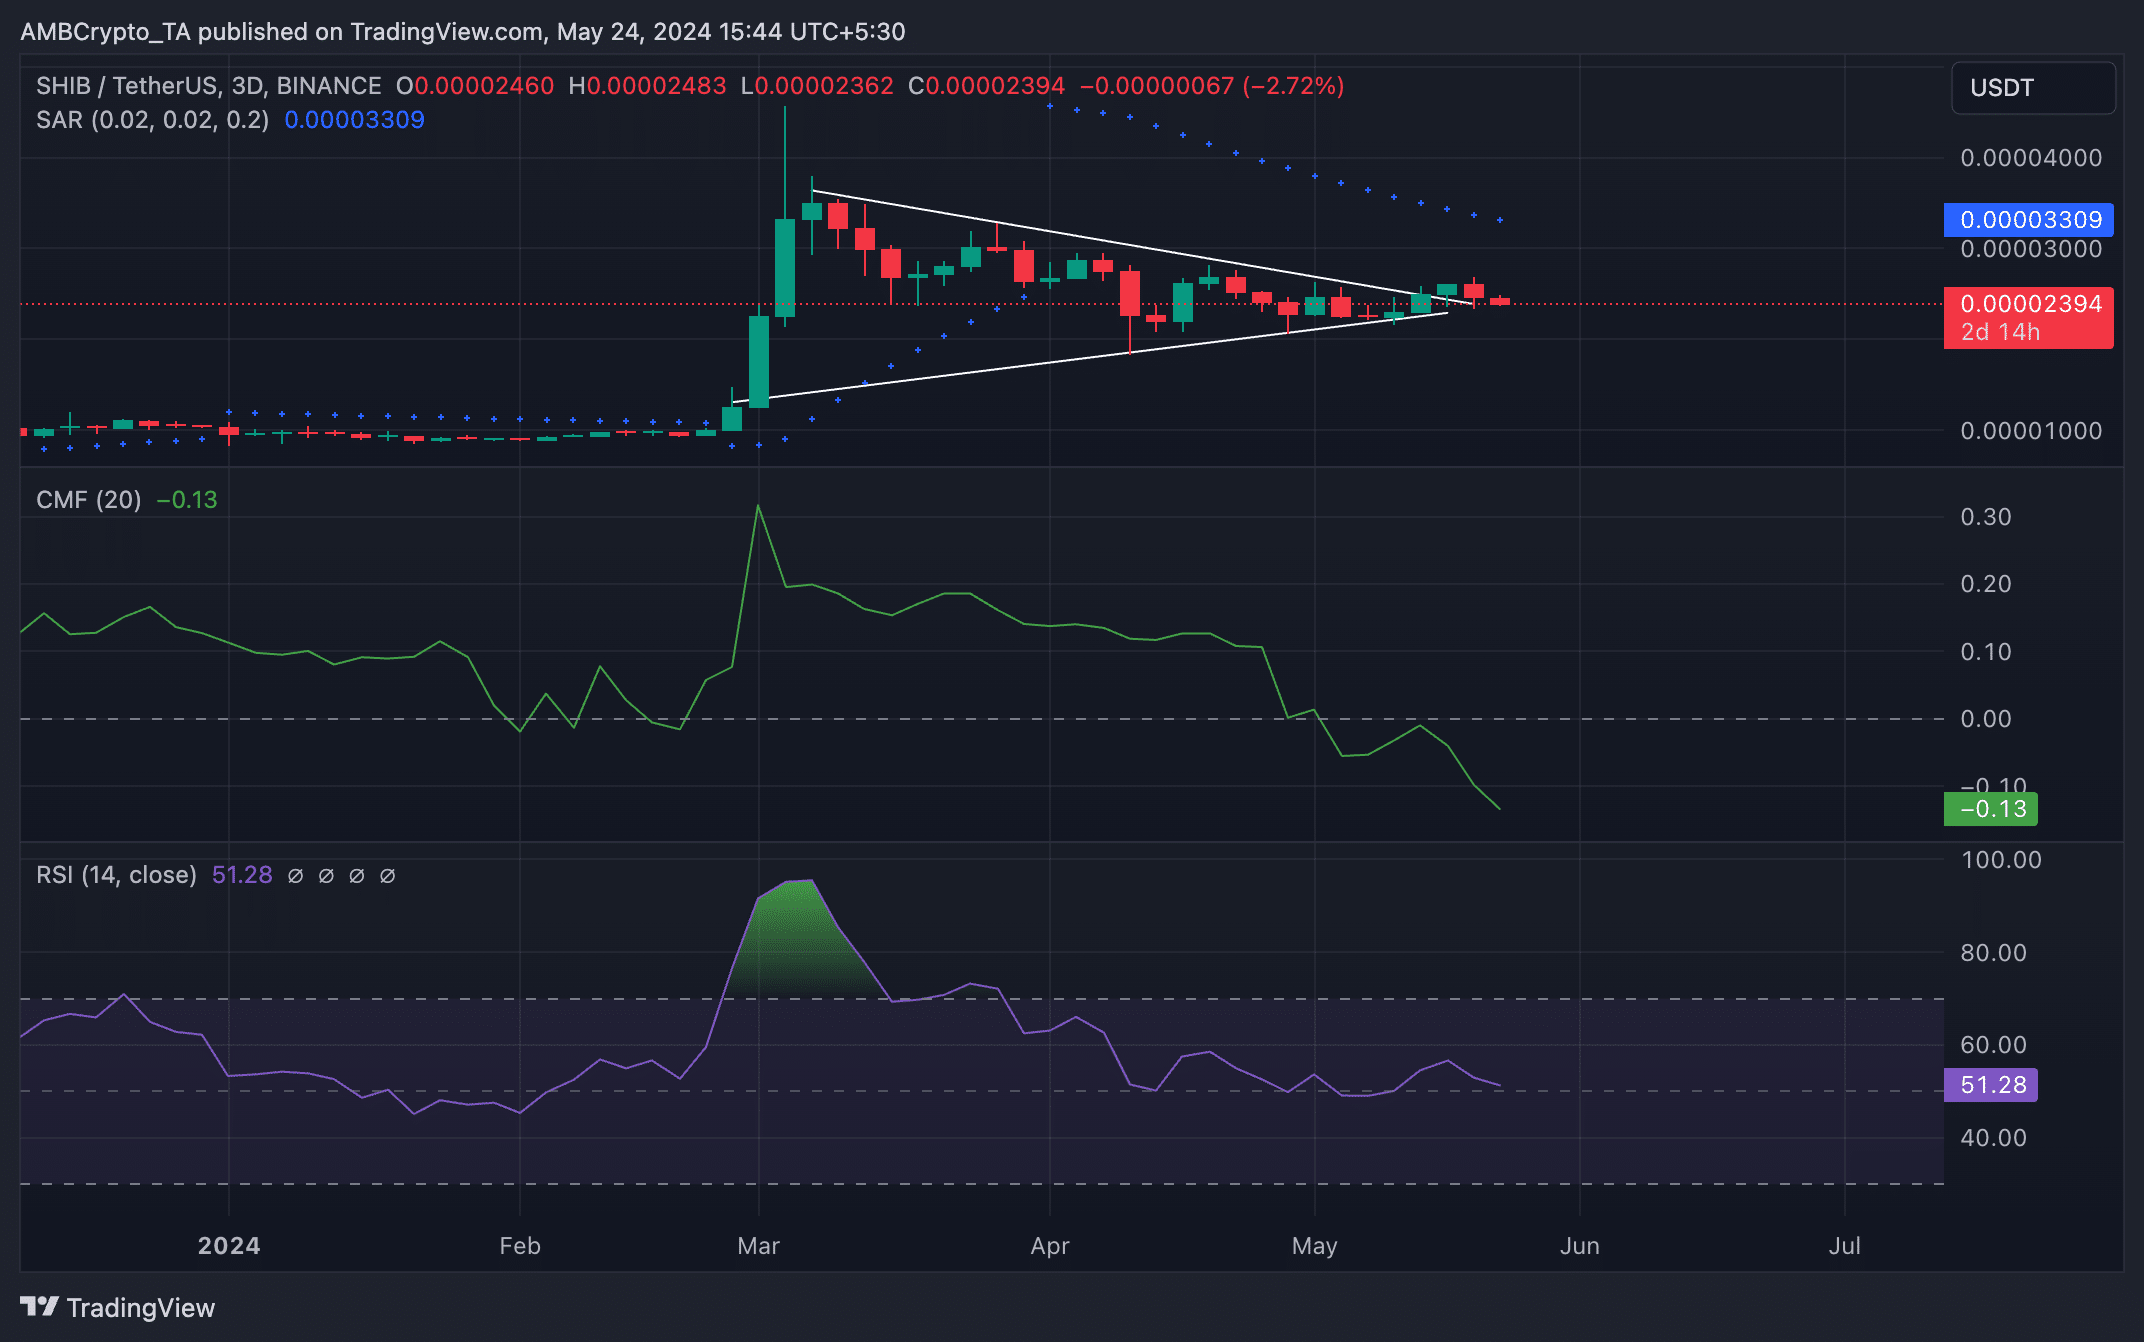
AMBCrypto’s readings of some of SHIB’s key technical indicators hinted at the possibility of a continued downtrend.
Firstly, the meme coin’s Chaikin Money Flow (CMF) returned a negative value of -0.13 and remained in a downtrend at press time. When an asset’s CMF is negative, it is a sign of an uptick in liquidity exit, a known precursor to a price decline.
Lending credence to the position above, SHIB’s Money Flow Index (MFI) was below its 50-neutral spot at 44.59. This signaled that market participants preferred to sell their coin holdings over accumulating new ones.
Further, at press time, the dots of SHIB’s Parabolic SAR indicator rested above its price. The indicator identifies SHIB’s potential trend direction and price reversals.
Read Shiba Inu’s [SHIB] Price Prediction 2024-2025
When its dotted lines are placed above an asset’s price, the market is said to be in a decline. It indicates that the asset’s price has been falling and may continue.
Despite this, SHIB’s futures traders have continued to open long positions. According to Coinglass’ data, SHIB’s futures funding rate has remained positive as market participants demand more long positions over short ones.