Shiba Inu, The Sandbox, Bitcoin Cash Price Analysis: 24 December

While Bitcoin crossed $51,200 and Ether jumped above $4,100, the recovery seemed to be rather swift. Shiba Inu regained its lost $0.000035 support while the Sandbox and BCH broke above their Fibonacci resistance levels.
Now, bulls will need a sustained rally with high volumes to confirm a possible reversal.
Shiba Inu (SHIB)

Over the past three days, SHIB bulls re-claimed the crucial $0.000035 nine-week support. After a down-channel breakdown, the alt found longer timeframe support at the $0.000029-mark. Thus, the price action saw a steep surge from this level and formed an ascending broadening wedge.
SHIB registered a 36.34% gain from the 20 December low. The immediate hurdle for the bears stood at the lower trendline (white) that also coincided with the 200-SMA (green). Any further breakdowns from there would find a testing ground at the $0.000035-level.
At press time, SHIB traded at $0.00003844. The RSI swayed near the overbought region and visibly favored the bulls. Also, The EMA ribbons flipped after a long time to show a bullish advantage. However, the lower highs marked on the Volume Oscillator indicated that buyers were still not in complete control.
The Sandbox (SAND)
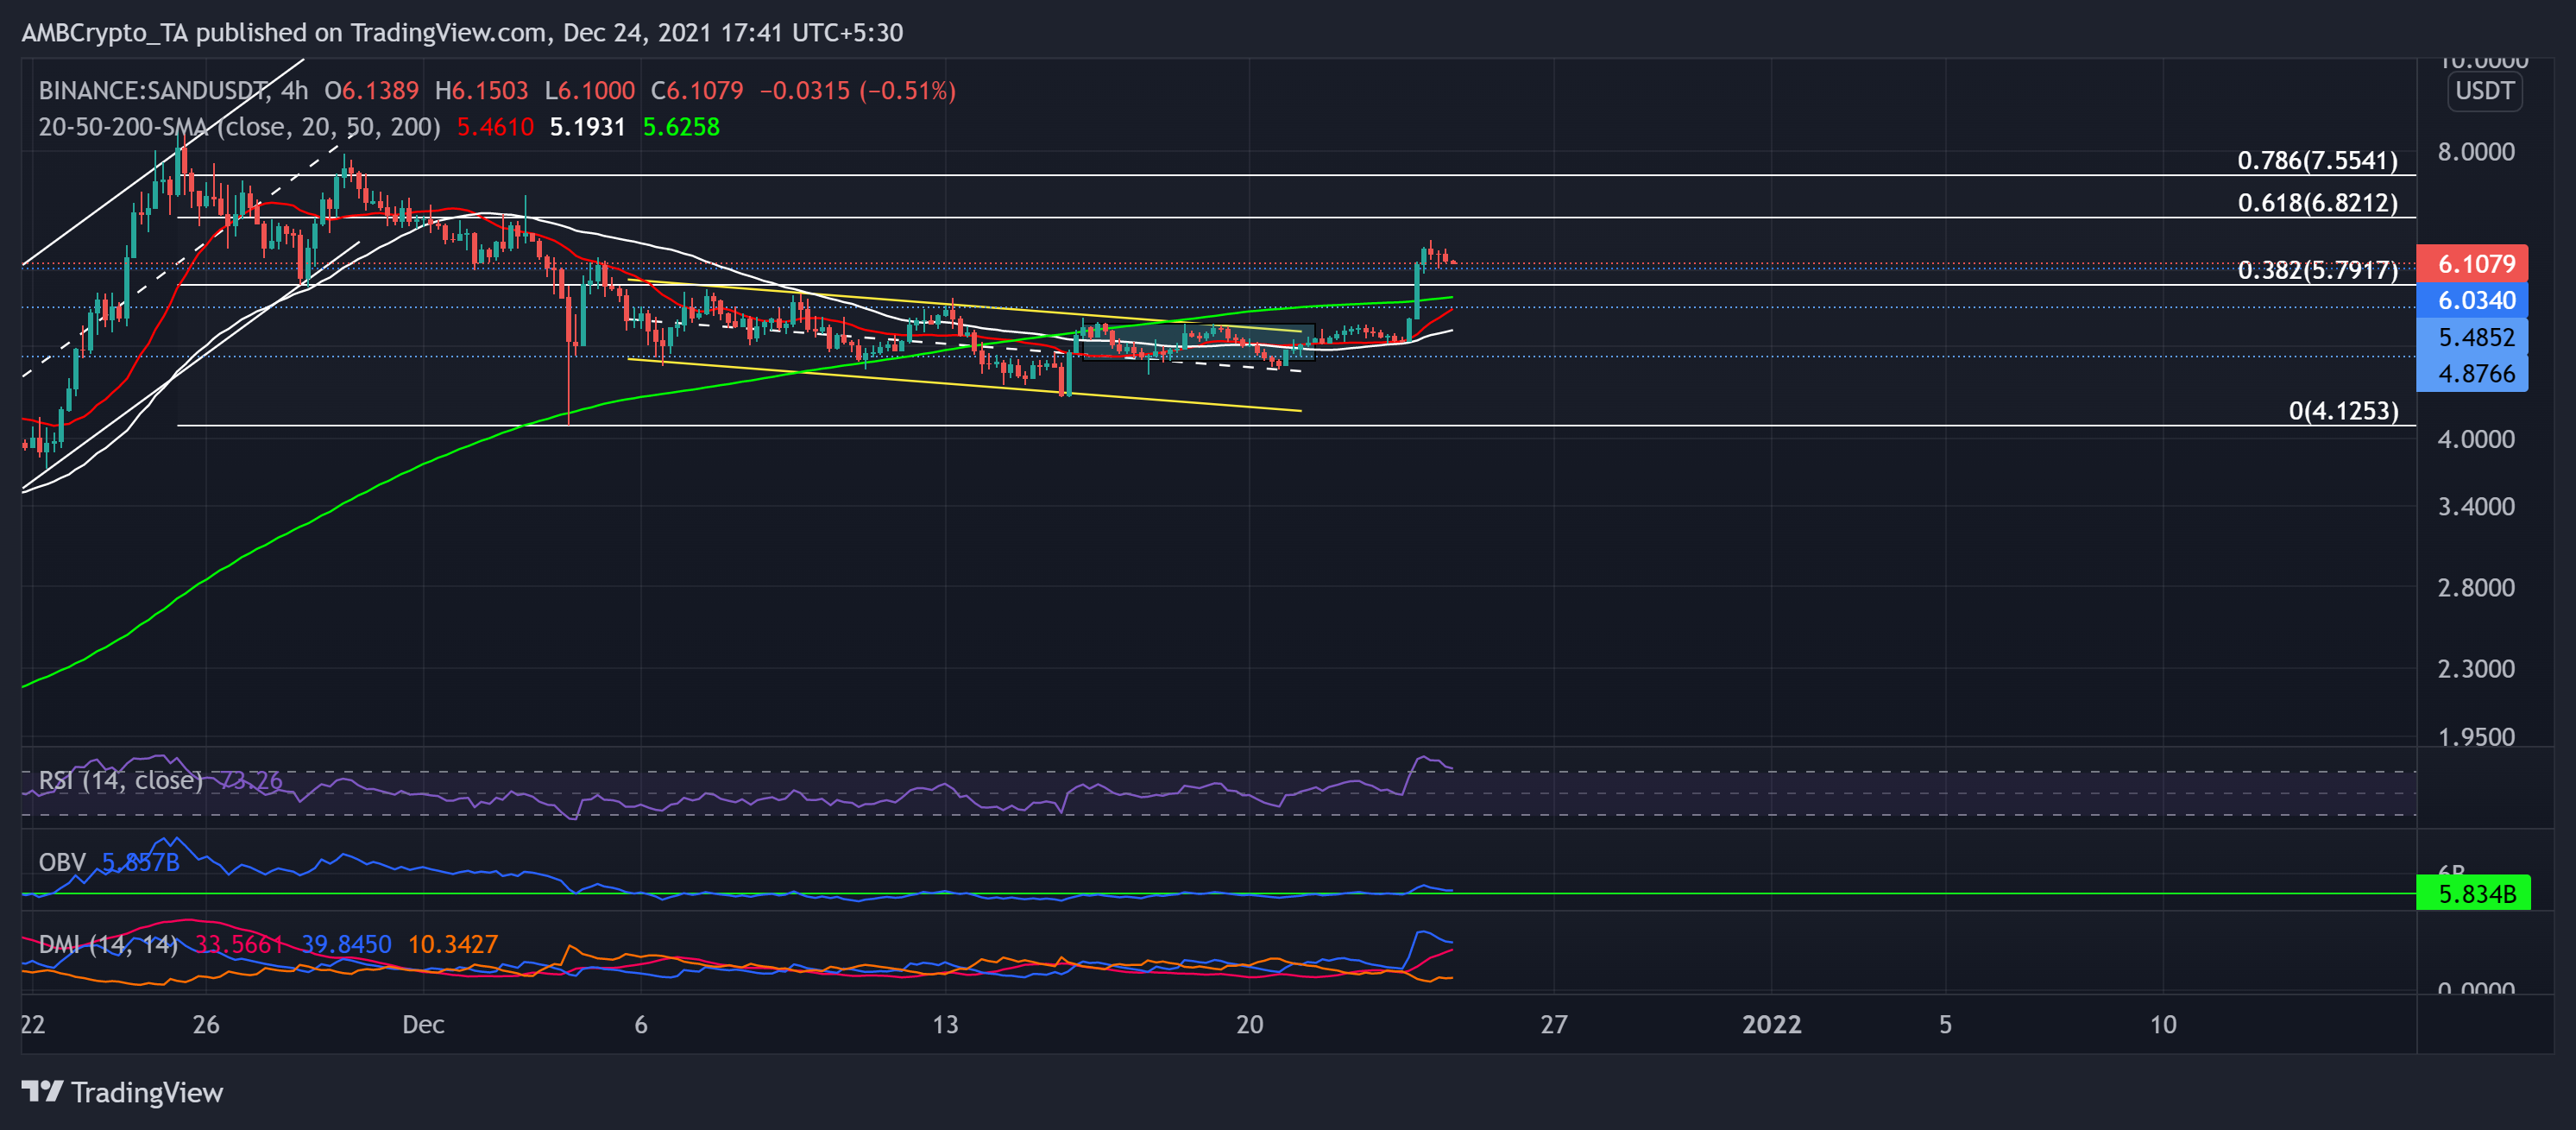
Since 5 December, SAND fell in a down-channel on its 4-hour chart. SAND bulls crossed the 38.2% Fibonacci resistance as it re-claimed the vital $6.03 support with the recent bull run.
Over the past few days, it found support at the midline (white, dashed) as the bulls retested the upper channel twice before initiating a breakout.
Like SHIB, SAND registered a 34.39% gain from the 20 December low. ANy breakdown from here would see testing support near the 20-SMA (red) at the $5.4-level
At press time, the alt traded at $6.1079 after noting a 22.75% 24-hour gain. The RSI was at the 73-mark and displayed a sweeping bullish bias. Also, the DMI confirmed the previous analysis. But the OBV continued to move near its immediate support and did not mark a major spike.
Bitcoin Cash (BCH)

After forming a descending broadening wedge (reversal pattern) on its 4-hour chart, the altcoin saw an expected breakout above the 23.6% Fibonacci level. The bears retested the $419-mark nearly six times while the bulls consistently upheld this testing point.
The alt saw a 9.07% from 20 December but saw a pullback from its near-term resistance at the $461-mark. Now, BCH found support near the 20 (red) and 50 (green) SMA.
At press time, the alt traded at $456.8. The RSI stood at the 65-mark after flashing an uptrend. Further, the DMI also exhibited a bullish preference. But the ADX showed a slightly weak directional trend.


