Shiba Inu
Shiba Inu whale watch: How large investors will play in huge part in SHIB’s future
Shiba Inu whales have been moving tokens out of exchanges, suggesting that buying pressure was high.


- Shiba Inu’s price increased by more than 1.5% in the last 24 hours.
- Most metrics and market indicators were bullish on the memecoin.
Shiba Inu [SHIB], the world’s second-largest memecoin, witnessed a major setback last week as its price dropped to $0.000013. However, it later gained upward momentum but couldn’t sustain that trend for long.
Meanwhile, whales made a few interesting moves, which could indicate SHIB’s future course.
Shiba Inu’s rollercoaster ride
CoinMarketCap’s data revealed that after reaching last week’s lowest, SHIB turned bullish and reached the weakest highest of $0.0000174. In the last 24 hours, SHIB’s price increased by more than 1.5%.
At the time of writing, SHIB was trading at $0.00001677 with a market capitalization of over 49.88 billion, making it the 13th largest crypto.
Santiment recently posted a tweet revealing how whales behaved while the memecoin’s price remained volatile. As per the tweet, Shiba Inu whales were moving tokens out of exchange.
This clearly meant that they were accumulating SHIB as they were confident in the memecoin.
AMBCrypto then checked Santiment’s data to find out whether buying pressure was overall high in the market. As per our analysis, SHIB’s Supply on Exchanges dropped sharply.
While that happened, its supply outside of exchanges increased, hinting at a rise in buying pressure.
Its Exchange Outflow also spiked, further establishing the fact that investors were buying.
The supply held by the top non-exchange addresses also increased last week, indicating non-exchange whales’ intention to accumulate Shiba Inu.
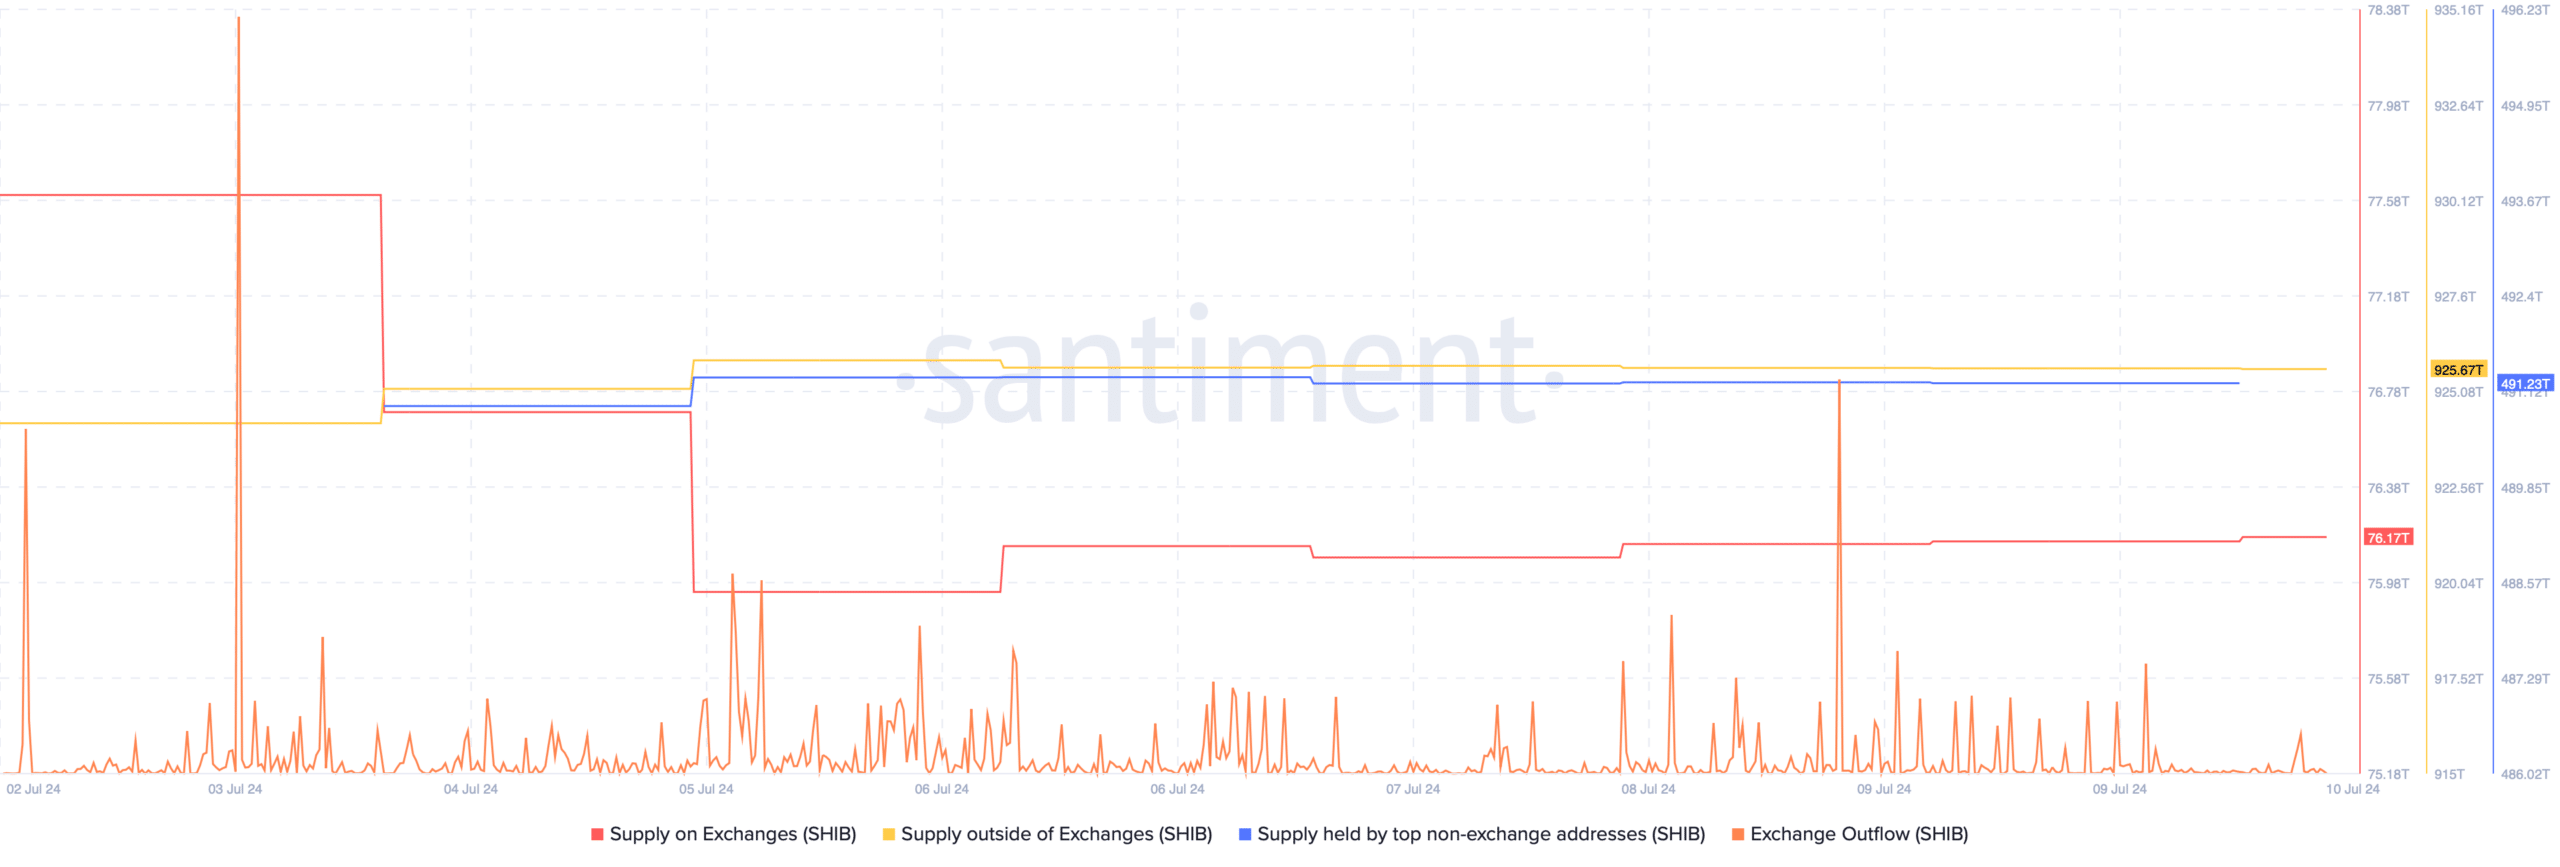
Source: Santiment
Will buying pressure be enough to begin a rally?
Apart from the rise in buying pressure, the memecoin’s derivatives metrics also looked pretty bullish. AMBCrypto’s look at Coinglass’ data revealed SHIB’s Long/Short Ratio increased.
This means that there were more long positions in the market than short positions, suggesting that bullish sentiment around SHIB was high.
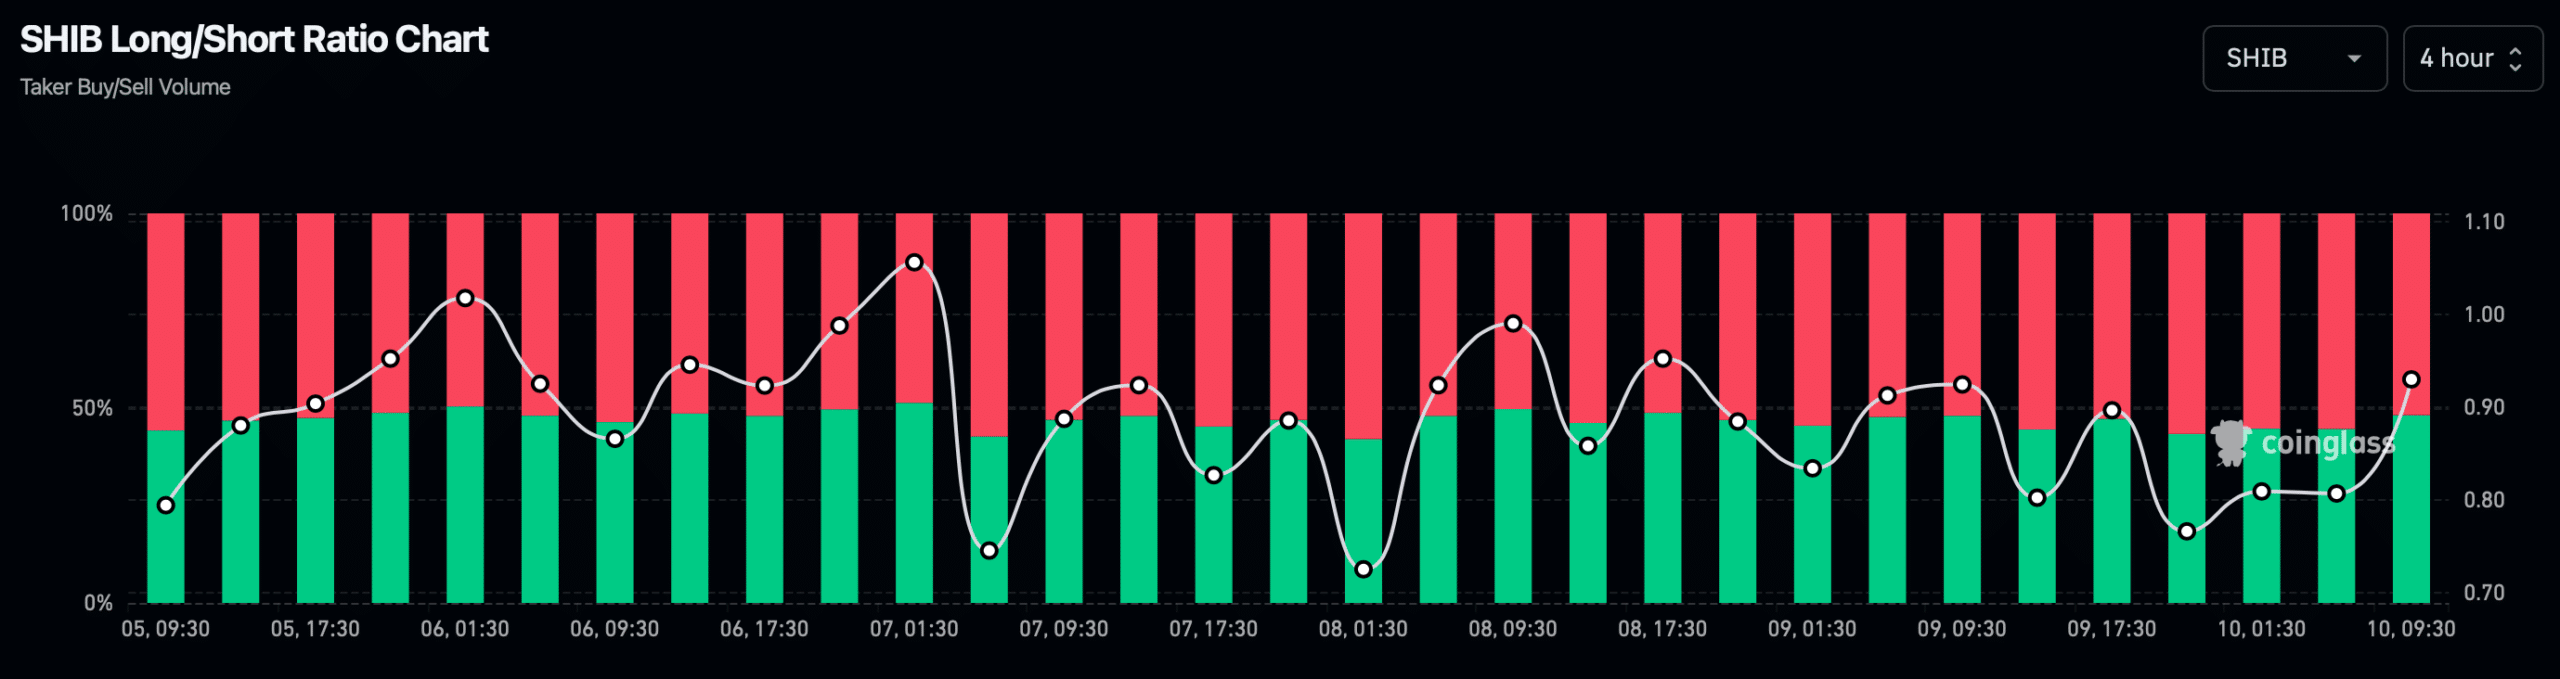
Source: Coinglass
As per our analysis of Shiba Inu’s daily chart, most indicators were also bullish. For instance, the technical indicator MACD displayed a bullish crossover. Chaikin Money Flow (CMF) registered an uptick.
A similar increasing trend was also noted on the Relative Strength Index’s (RSI) chart. These indicators suggested that the chances of SHIB gaining bullish momentum were high.
However, the Bollinger Bands pointed out that SHIB’s price was entering a less volatile zone, which indicated that investors might witness a few slow-moving days.
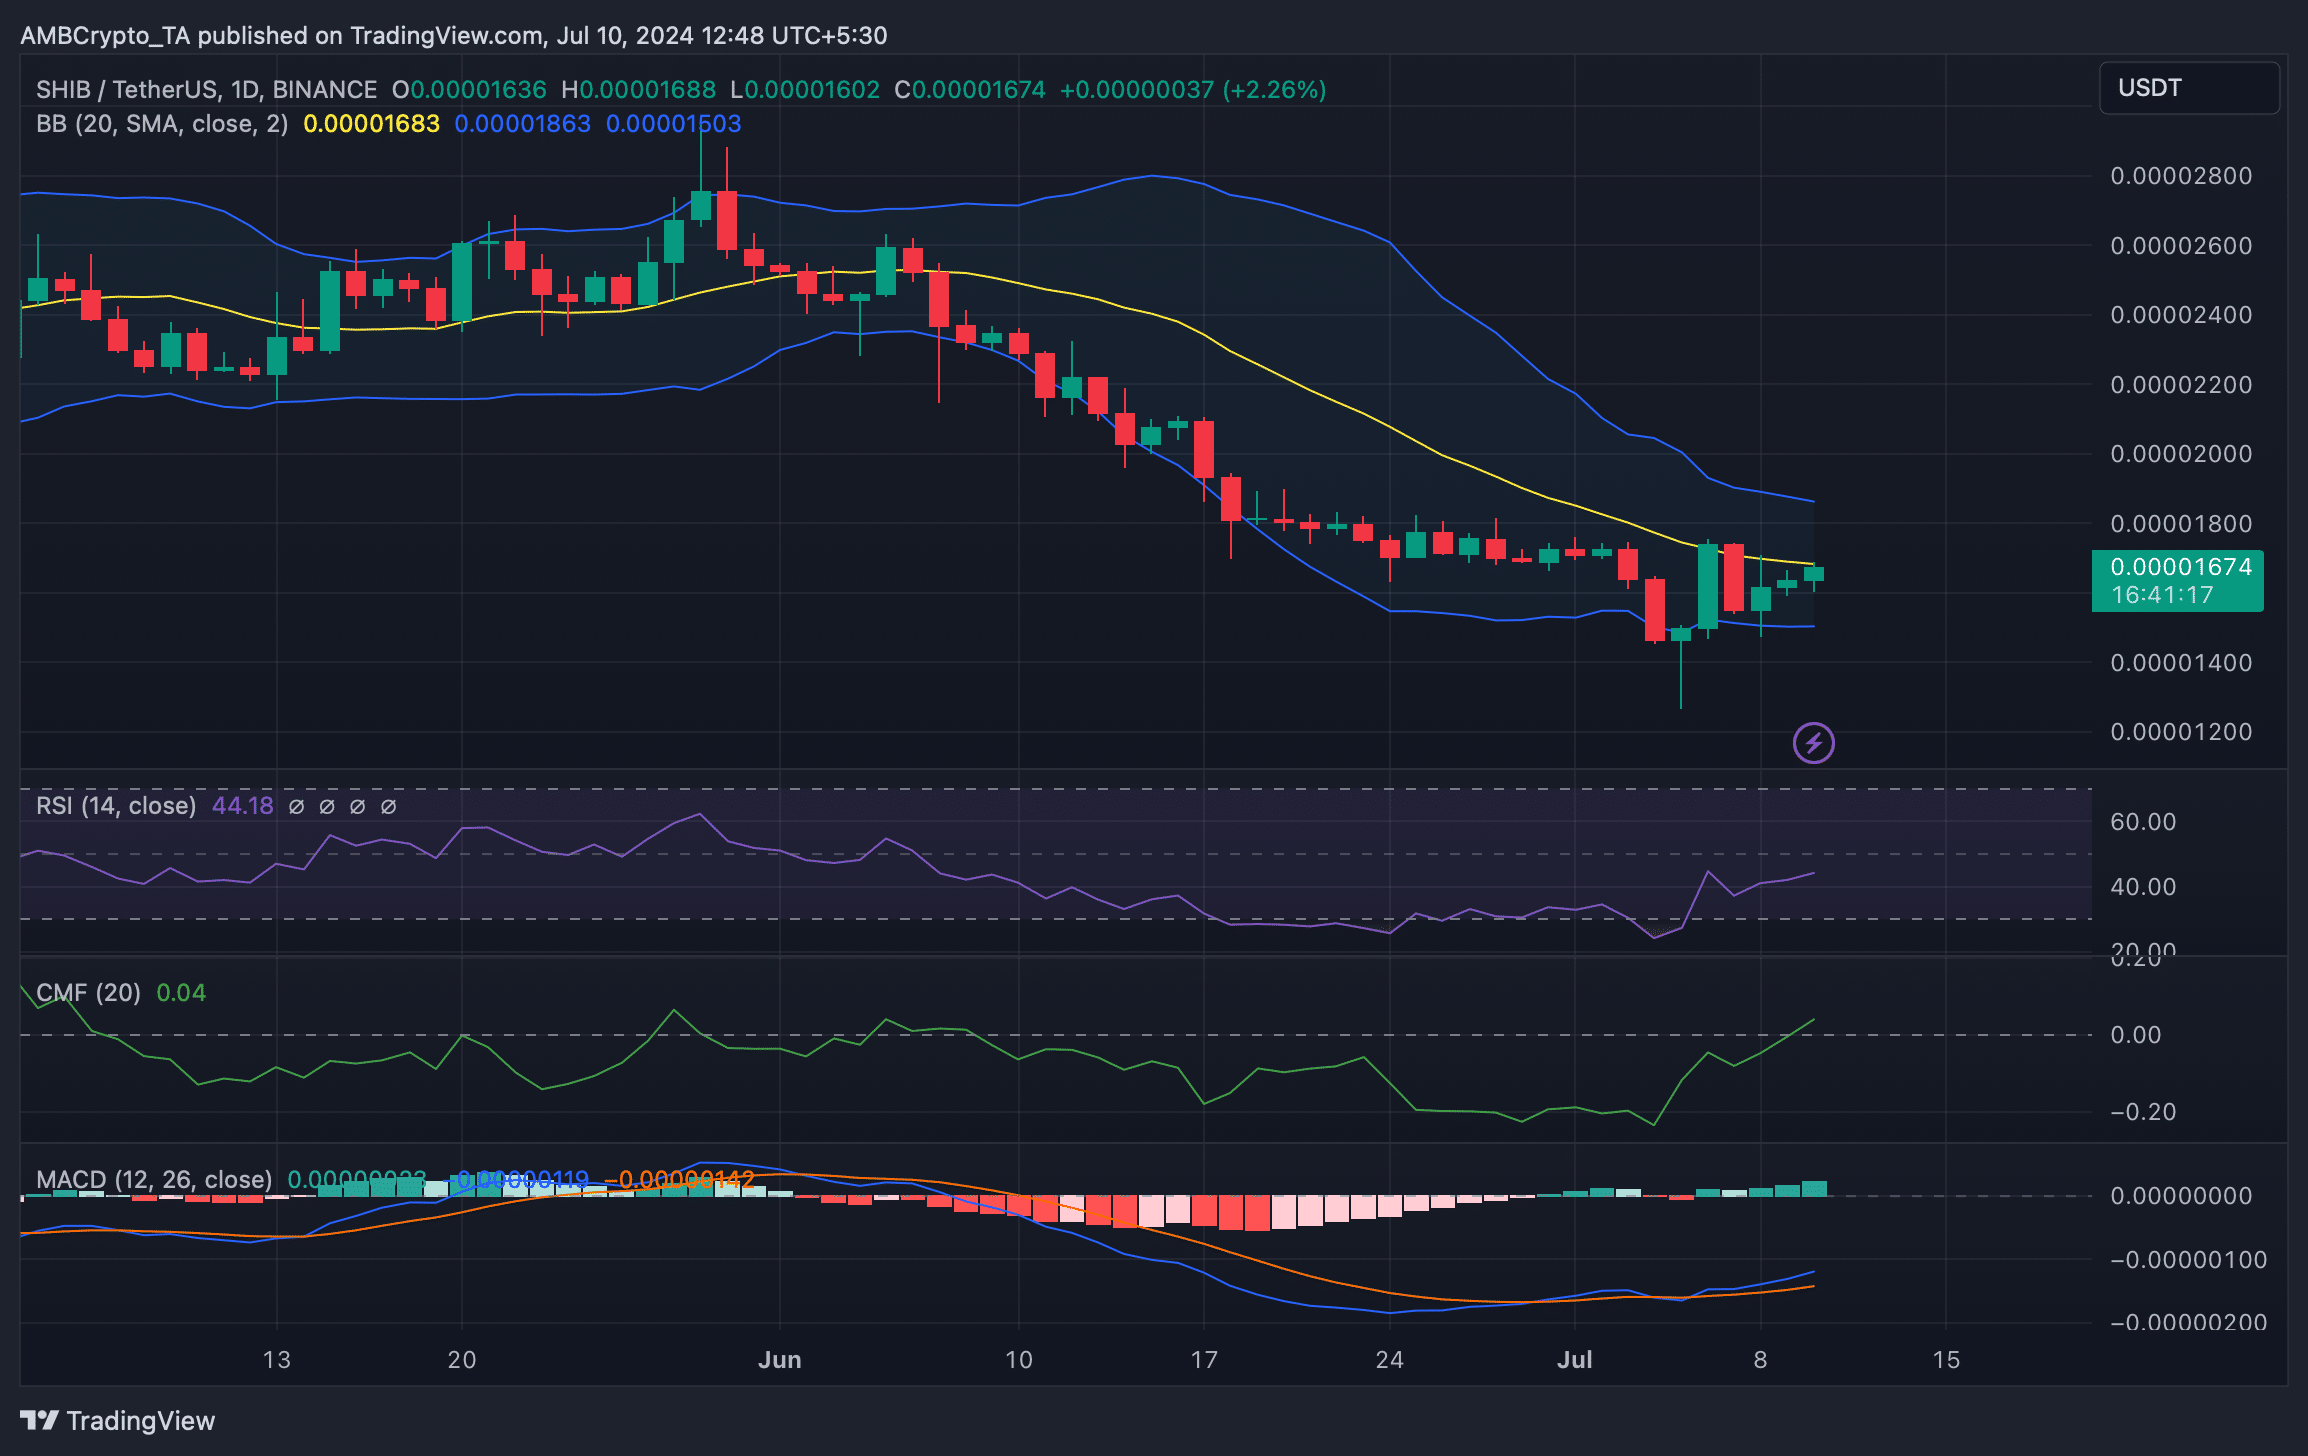
Source: TradingView
Is your portfolio green? Check out the SHIB Profit Calculator
AMBCrypto’s look at Hyblock Capital’s data revealed that if Shiba Inu turns bullish, then it might reach $0.0000177 in the coming days. However, if the bears take over, then they might push SHIB to $0.000012.
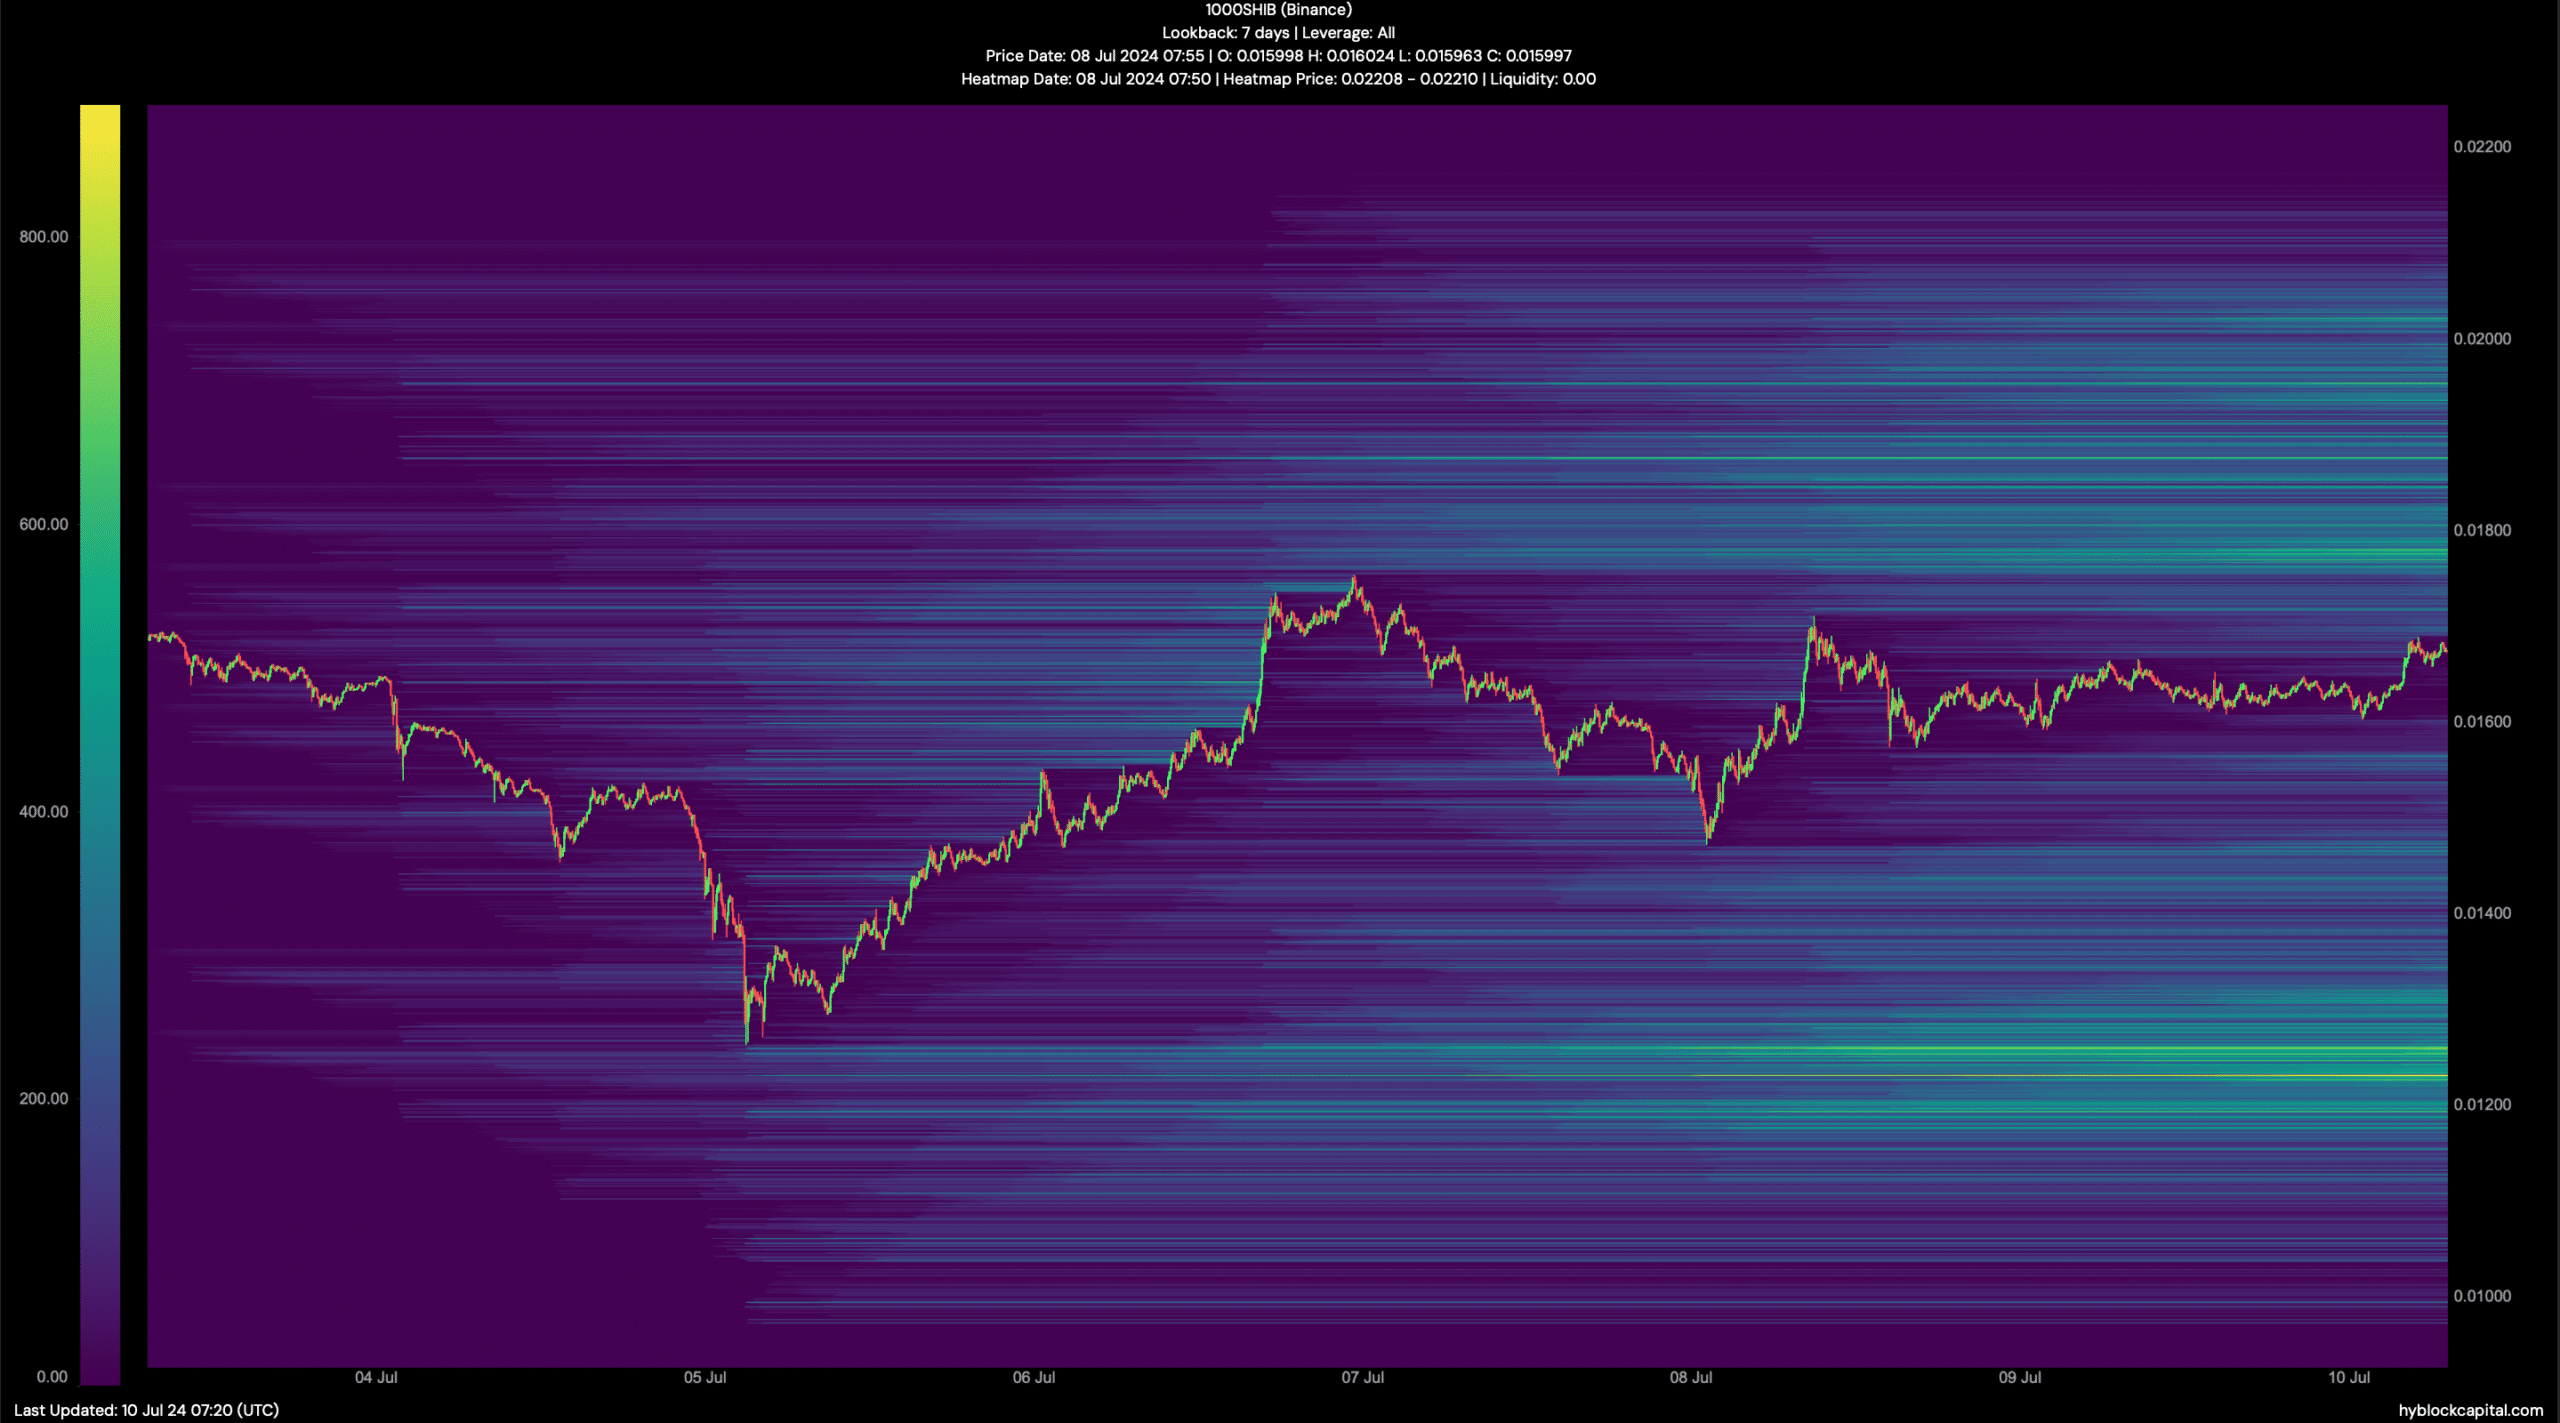
Source: Hyblock Capital