Despite its recent falling wedge breakout, Shiba Inu (SHIB) buyers failed to flip the bearish narrative owing to the coin’s very high correlation with Bitcoin.
Since rebounding from the 61.8% Fibonacci level, the month-long trendline resistance (yellow, dashed) has curbed the potential of buying rallies.
While the current setup exhibited a bearish edge, a close above or below the trendline resistance could influence the coming moves of the dog-themed token.
At press time, SHIB traded at $0.01075, up by 1.95% over the last day. (For brevity, SHIB prices are multiplied by 1000 from here on).
SHIB Daily Chart
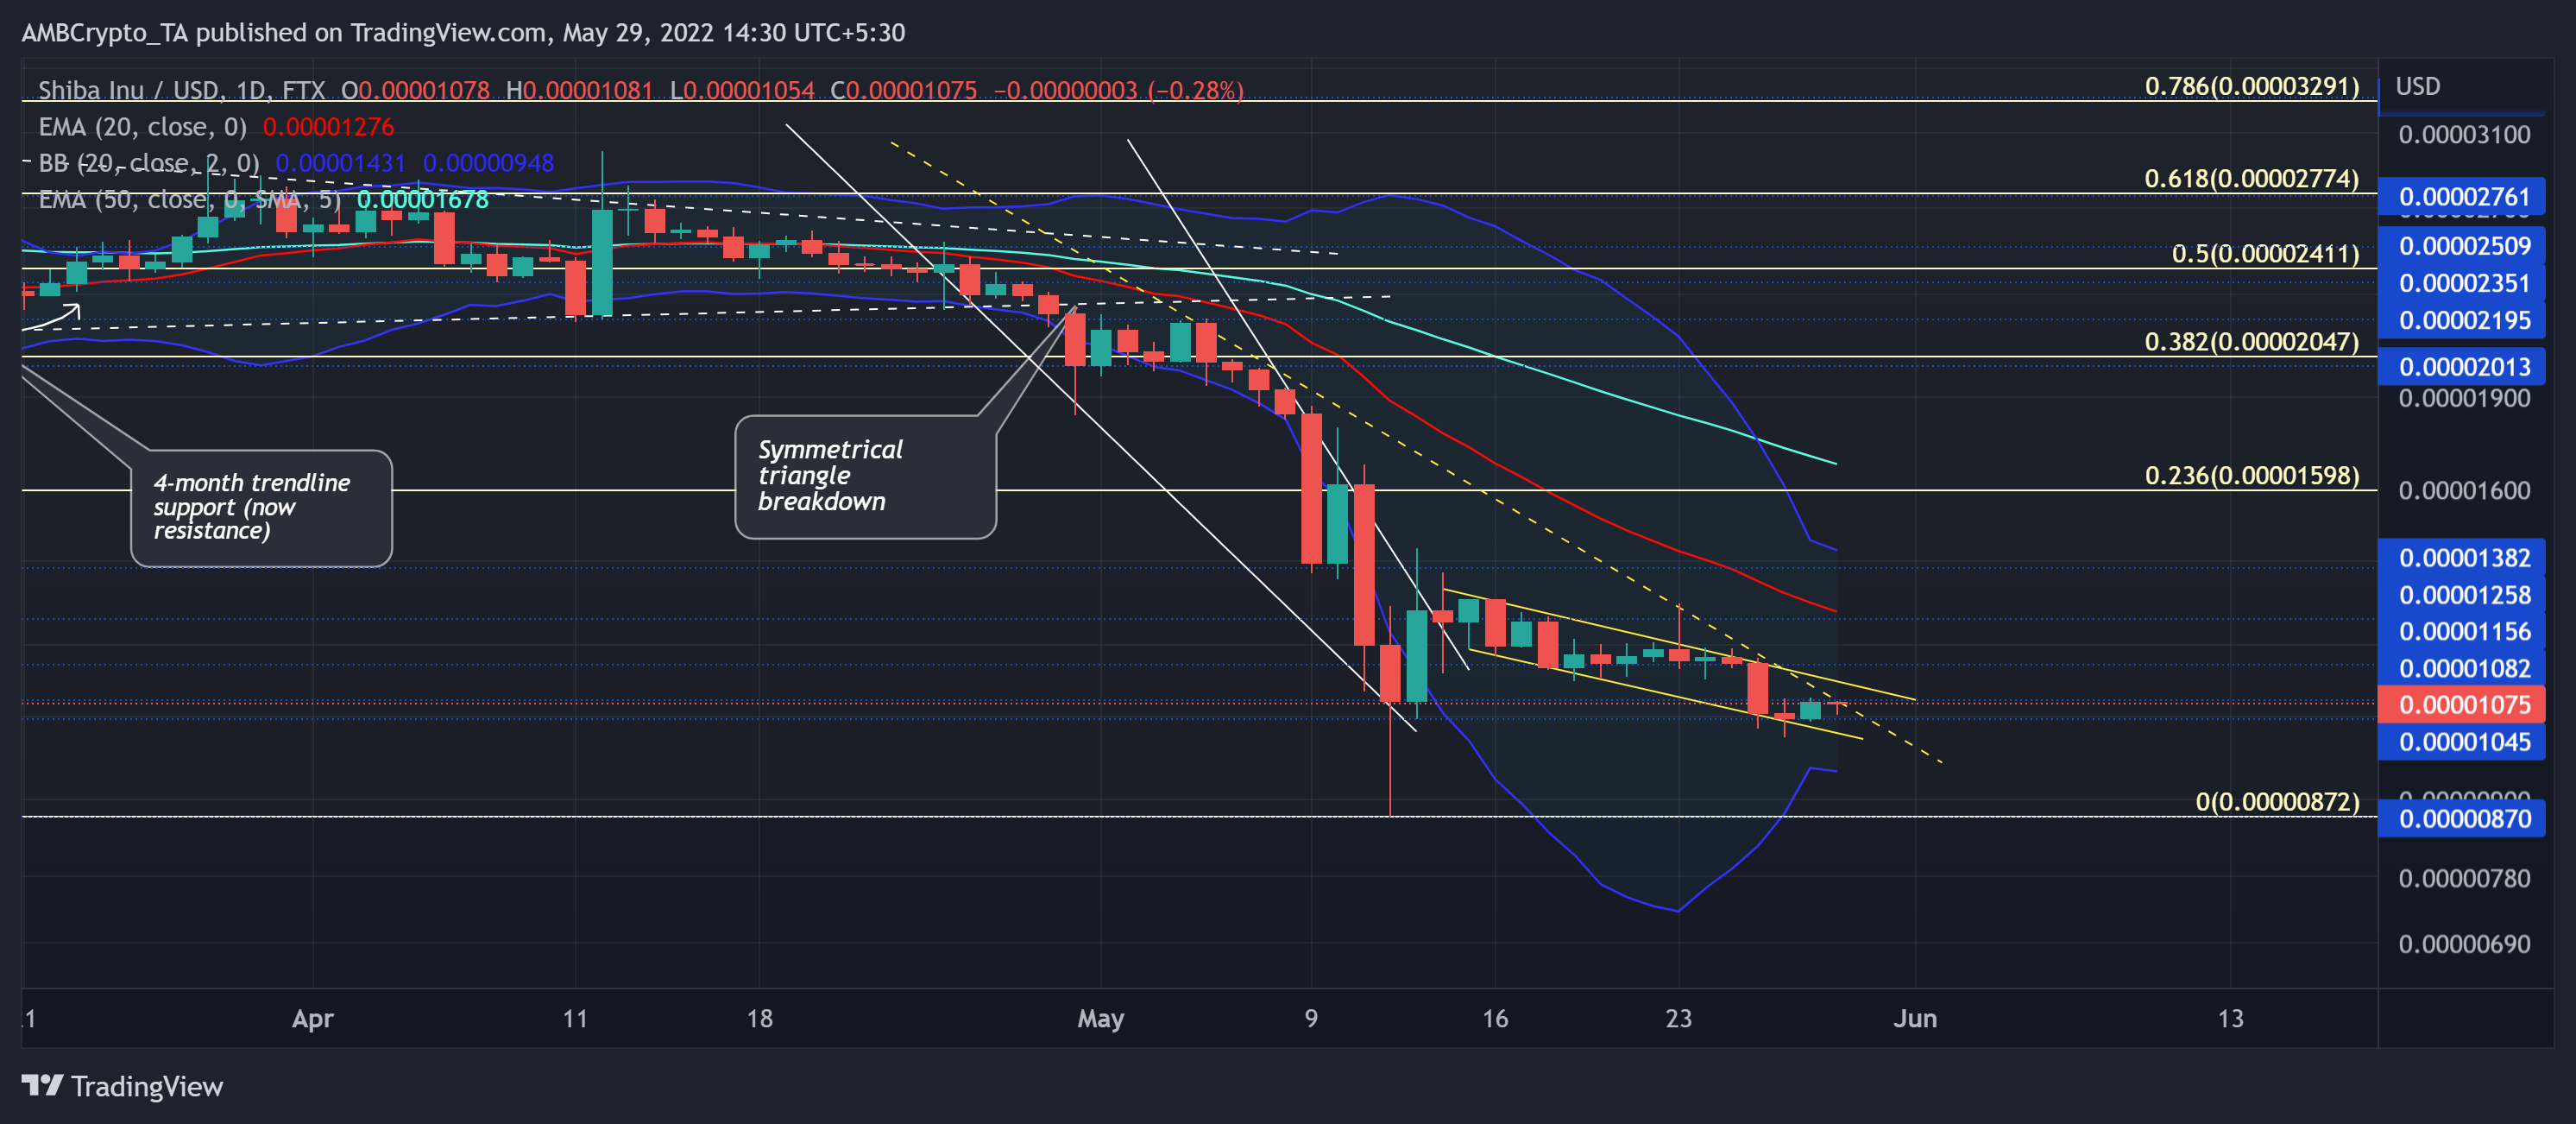
Source: TradingView, SHIB/USD
SHIB found a traversing range between the $0.02-$0.032 for over four months as the bears kept revving up their pressure near the 38.2% Fibonacci level. But the symmetrical triangle setup on the daily chart played out in favor of the sellers due to the alt’s previous downtrend.
After losing the $0.02 baseline, SHIB lost over 60% of its value (from 5 May) and took a plunge toward its seven-month low on 12 May.
As a result, the distance between the south looking 20 EMA (red) and the 50 EMA (cyan) shot up to its record high. Previously SHIB saw such a gap during the bull run towards its ATH in October of last year.
Also, SHIB has marked a significant drop in its volumes while impeding its high volatility phase. Now, the upper and lower Bollinger Bands (BB) could further encourage a relatively tight phase in the coming times.
A bullish inability to jump above the month-long trendline resistance could extend the current sluggish behavior on the chart. To pave a path toward the $0.013-level, SHIB needed to escape the bonds of its immediate resistance.
Rationale
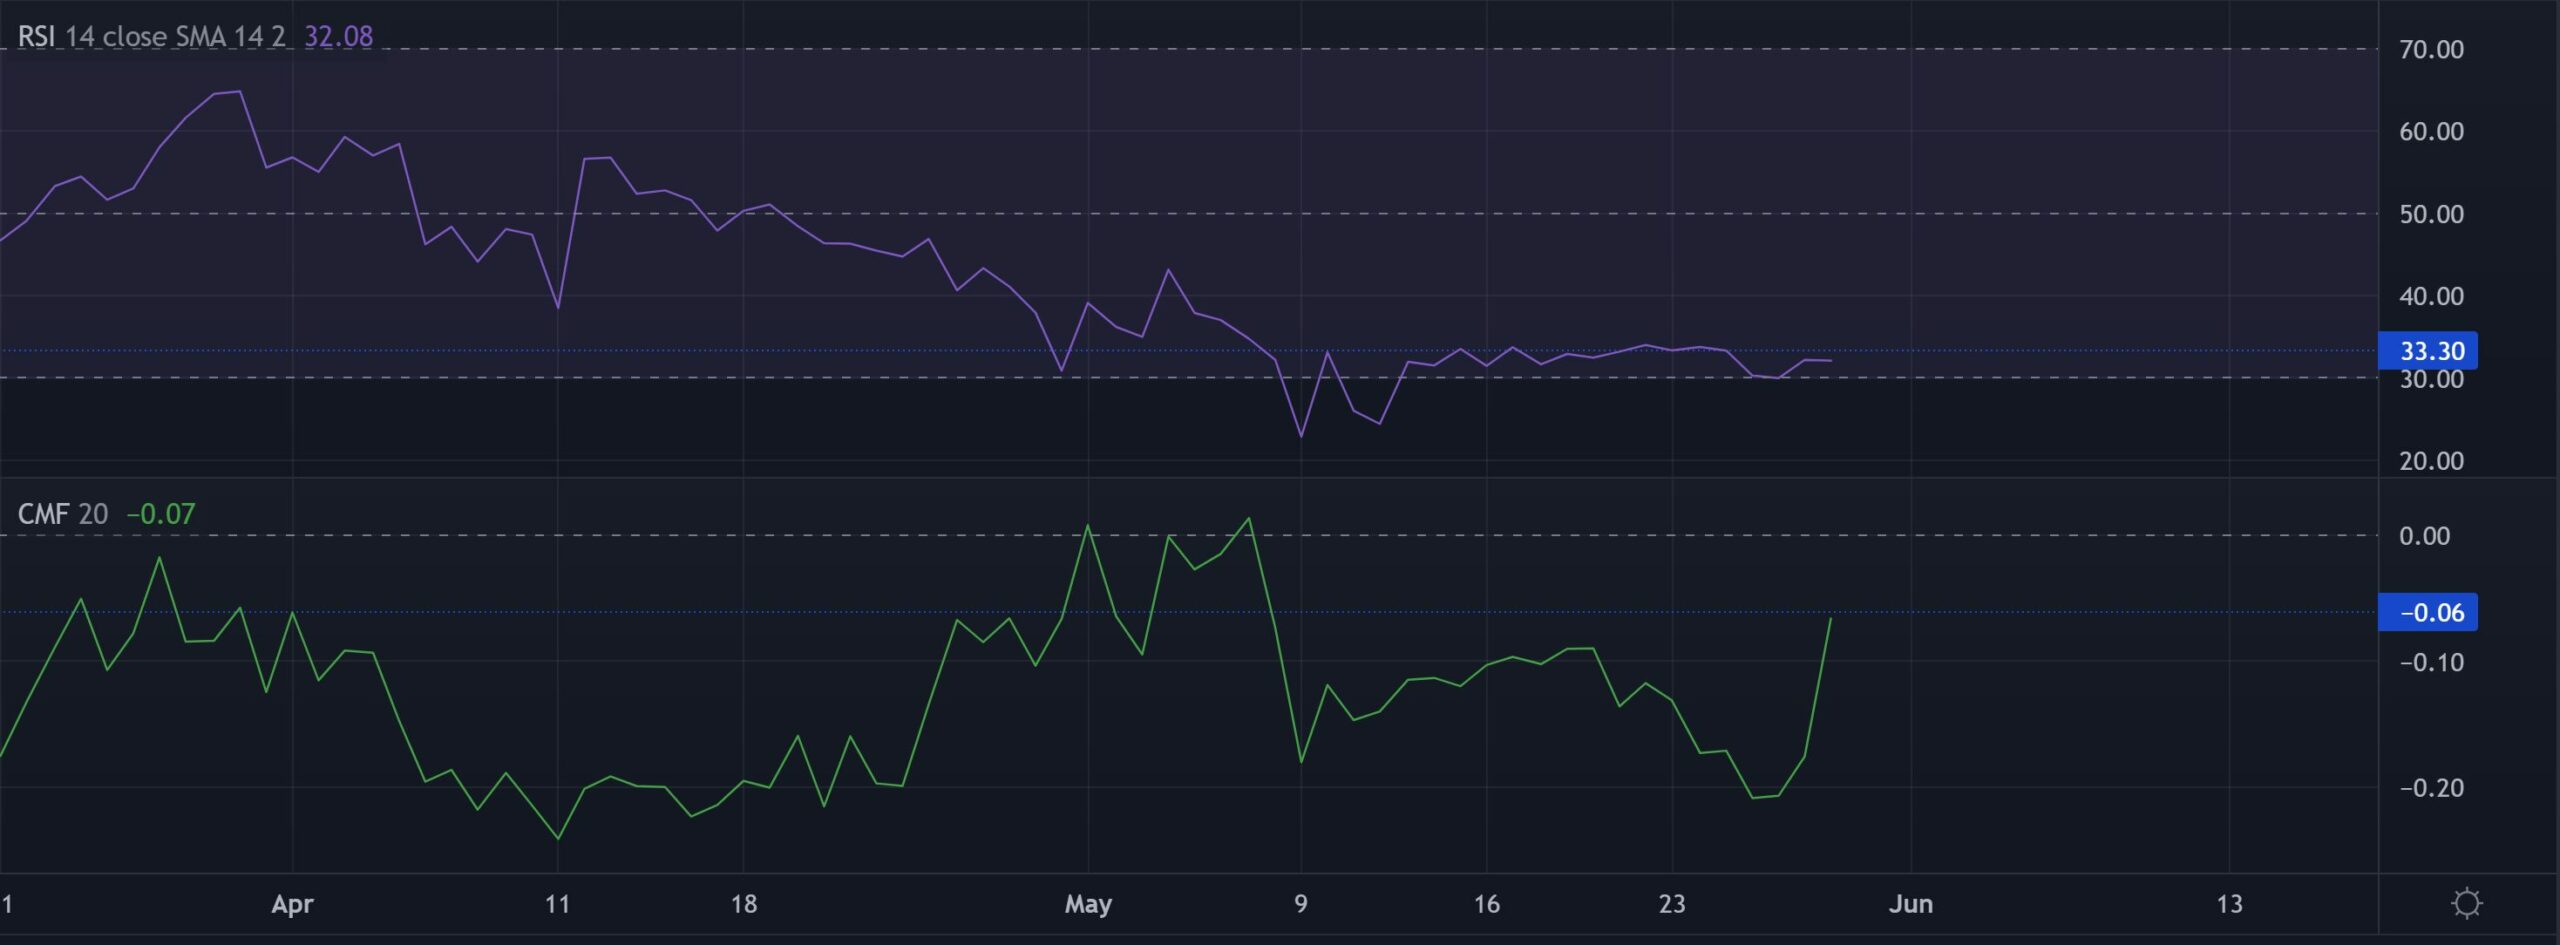
Source: TradingView, SHIB/USD
After failing to sustain itself above the 33-resistance, the RSI has been hovering near the oversold region for the last three weeks. Unless the bulls topple the 33-resistance, SHIB would have slim chances of a strong revival.
Should the CMF rebound from the -0.06 zone, its recent uptick would confirm a bearish divergence with the price.
Conclusion
With the selling volumes exceeding the buy orders alongside the south looking near-term EMAs, SHIB could continue its sluggish phase near the $0.01045-level.
Any close below this level would position the alt for a further downside toward the lower band of BB.
Besides, the alt shares a staggering 98% 30-day correlation with Bitcoin. Hence, keeping an eye on Bitcoin’s movement with the overall market sentiment could be essential for making a profitable move.