Shiba Inu
Shiba Inu’s next move: Key SHIB signs point to a breakout above…
A bullish pattern has emerged on Shiba Inu’s price chart, and a breakout could help SHIB reclaim its June highs soon.


- Shiba Inu’s price started to consolidate in a bullish pattern since the 15th of July.
- SHIB’s NVT ratio increased, but the remaining market indicators suggested a successful breakout.
Shiba Inu [SHIB] bears were dominating the market in the past seven days as the memecoin’s weekly chart was red. However, the trend changed in the past 24 hours.
In fact, the better news was that a bullish pattern appeared on the memecoin’s chart. A successful breakout could result in a massive bull rally.
A bull pattern on Shiba Inu chart
According to CoinMarketCap’s
data, SHIB’s price dropped by more than 2% last week. Things took a U-turn over the last day as the bulls stepped in and pushed the memecoin’s price up by 2.4%.At the time of writing, Shiba Inu was trading at $0.00001721, with a market capitalization of over $10.14 billion, making it the 13th largest crypto. In the meantime, a bullish falling wedge pattern appeared on SHIB’s 12-hour chart.
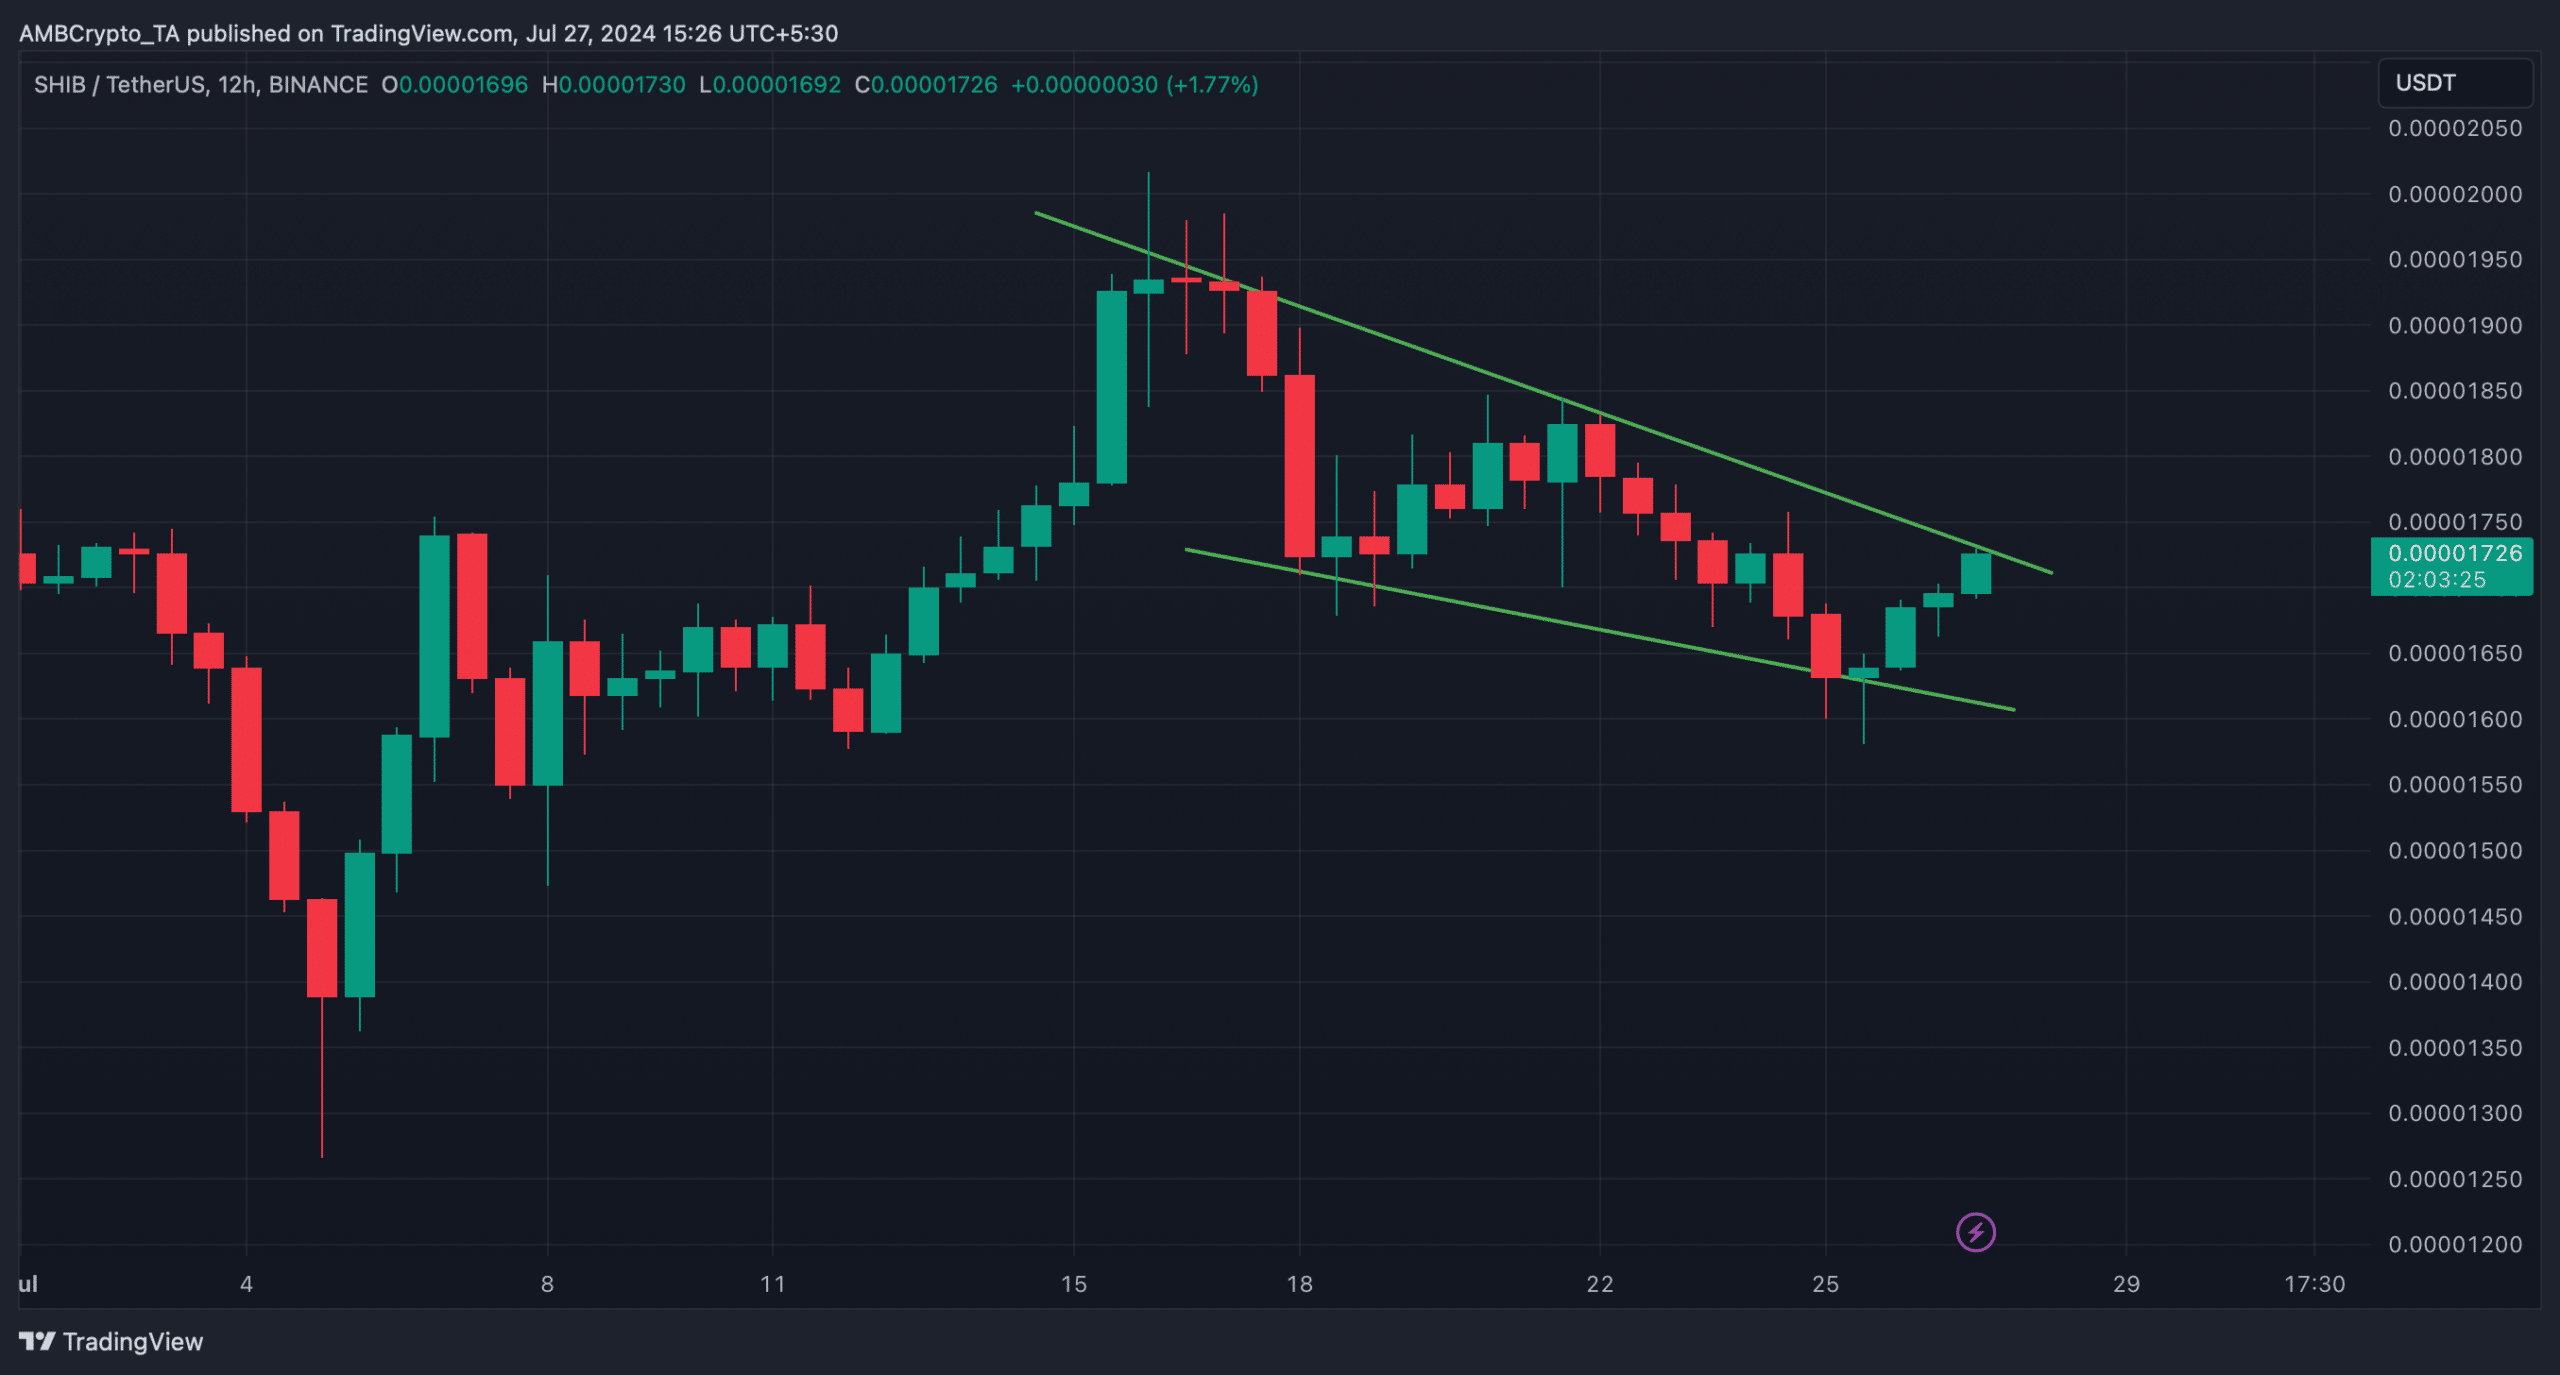
The pattern emerged on the 15th of July, and since then SHIB has been consolidating inside it. At the time of writing, it was on the verge of a breakout.
Therefore, AMBCrypto planned to have a closer look at SHIB’s state to see the odds of a successful breakout, which could result in a bull rally.
Are SHIB’s metrics bullish?
AMBCrypto’s analysis of Glassnode’s data revealed a bearish metric. The memecoin’s NVT ratio increased over the last few days. Usually, a rise in the metric means that an asset is overvalued, which hints at a price correction.
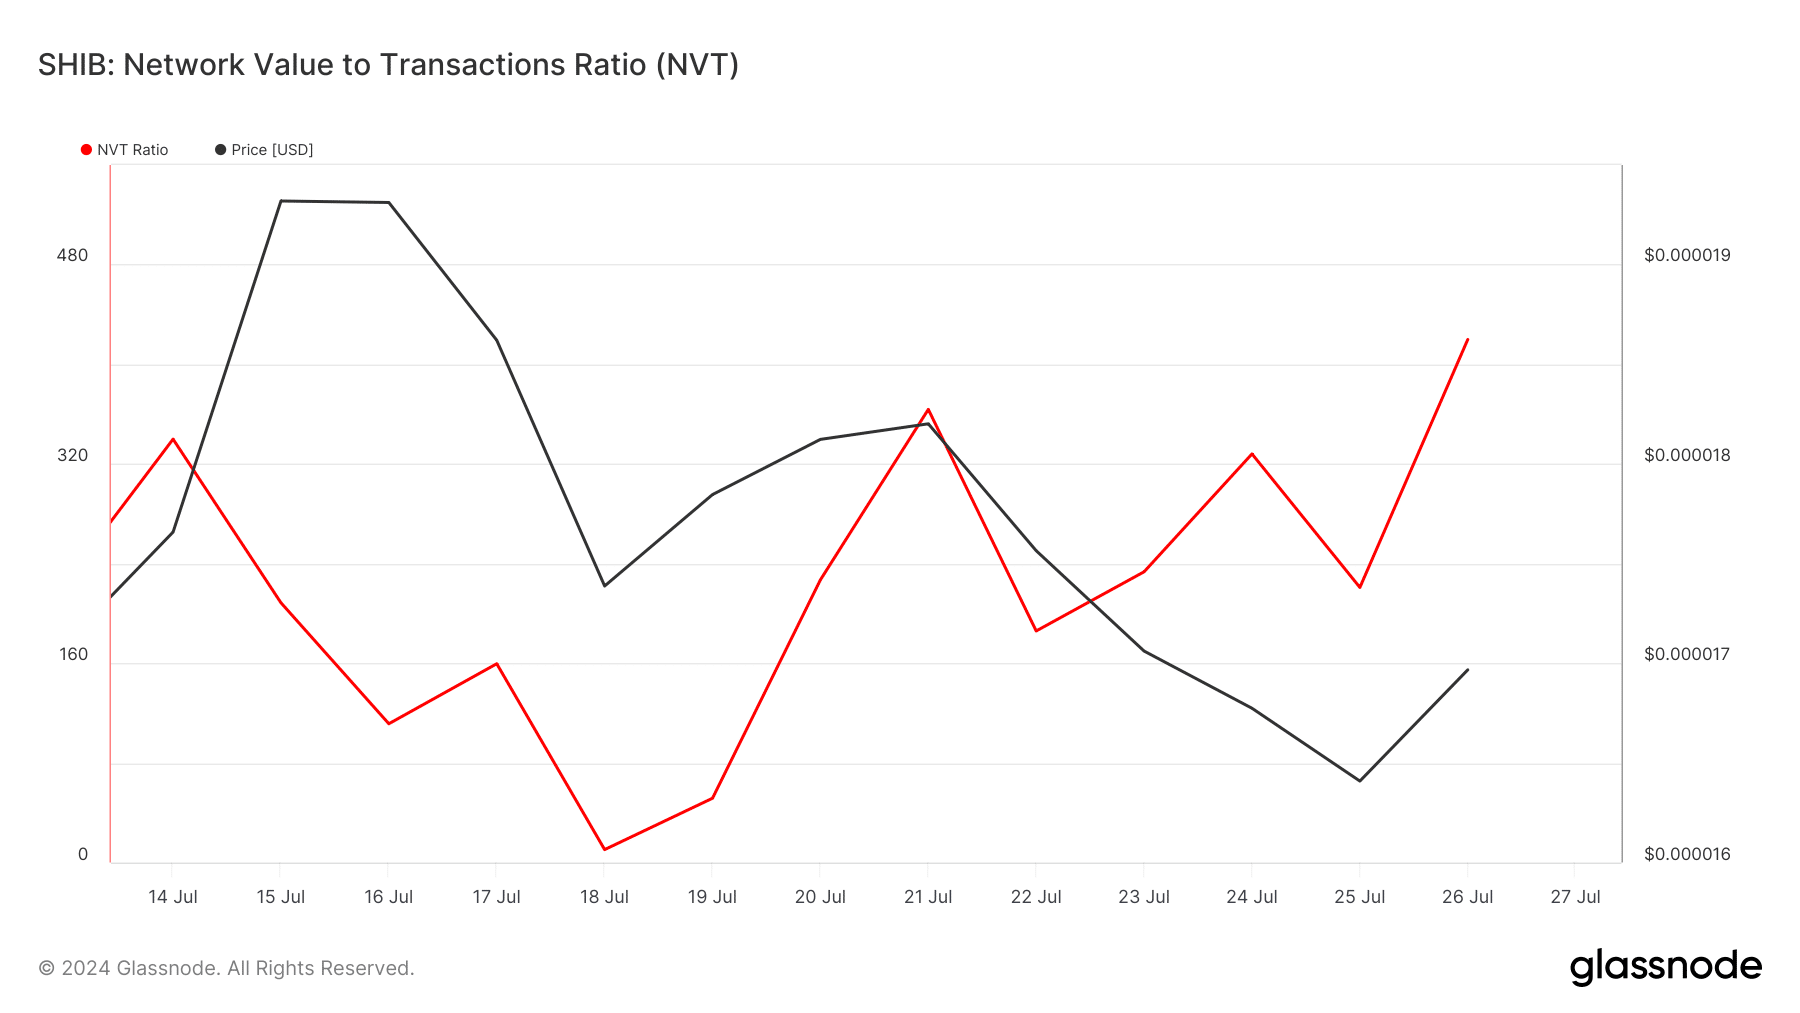
Source: Glassnode
As per Santiment’s data, the whales also didn’t make any major moves last week, which was evident from the flat supply held by the top addresses graph.
Nonetheless, buying pressure did increase slightly last week. The memecoin’s exchange outflow increased and its supply on exchanges registered a drop, suggesting that investors were buying Shiba Inu.
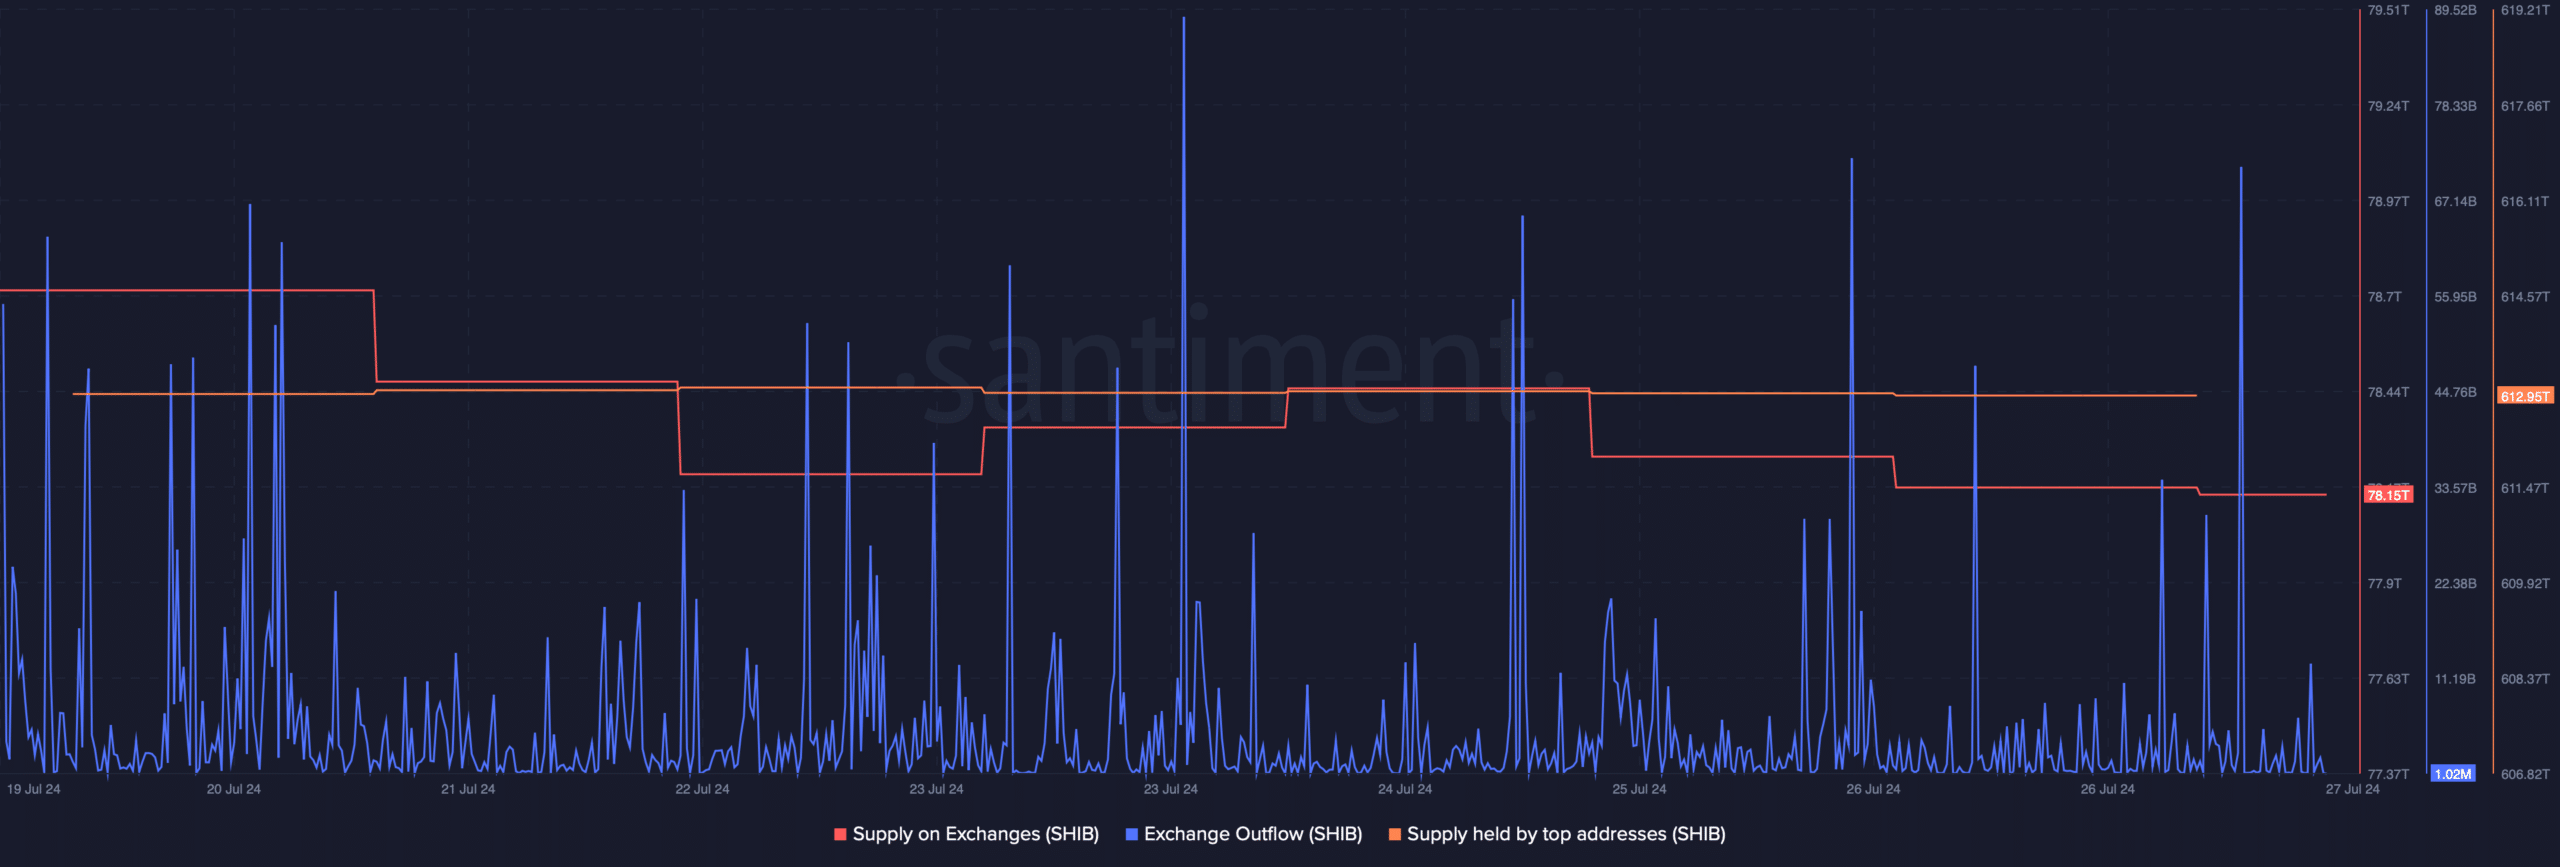
Source: Santiment
We then checked the memecoin’s daily chart to find out what market indicators had to suggest regarding a breakout from the bullish falling wedge pattern.
We found that its Relative Strength Index (RSI) registered an uptick. The Chaikin Money Flow (CMF) also moved northwards, both of which minted at a continued price rise.
Read Shiba Inu’s [SHIB] Price Prediction 2024-25
If that happens, ten investors might see SHIB touch $0.00001933 next week. A jump above that mark could push SHIB to $0.0000259.
However, in case of a bearish trend reversal, SHIB might drop to $0.000019 in the coming days.
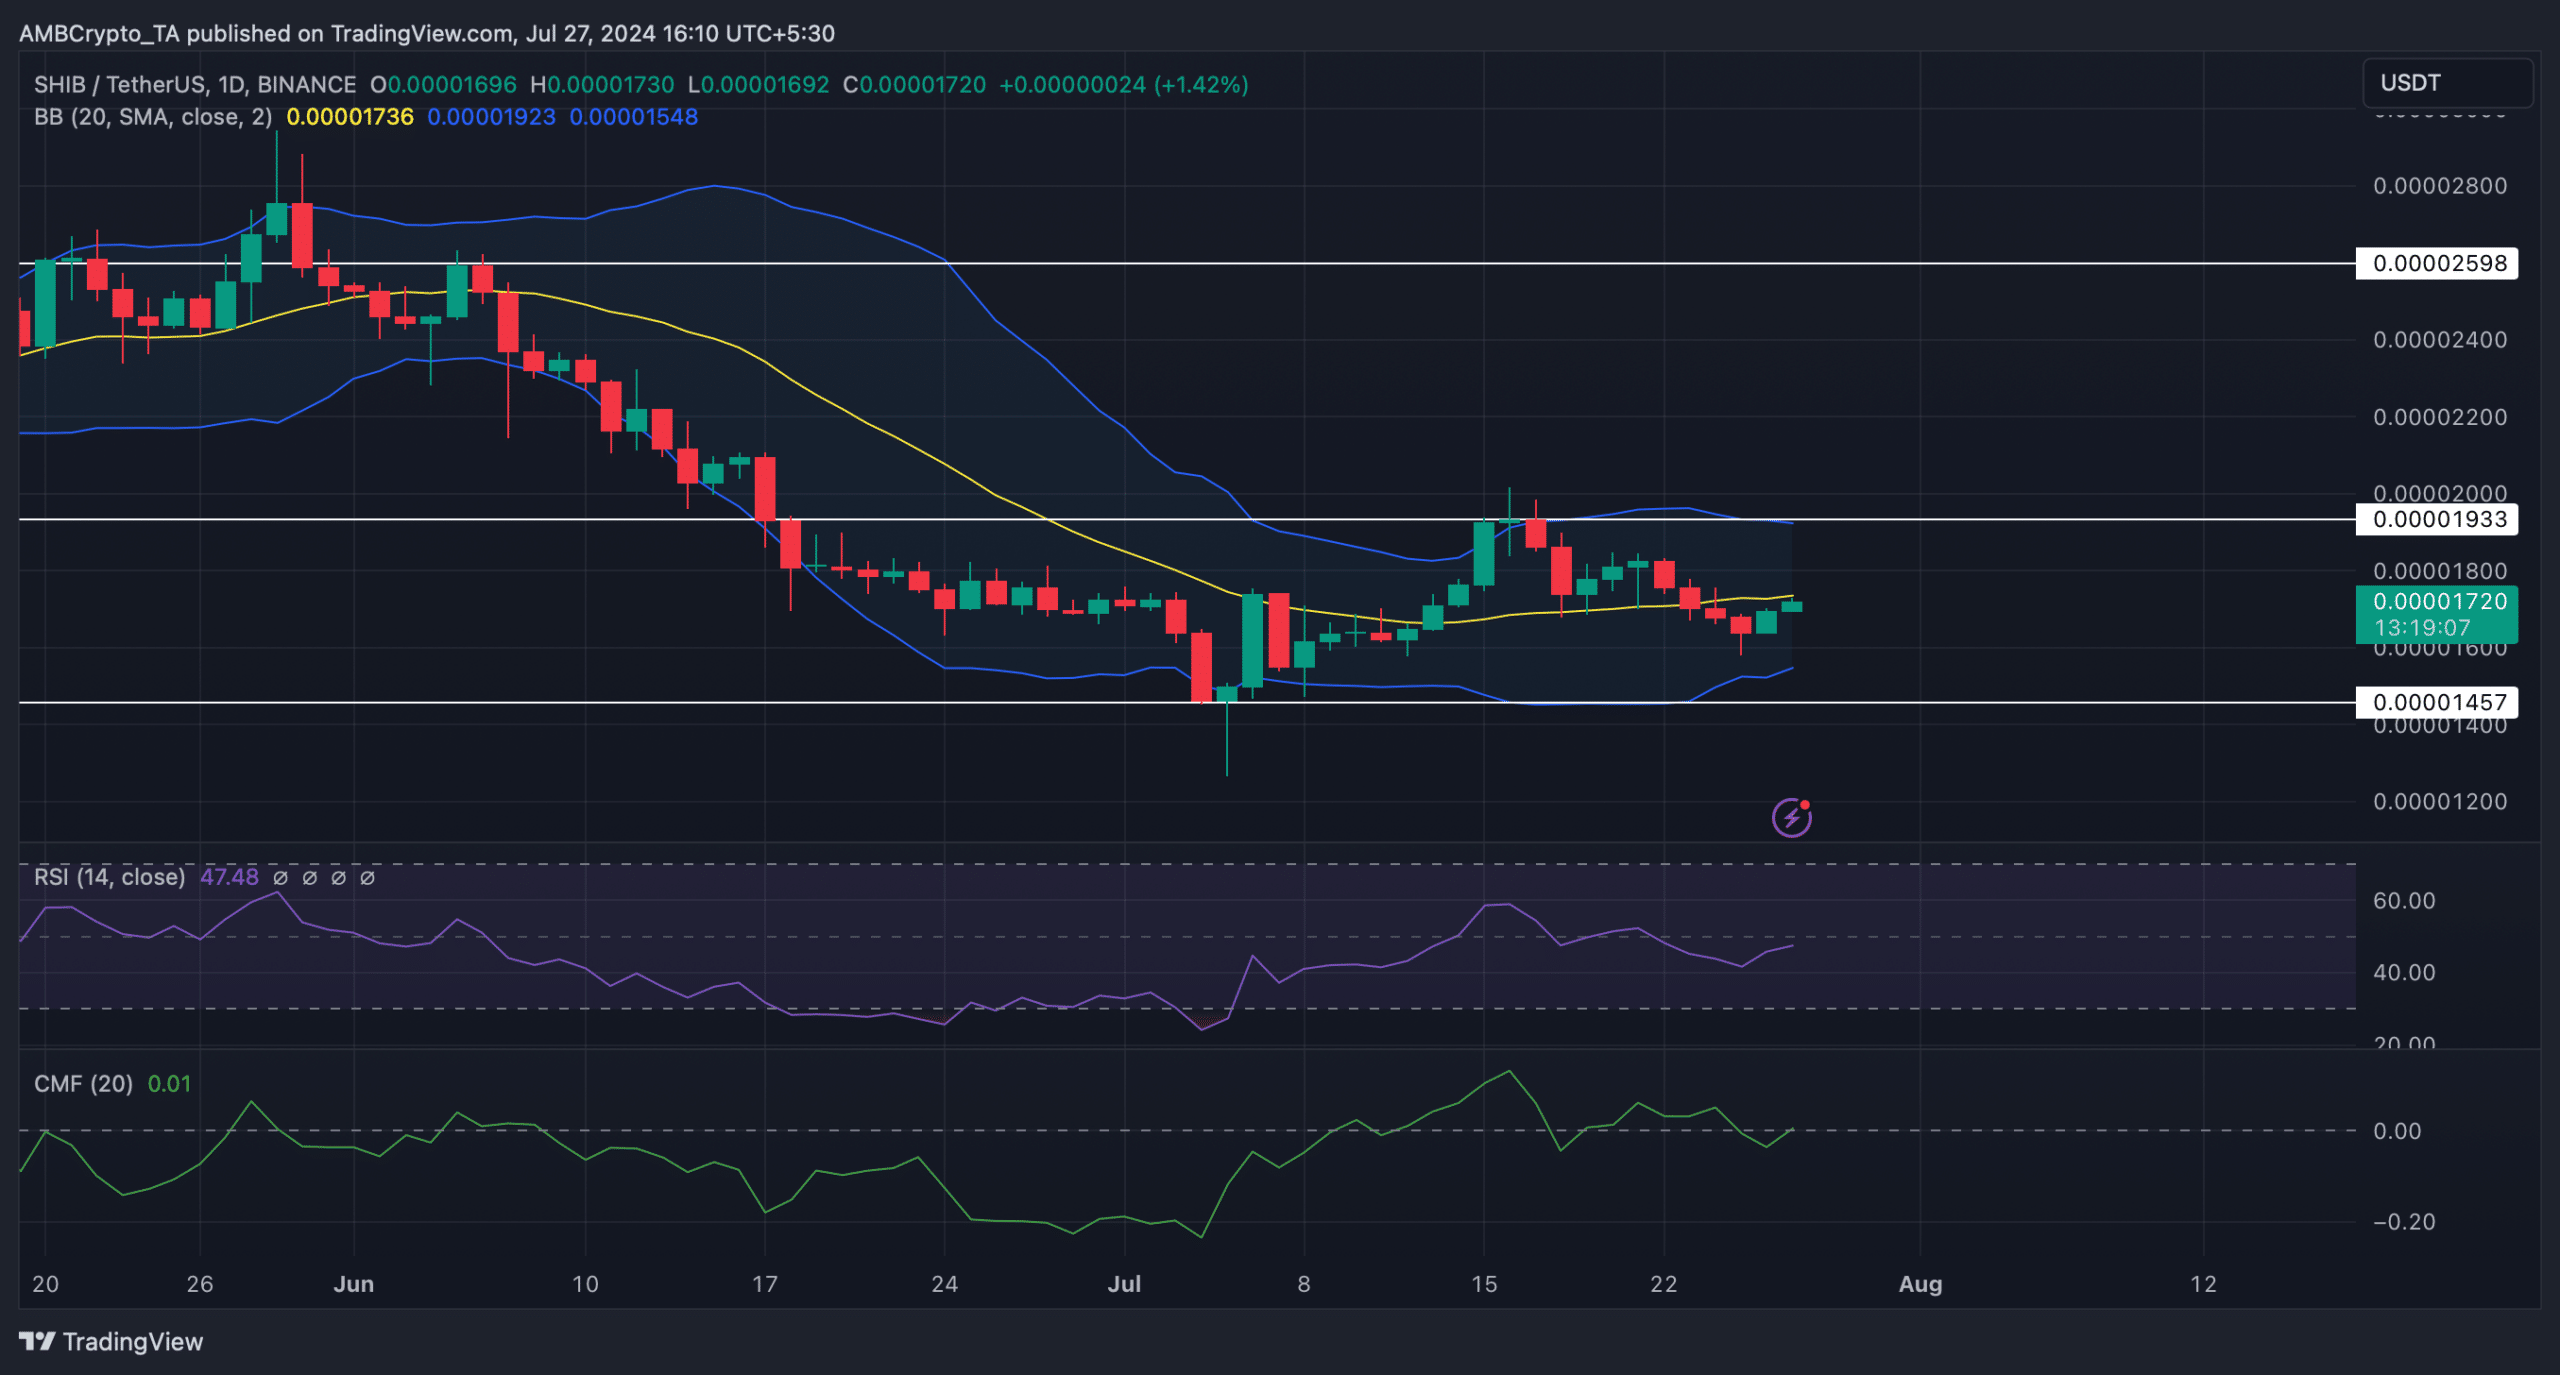
Source: TradingView