Shiba Inu’s price action hints at an explosive rally thanks to this pattern

Shiba Inu price has been on a consolidation rally for more than three months and is sitting inside a massively bullish, bottom reversal pattern. Therefore, investors need to keep a close eye on this altcoin as SHIB could explore any time and trigger a massive rally.
Shiba Inu price awaits explosion
Shiba Inu price coils up inside an Adam and Even pattern for the 108th day and shows no sign of a massive volatility spike. If history is any proof, the 134-day consolidation that Shiba Inu price underwent in the last quarter of 2021 resulted in a 1,185% upswing in roughly a month.
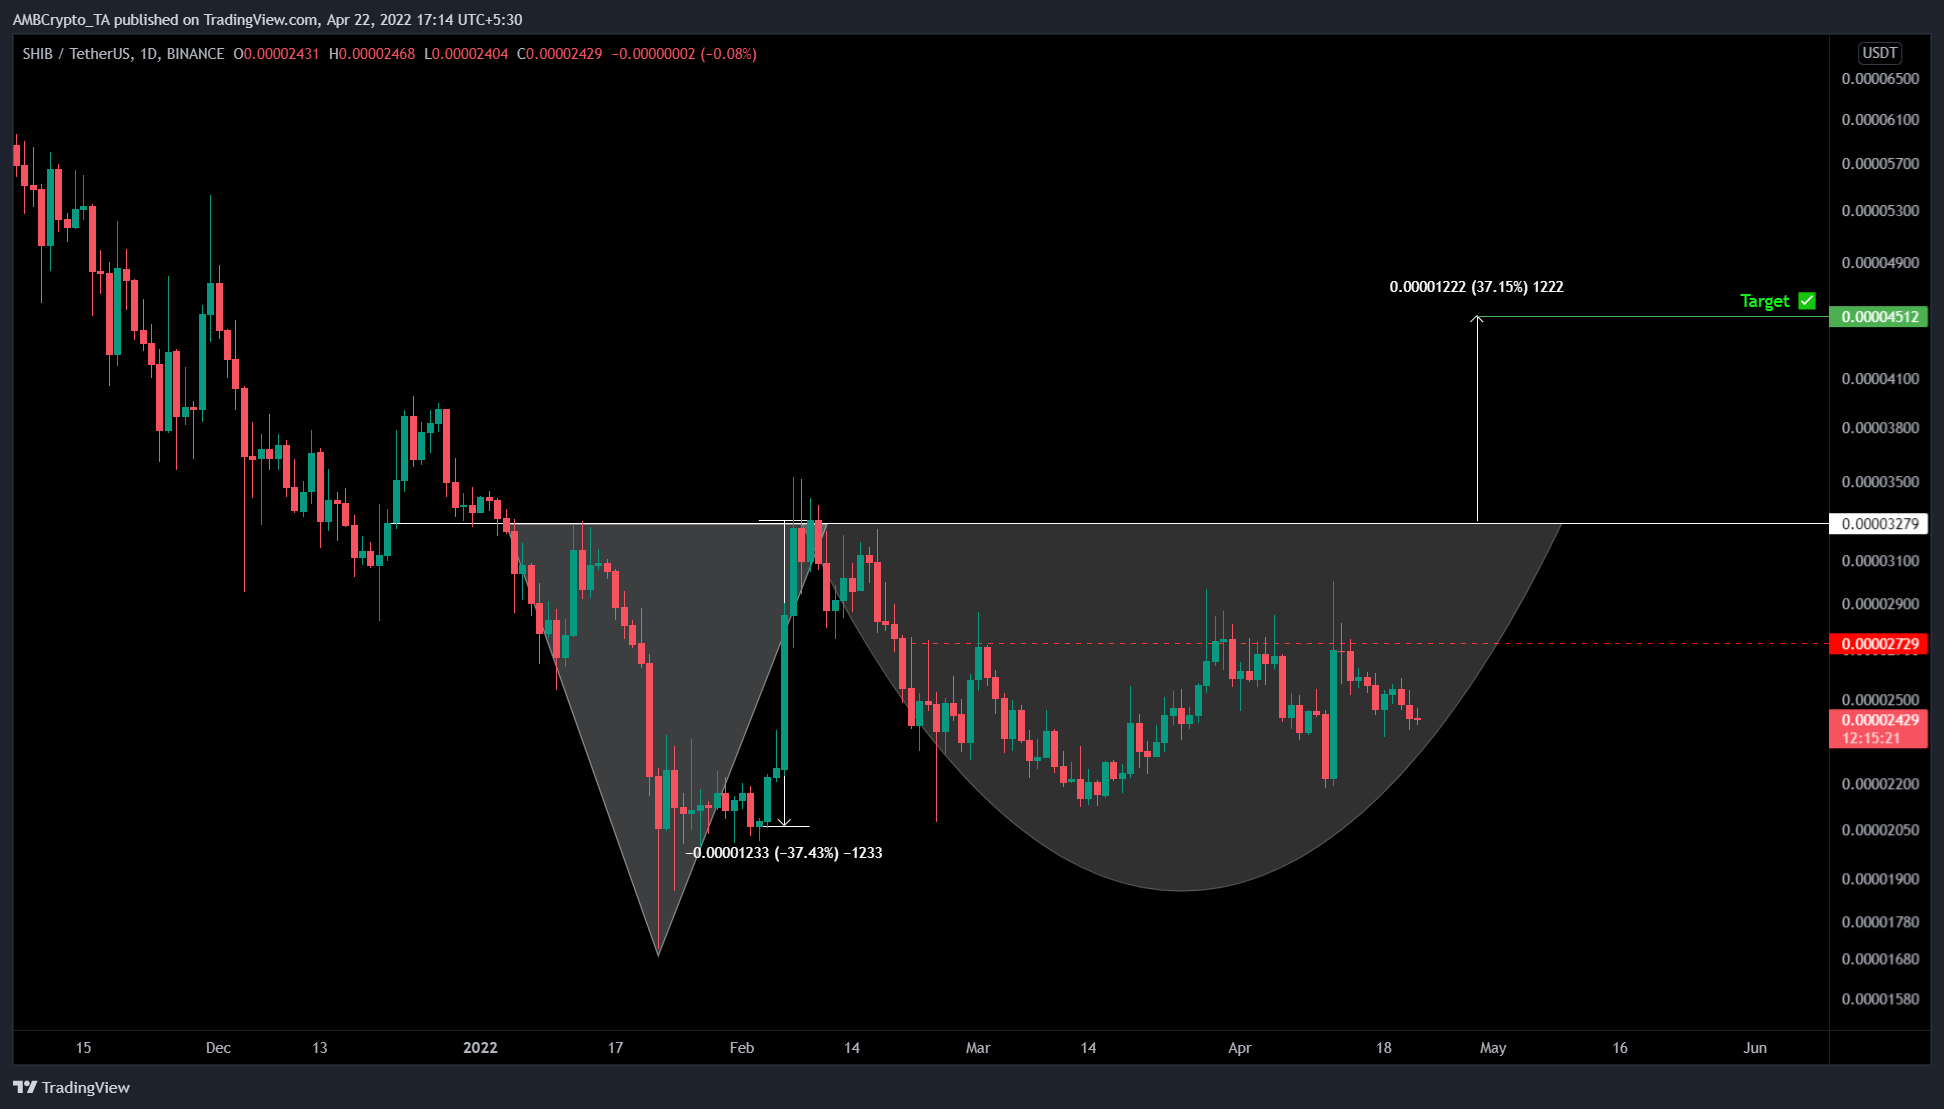
Therefore, market participants that ignore this meme coin which is consolidating inside a bottom reversal pattern will be left on the sidelines. This technical formation contains two distinctive valleys, the V-shaped one is known as “Adam” and the rounded bottom formation is referred to as “Eve.”
As shown in the chart below, the Eve is incomplete and will be upon the retest of the $0.0000327 hurdle. The theoretical measurements forecast a 37% upswing to $0.0000451, obtained by measuring the depth of Adam and adding it to the breakout point at $0.0000327.
The Robinhood-listing rally seems to be undone 70% and Shiba Inu price is currently hovering around $0.0000243. While this consolidation is likely to continue, a resurgence of buying pressure that flips the $0.0000327 hurdle will signal a breakout from the Adam and Even pattern.
In this situation, investors can expect the next stop for the bulls to be at $0.0000451, which is the predicted target. Beyond this level, there is a high chance SHIB will tag the $0.00005 psychological level. This move from the current position would constitute a 105% ascent and is likely where Shiba Inu price will form a base of sorts before reevaluating its directional bias depending on the market conditions.
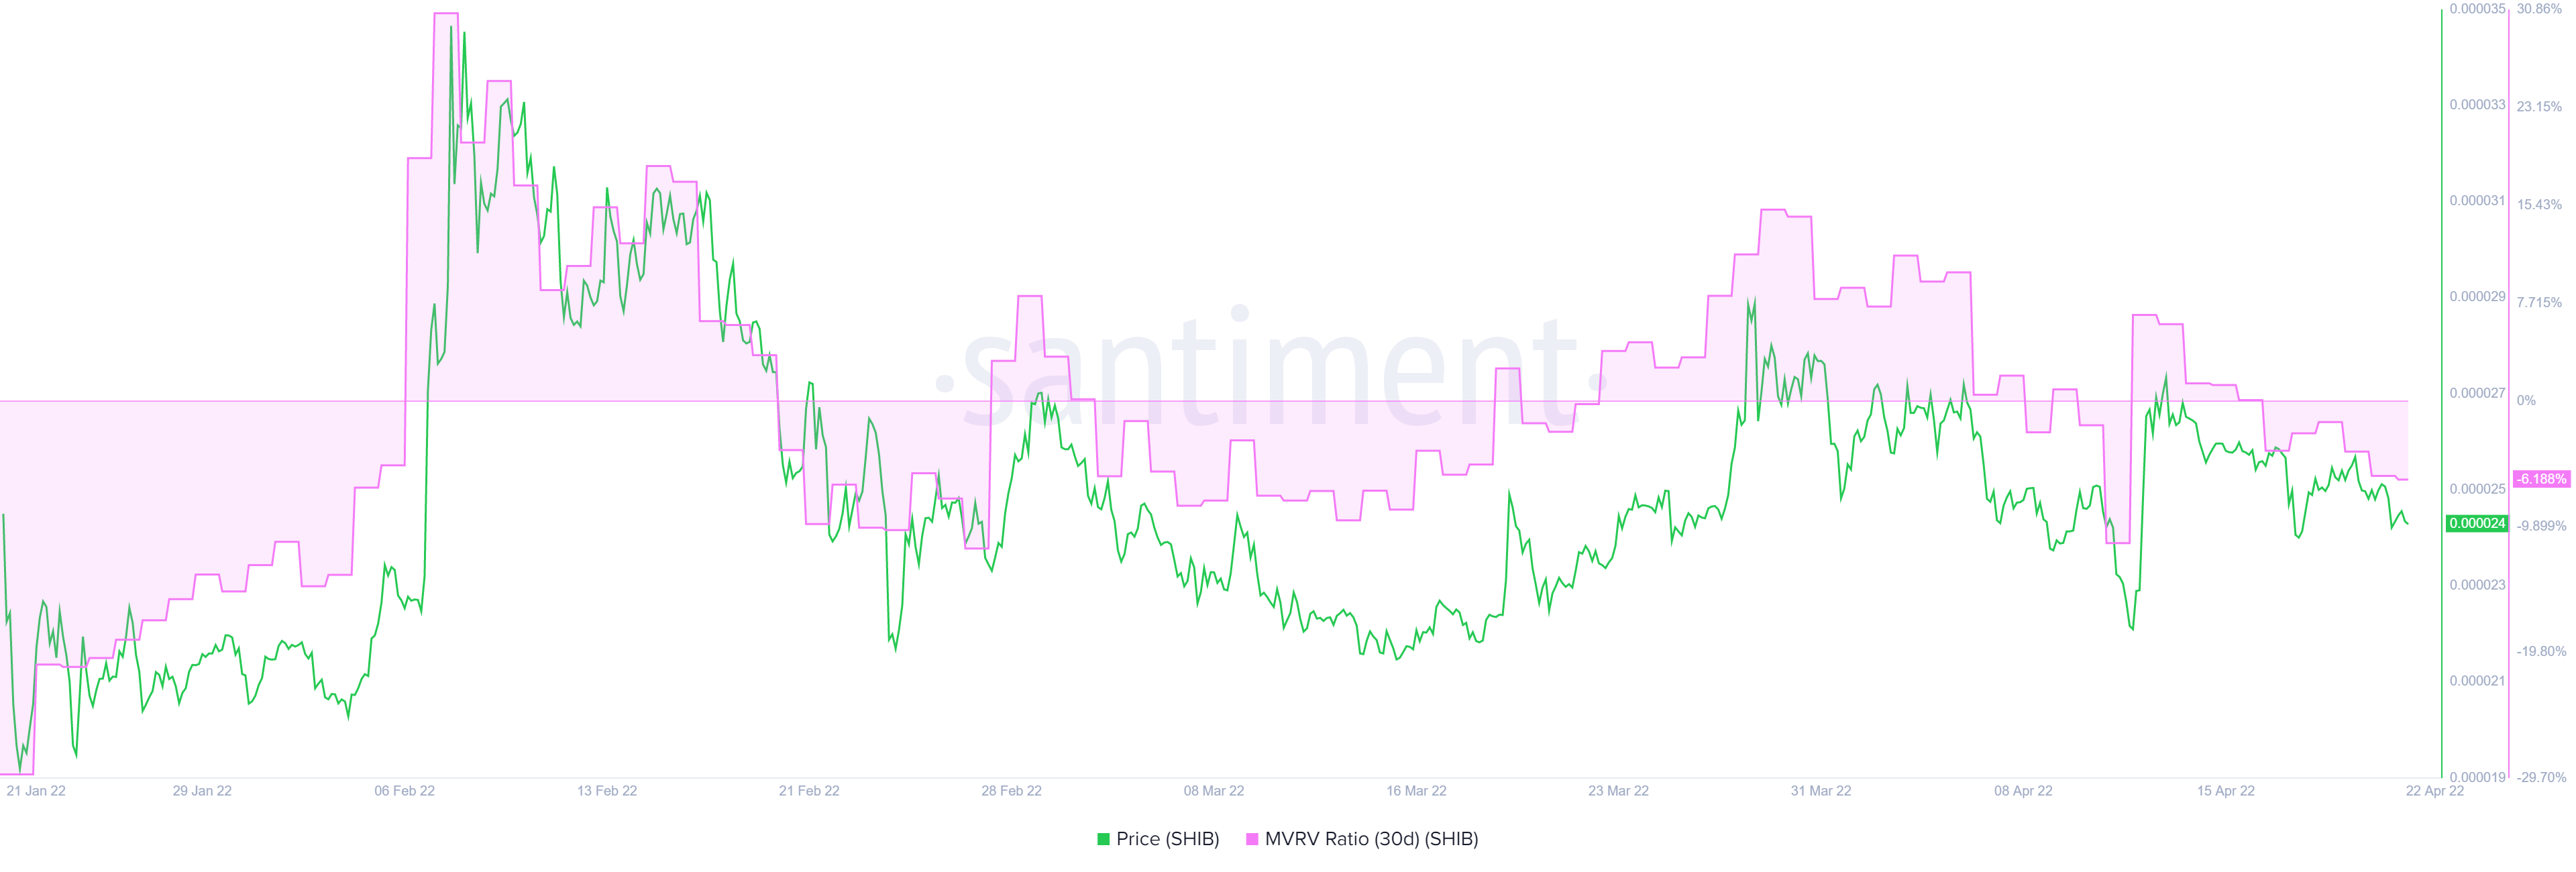
While the technicals are bullish no doubt, the 30-day Market Value to Realized Value (MVRV) model further adds credence to this outlook. This indicator is used to identify the average profit/loss of market participants that purchased SHIB tokens over the past month.
Based on Santiment’s backtest, a value below -10% indicates that short-term holders are at loss and is typically where long-term holders accumulate. Therefore, a value below -10% is knowns as an “opportunity zone,” since the risk of a sell-off is less.
Currently, the index is hovering at -6% after an uptick from -11% on April 11, indicating that the accumulation is in progress. Moreover, the historical data over the last three months shows that local tops are formed at around 15%, revealing that there is more room for the SHIB price to move north. This conclusion coincides with the views expressed from a technical perspective.