Shiba Inu’s price action will go this way thanks to these signals
Disclaimer: The findings of the following analysis are the sole opinions of the writer and should not be taken as investment advice
Shiba Inu found itself in troubled waters as investors locked in their gains following a near 330% surge in value. Over the last 24 hours, SHIB retraced by 15% and broke below two crucial near-term support levels. A daily close below the 38.2% Fibonacci Retracement level could lead to a spillover towards $0.00002047, resulting in a further loss of 17%.
Shiba Inu 4-hour Chart
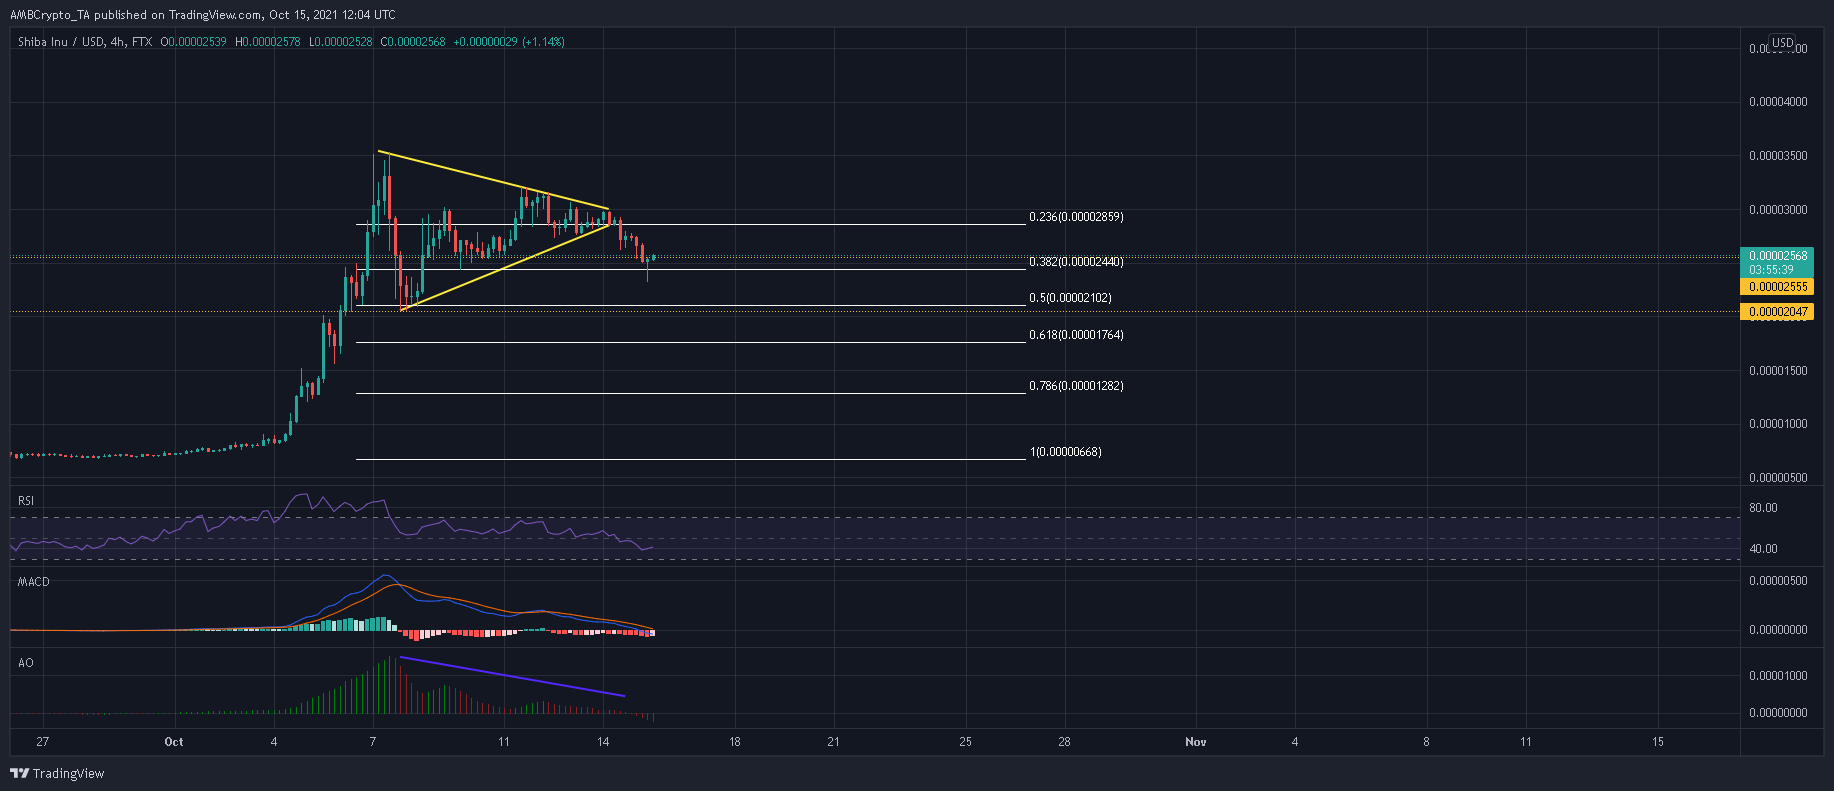
Although SHIB’s symmetrical triangle presented chances of further upside, bears turned the tide in their favor after forcing a close below $0.00002757. Moreover, a weakening RSI and MACD invited short-selling as SHIB made its way below $0.00002555 and shifted towards the 38.2% Fibonacci level. If this level is conceded to the bears as well, SHIB will be exposed to an additional 16% sell-off.
Now, there are some chances of a reversal at the 38.2% Fibonacci level. Traders should be on the lookout for a bullish spinning top or a doji candlestick. Such a development could see SHIB trade sideways for a brief period as the dust settles in the market.
A comeback above the 38.2% Fibonacci level can be expected once the indicators move above their respective half-lines.
Reasoning
A series of lower highs, along with the MACD and RSI, flashed several bearish divergences as SHIB took shape within its triangle. This acted as a bit of a precursor to the breakdown.
The Awesome Oscillator also moved below the half-line after registering several bearish twin peaks. Such readings can be expected to generate some more selling pressure before a reversal took place.
Conclusion
SHIB faced the threat of an additional 16% drawdown below the 38.2% Fibonacci level. The RSI had more room for losses before touching oversold levels while the Awesome Oscillator and MACD showed no signs of reversing just yet. Those expecting an early reversal should keep their eyes peeled out for a bullish spinning top or a doji candlestick.


