Shiba Inu
Shiba Inu’s price back to its March highs? Here are the steps…
After breaking out of a bullish pattern, SHIB’s price turned bearish. What does this mean?
- SHIB’s price fell by over 3% in the last 24 hours
- A few metrics and indicators hinted at a trend reversal soon
Shiba Inu [SHIB] managed to break out of a bullish pattern a few days ago, hinting at a massive bull rally. However, things on the ground turned out to be a bit different as the memecoin’s value dropped over the last 24 hours.
Shiba Inu’s bullish move
Shiba Inu, the world’s second-largest memecoin, entered a bullish flag pattern in March. The memecoin consolidated inside the pattern for multiple weeks. Finally, it managed to break above a bullish flag pattern on 14 May. At the time, t
his episode suggested that SHIB might turn bullish to allow it to hit its March highs once again.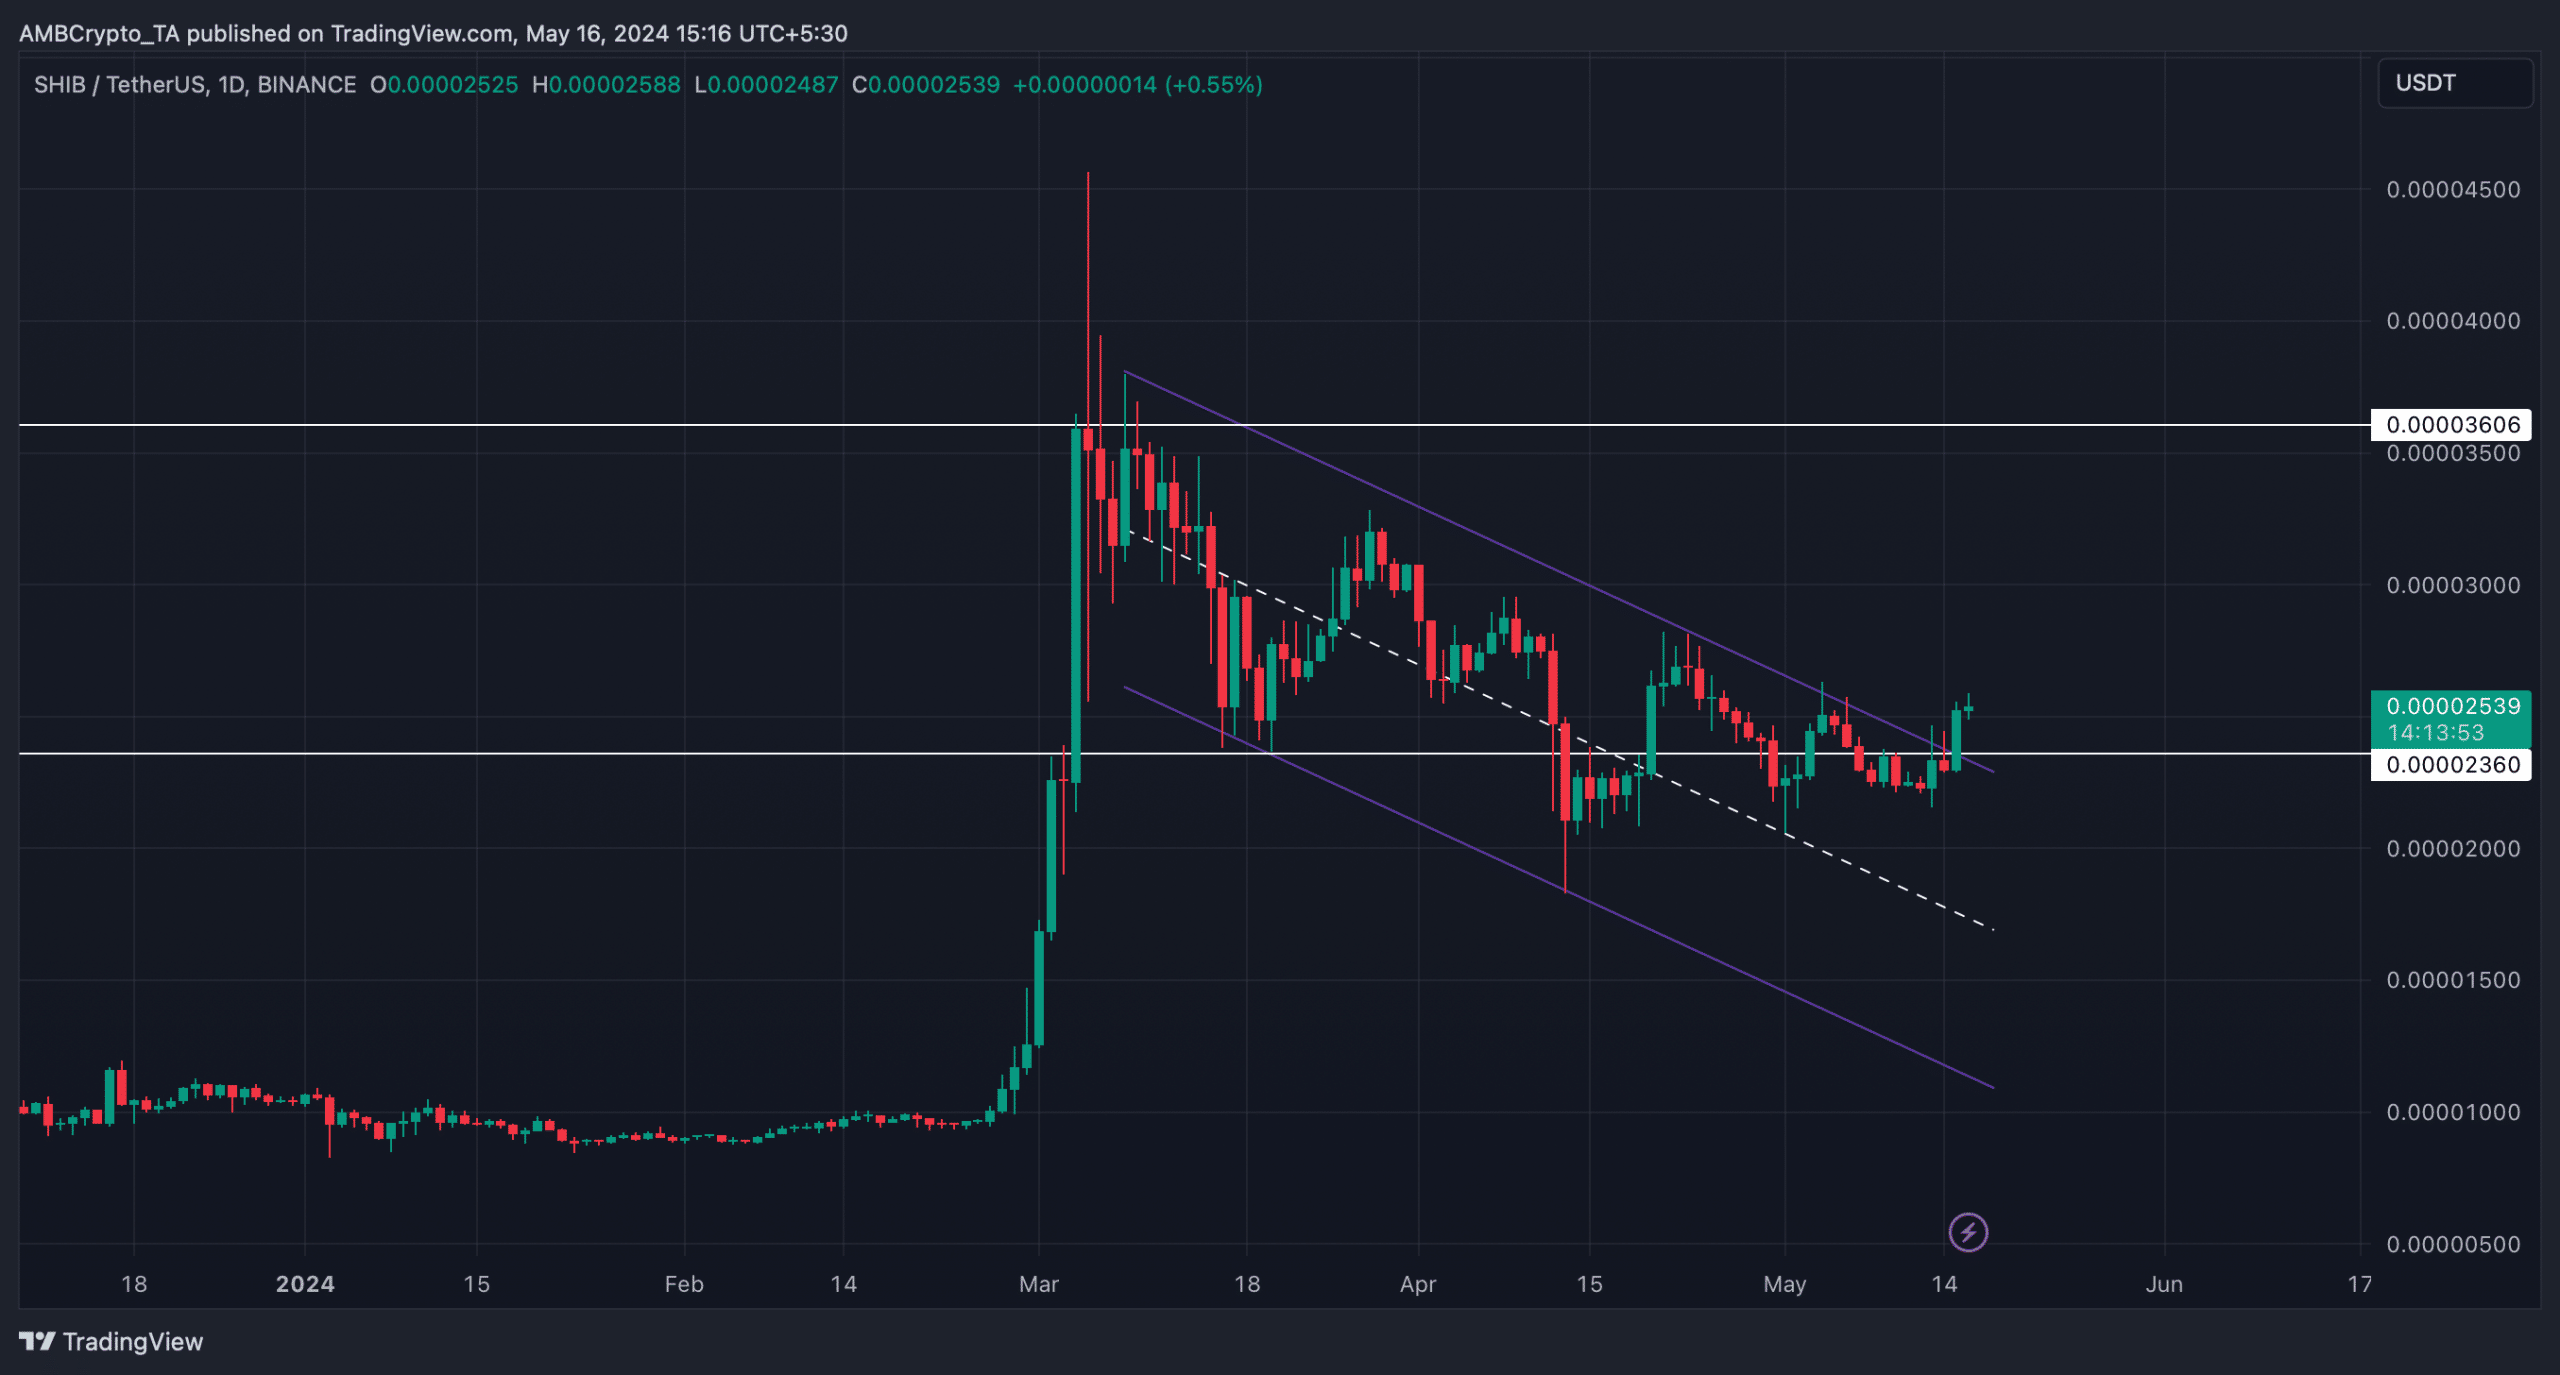
Source: TradingView
However, days after the breakout, SHIB faced a roadblock as bears stepped up their game. In fact, according to CoinMarketCap, SHIB fell by more than 3% in the last 24 hours.
At the time of writing, SHIB was trading at $0.00002482 with a market capitalization of over $14 billion, making it the 11th largest crypto on the charts.
Though this seemed concerning, there is more to the story. Especially since SHIB might just be retesting its support at $0.0000236 before it gains bullish momentum to reclaim $0.00003 in the coming weeks.
Which way will SHIB go?
To see whether SHIB would actually test that support or gain bullish momentum before that, AMBCrypto analyzed its on-chain metrics. As per our analysis of Santiment’s data, SHIB’s MVRV ratio declined over the last few hours. This meant that fewer investors were in profit.
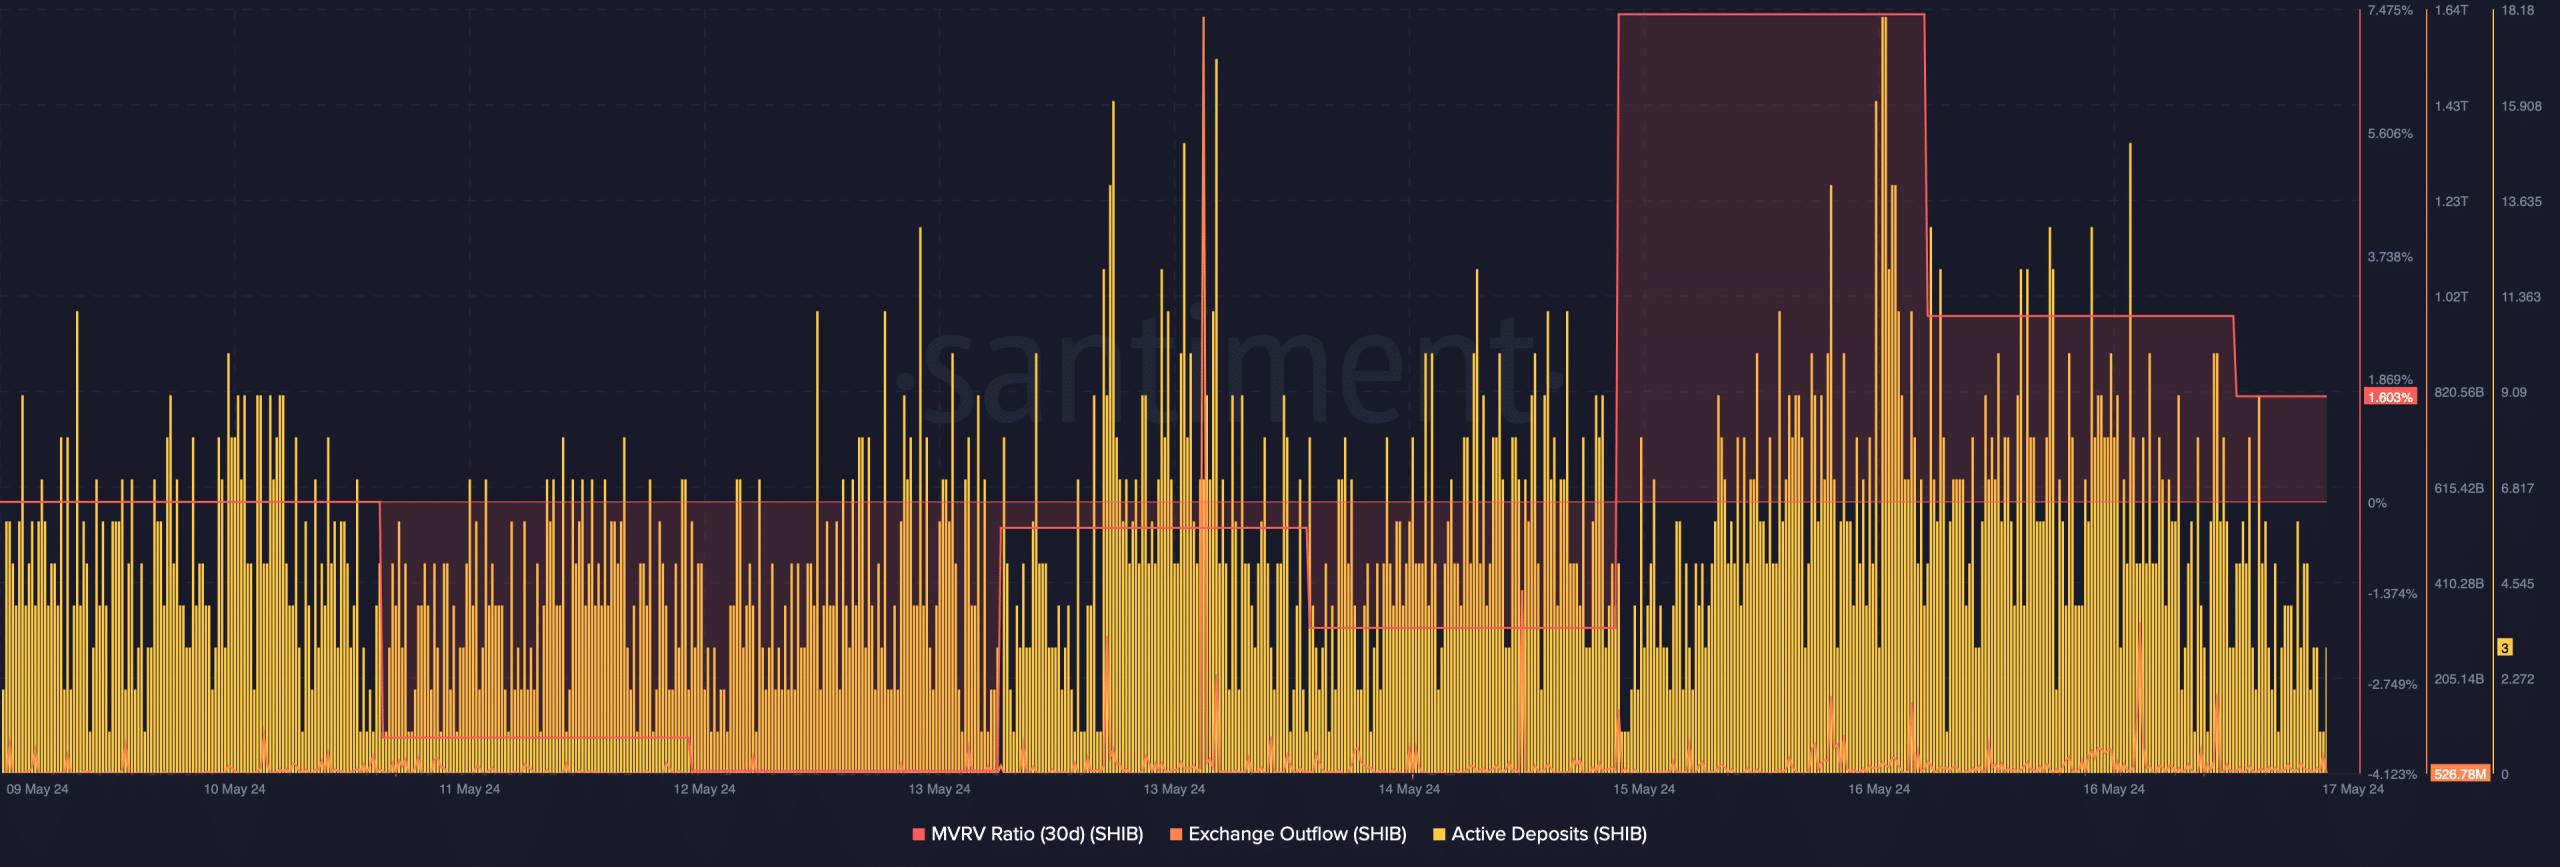
Source: Santiment
In fact, SHIB’s exchange outflows declined too, meaning that investors have not been buying SHIB. On the contrary, its active deposits increased sharply last week. This revealed that investors were selling their holdings – A sign that a further price drop may be incoming.
On the contrary, AMBCrypto’s assessment of Glassnode’s data revealed a bullish metric. We found that Shiba Inu’s Network To Value (NVT) ratio registered a sharp decline on 13 May.
For starters, a drop in the metric means that an asset is undervalued, hinting that SHIB might turn bullish before testing its support.
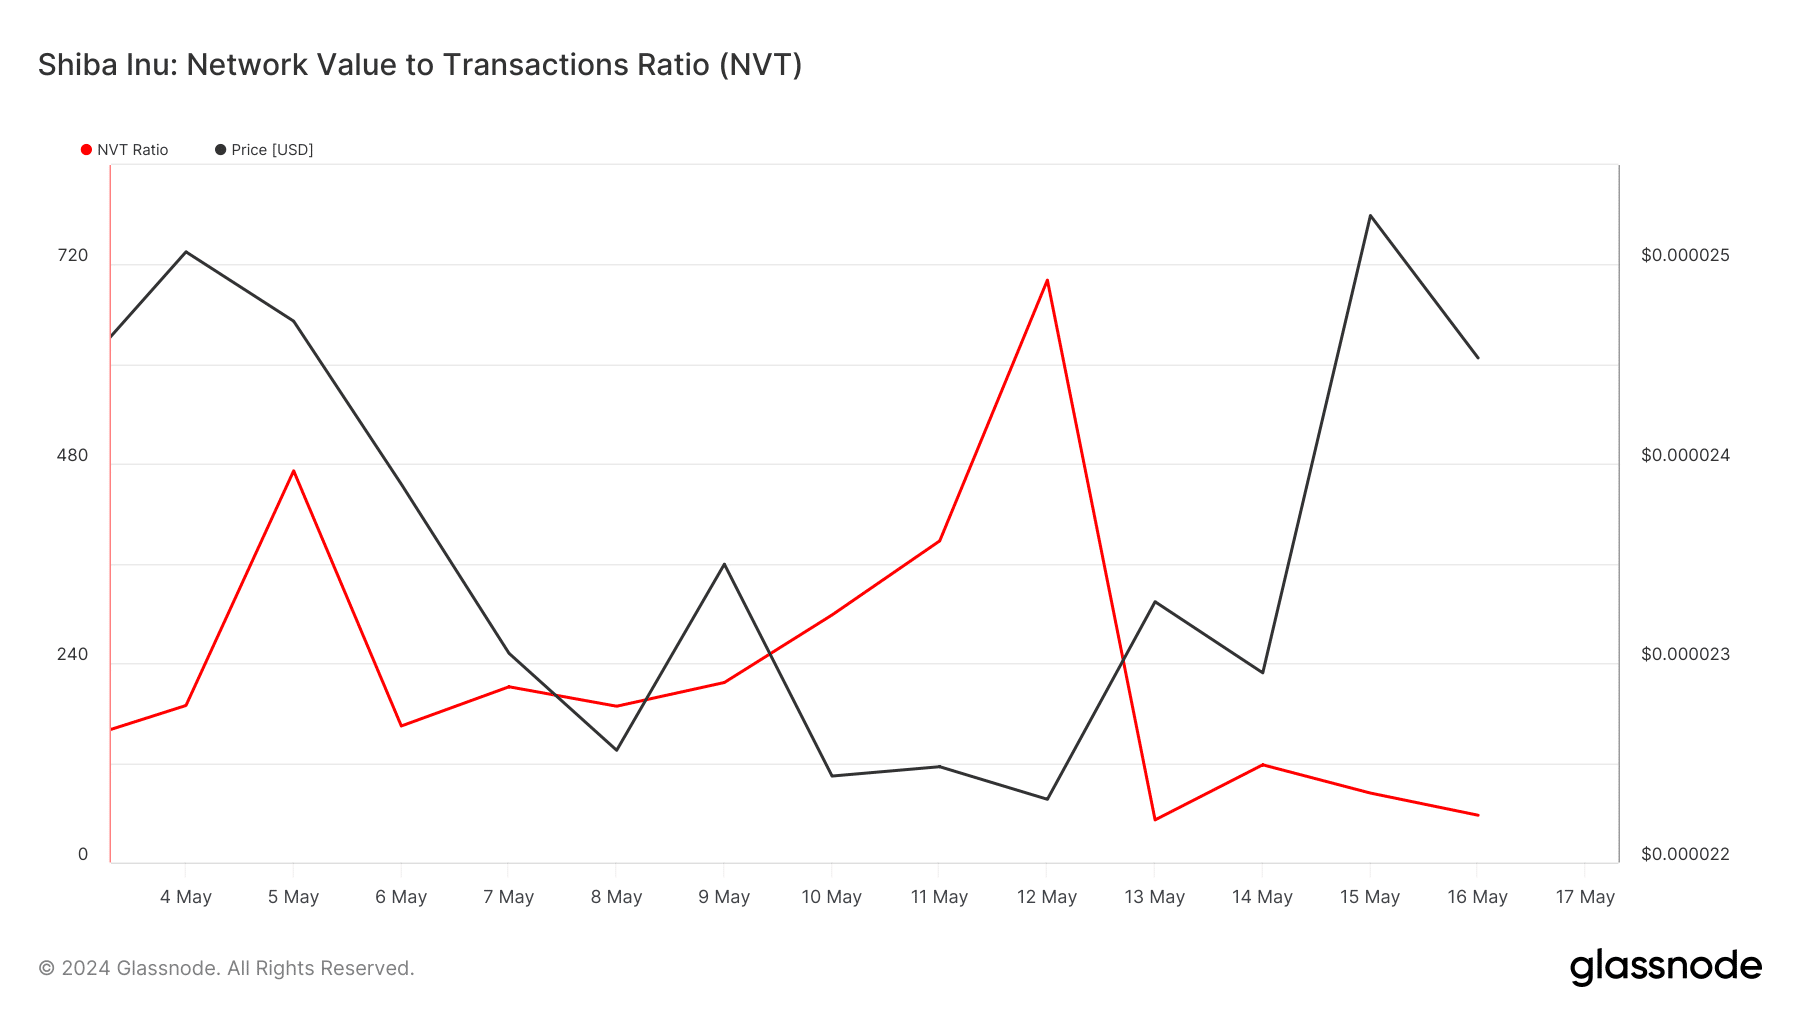
Source: Glassnode
To better understand what to expect from SHIB, AMBCrypto then analyzed its daily chart. As per our analysis, SHIB’s Relative Strength Index (RSI) registered a slight uptick above the neutral zone, giving more credence to bullish projections.
Read Shiba Inu’s [SHIB] Price Prediction 2024-2025
Nonetheless, a few of the other indicators told a different story. For example, the Money Flow Index (MFI) went south. Moreover, the Chaikin Money Flow (CMF) continued to remain well under the neutral mark – A sign that SHIB might test its support at $0.0000236.