Shiba Inu’s [SHIB] 10% plunge in 7 days, explained
The low demand for SHIB’s price has put downward pressure on its price.
![Shiba Inu's [SHIB] 10% plunge in 7 days, explained](https://ambcrypto.com/wp-content/uploads/2024/06/SHIB.jpg)
- SHIB’s price has dropped by almost 10% in the past seven days.
- Its key technical indicators confirm the possibility of a further price drop.
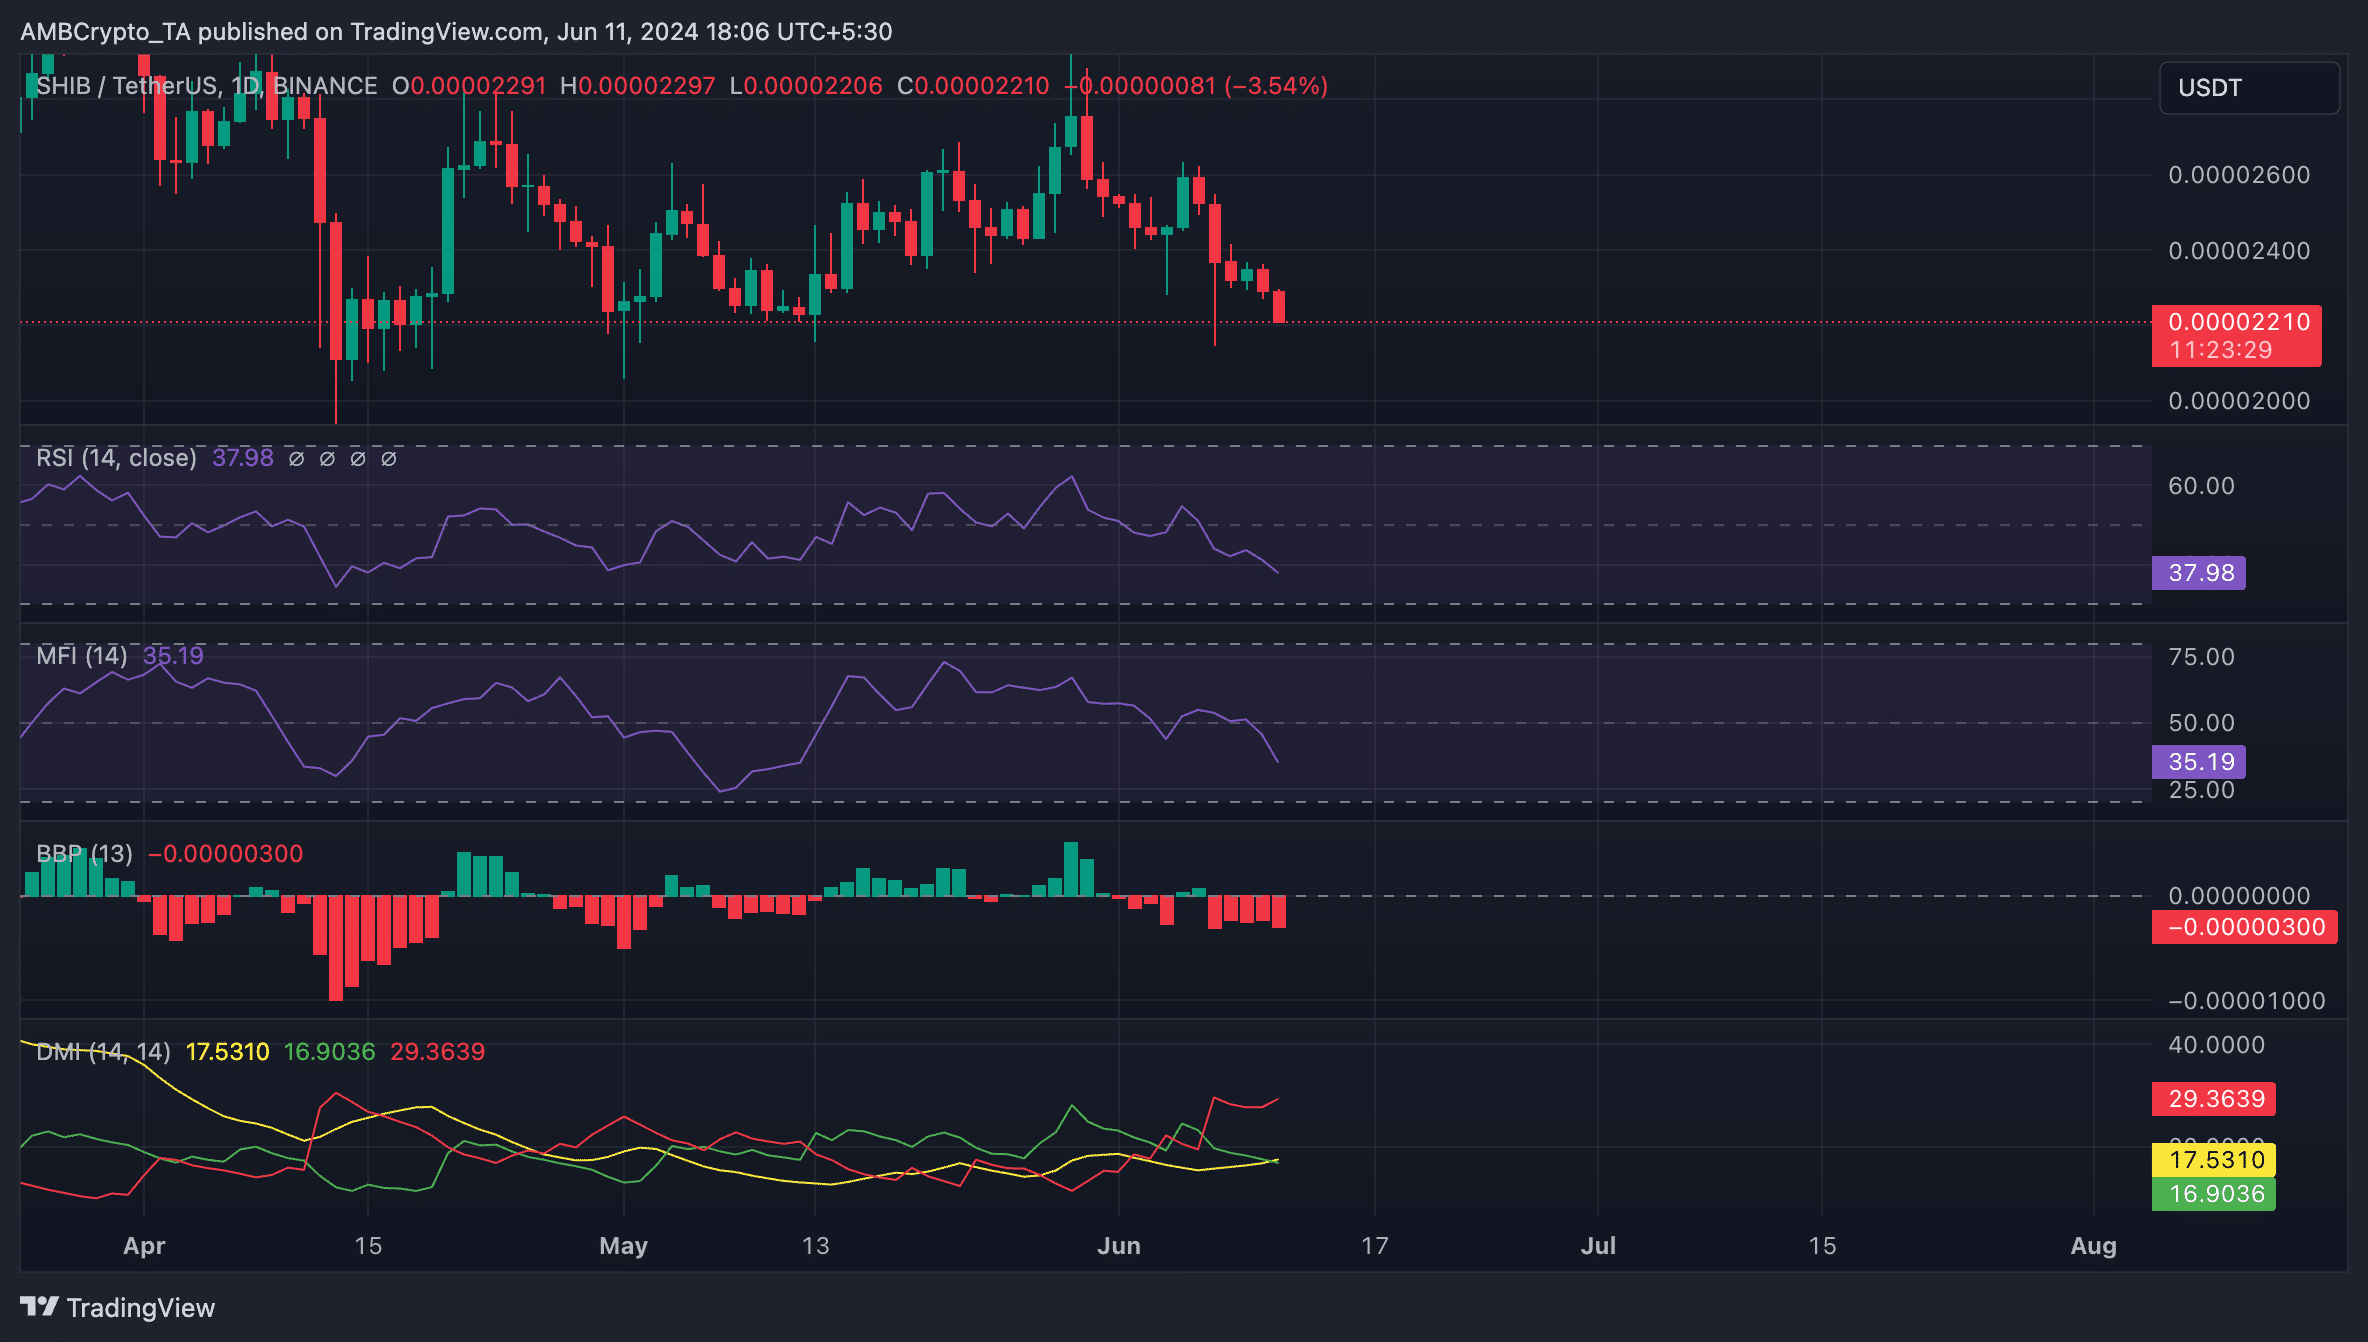
Shiba Inu [SHIB] is poised to extend its seven-day decline as the demand for the memecoin continues to plummet.
At press time, the leading meme asset traded at $0.000022. According to CoinMarketCap’s data, its price has dropped by almost 10% in the last week.
SHIB holders lose interest
AMBCrypto assessed SHIB’s key momentum indicators and found that they trended downward and were positioned elbow their respective center lines.
For example, SHIB’s Relative Strength Index (RSI) was 38.27, while its Money Flow Index (MFI) was 35.21.
These indicators identify an asset’s overbought and oversold conditions by measuring how its price moves and changes.
They range between 0 and 100, with values above 70 suggesting an asset is overbought, while values less than 30 indicate that the asset is oversold and due for a correction.
Generally, SHIB’s current RSI and MFI are indicators of significant selling pressure. But they also suggest the possibility of a price rebound.
However, the assessment of other indicators confirmed that the bull strength is significantly weak, and the meme coin’s value might plummet further in the short term.
For example, SHIB’s Elder-Ray Index was -0.0000000303 at the time of writing.
This indicator measures the relationship between the strength of SHIB’s buyers and sellers. When its value is negative this way, bear power is dominant in the market.
For context, SHIB’s Elder-Ray Index has been negative since 7 June.
Also confirming how significant the bearish bias toward the altcoin was at press time, readings from its Directional Movement Index (DMI) showed its positive directional index (green) resting under its negative index (red).
When these trend lines are set up in this manner, selling pressure outweighs buying activity. It suggests that the bears have market control, and the demand for the asset in question continues to plunge.
Read Shiba Inu’s [SHIB] Price Prediction 2024-25
If SHIB’s selling momentum continues to gain, its price might dip below $0.000022 to exchange hands at $0.00002.
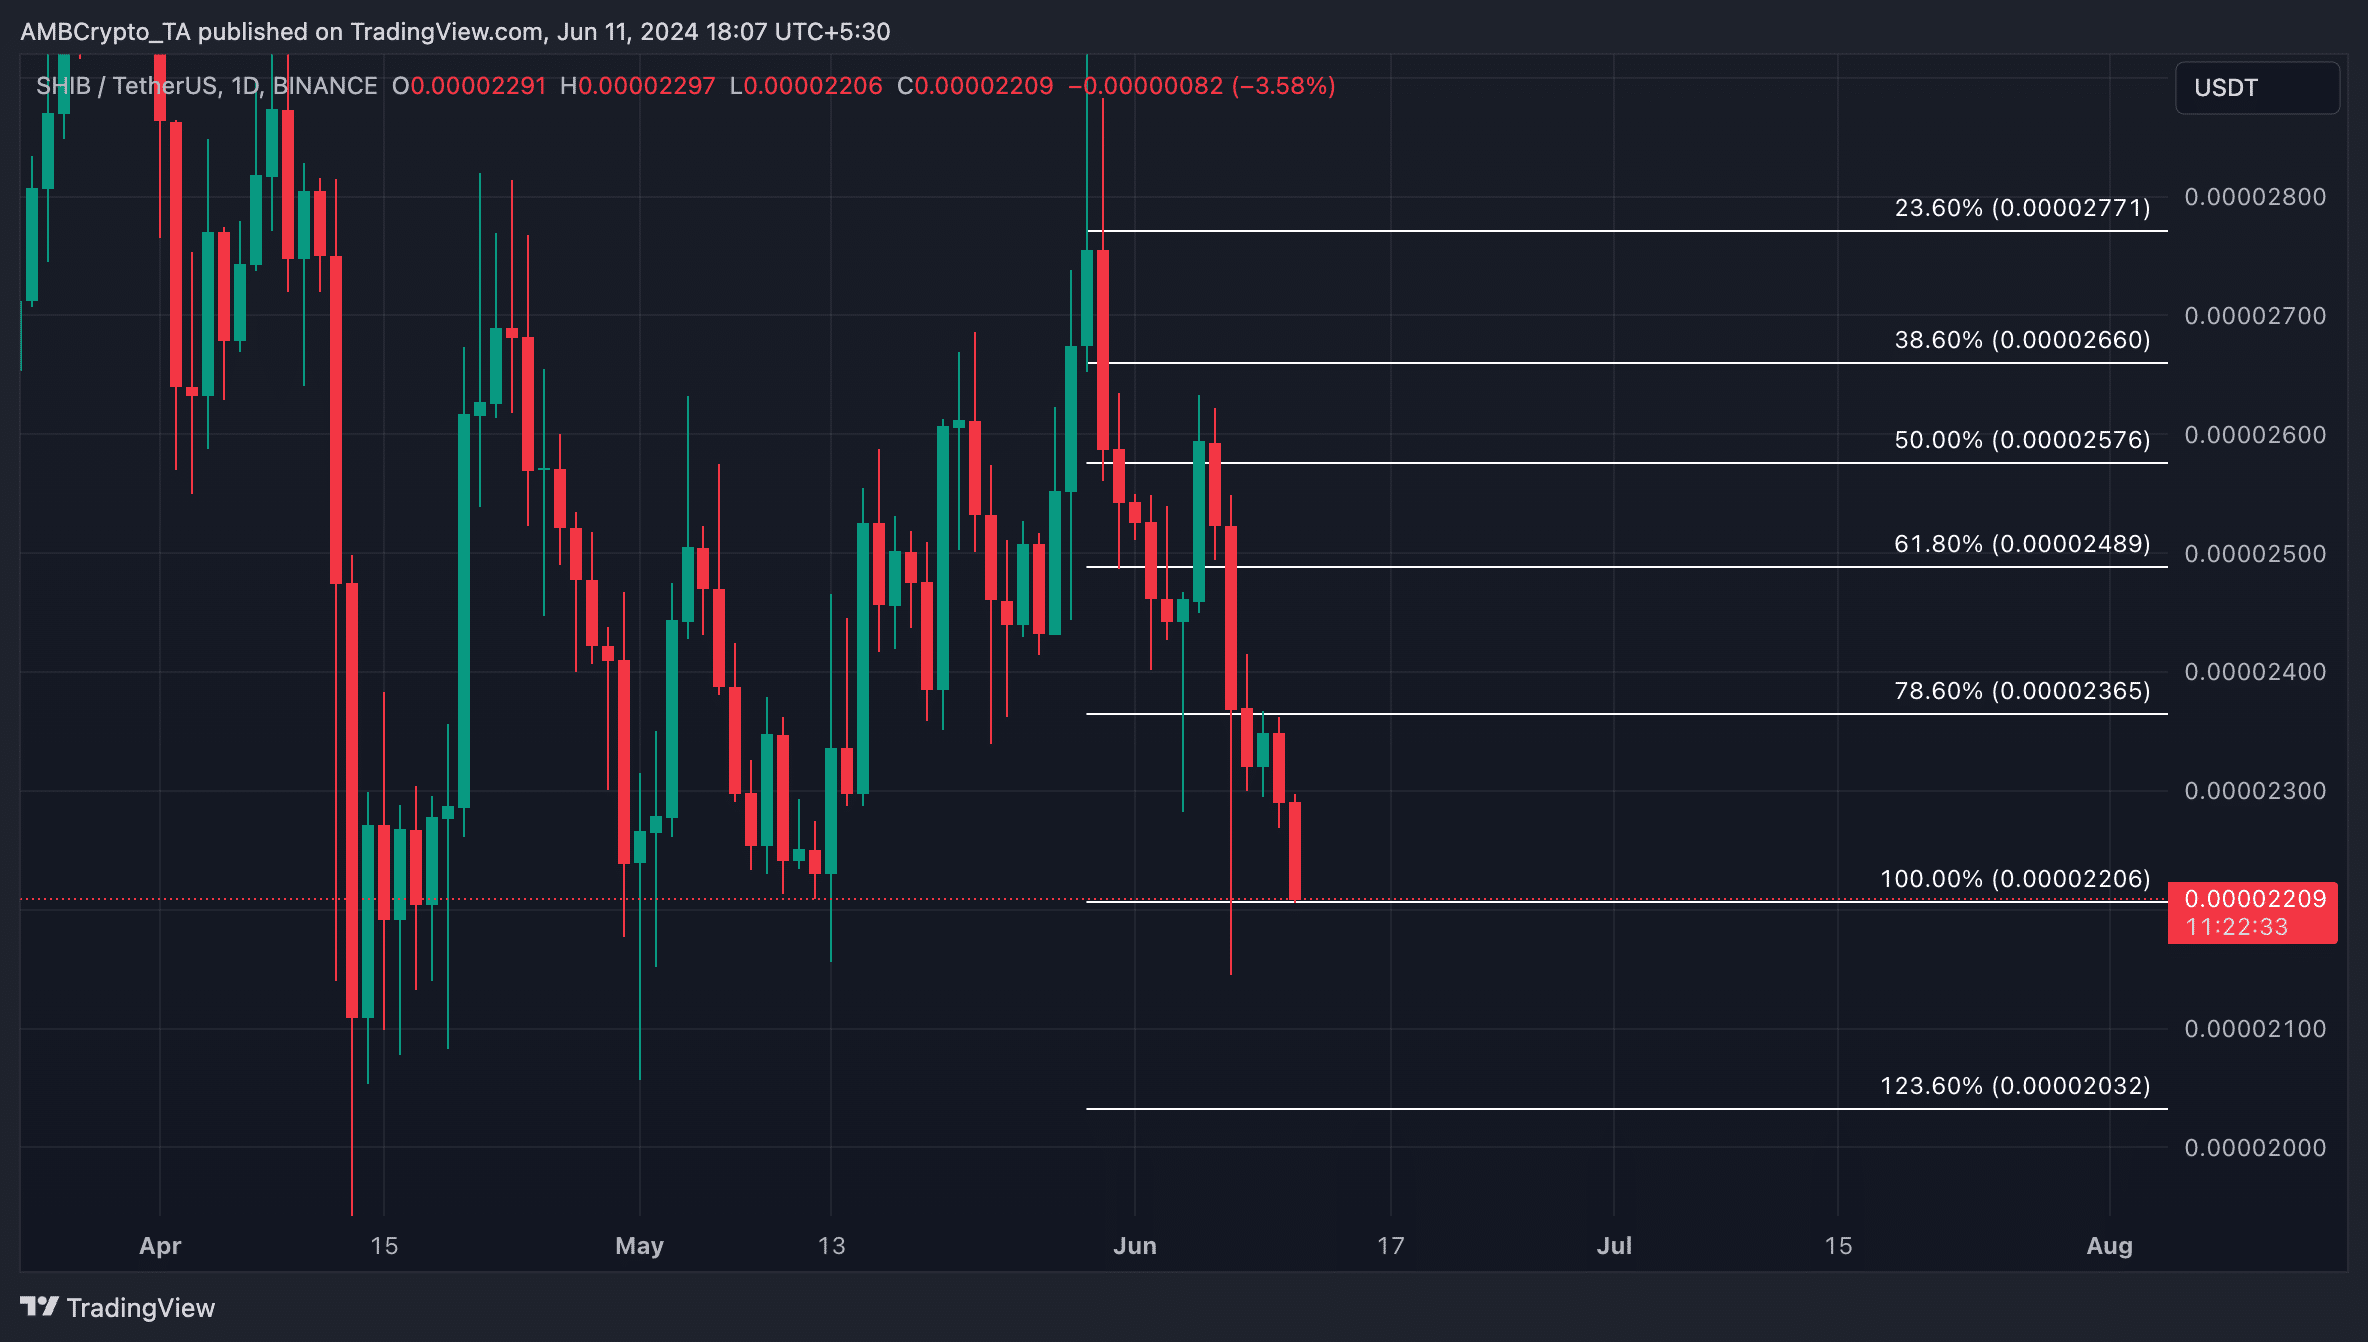
However, if sentiment shifts and traders become bullish, the meme coin’s value may rally toward $0.000024.