Shibarium declines after hitting ATH: Will SHIB face the music?

- Shibarium transactions were on the decline after hitting their all-time high.
- SHIB was on a consecutive uptrend as the price increase continued.
A few days ago, Shiba Inu’s [SHIB] L2 platform, Shibarium, experienced a surge in transactions, reaching an all-time high since its restart. Nevertheless, this initial excitement appears to have waned somewhat. Has this had any impact on SHIB’s price trend?
Is your portfolio green? Check out the SHIB Profit Calculator
Shiba Inu’s L2 sees decreasing transactions
Following its restart after an initial setback, Shibarium recently experienced a surge in transactions, achieving a historic high just a few days ago.
Data from its Shibariumscan indicated a consistent upward trend, with daily transactions peaking at over 200,000 on 11 September. However, at the time of this update, the transaction volume had slightly decreased to approximately 183,000.
Furthermore, the scanner reported that the cumulative number of transactions on the platform had surpassed 2.6 million, and the total number of wallets had exceeded 1.2 million.
SHIB 24-hour burn rate declines
Over the last 24 hours, Shiba Inu’s native token SHIB experienced a significant decrease in its burn rate. Shibburn’s data revealed a nearly 50% reduction in SHIB’s burn rate within this timeframe.
Furthermore, over the past 24 hours, an impressive 31 million SHIB tokens were burned, contributing to a cumulative total burn of over 410 trillion as of this writing.
Shiba Inu’s addresses become less active
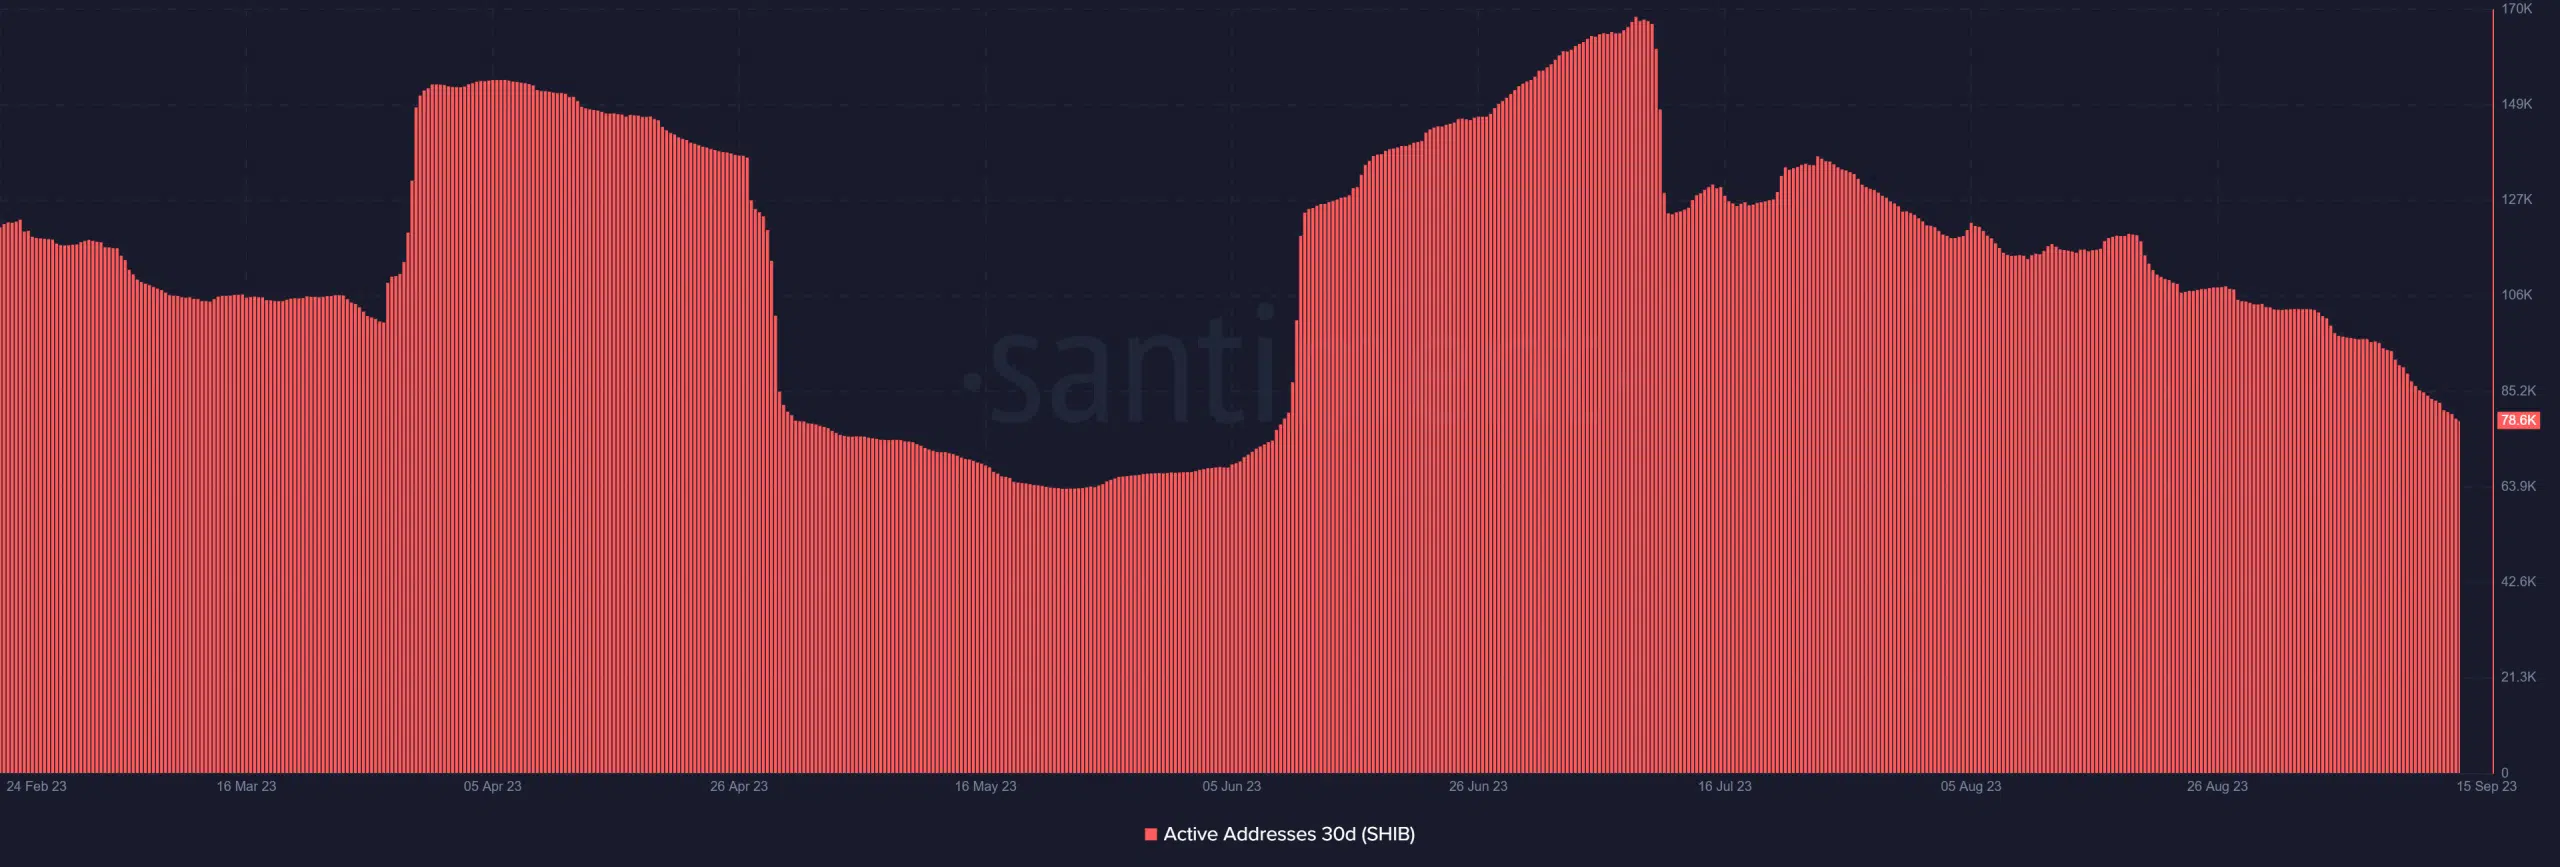
The Santiment metric tracking 30-day active addresses for Shiba Inu indicated a consistent decline in active user engagement. This trend commenced with a notable decrease in active addresses around July, and it has continued to trend downward since that initial drop.
As of this writing, the number of 30-day active addresses stands at approximately 79,000.
SHIB detaches from the downtrend
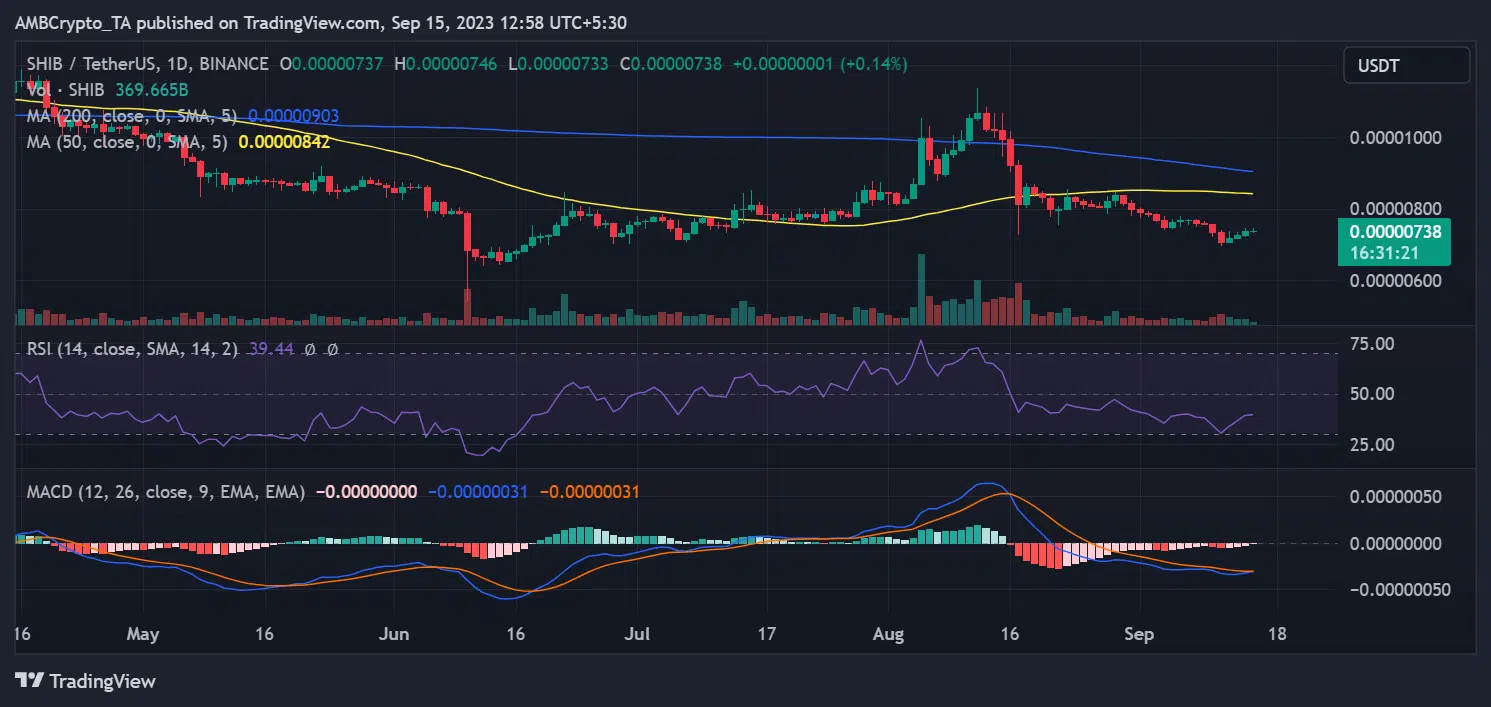
In the daily timeframe chart of Shiba Inu, there was a noticeable trend of consecutive upticks over the past four days. During this period, SHIB has witnessed a cumulative increase of over 4%. As of this writing, it continued to trade with a price increase, albeit less than 1%.
The chart also illustrated the significance of the short and long Moving Averages, represented by the yellow and blue lines, respectively. These Moving Averages served as immediate and long-term resistance levels for SHIB.
How much are 1,10,100 SHIBs worth today?
However, it’s worth noting that despite these consecutive uptrends, Shiba Inu has not managed to escape its overall bearish trend, as evidenced by its Relative Strength Index (RSI).
As of this writing, the RSI remained below 40, indicating a bearish sentiment. Nevertheless, there were signs of an emerging uptrend in the indicator.

