


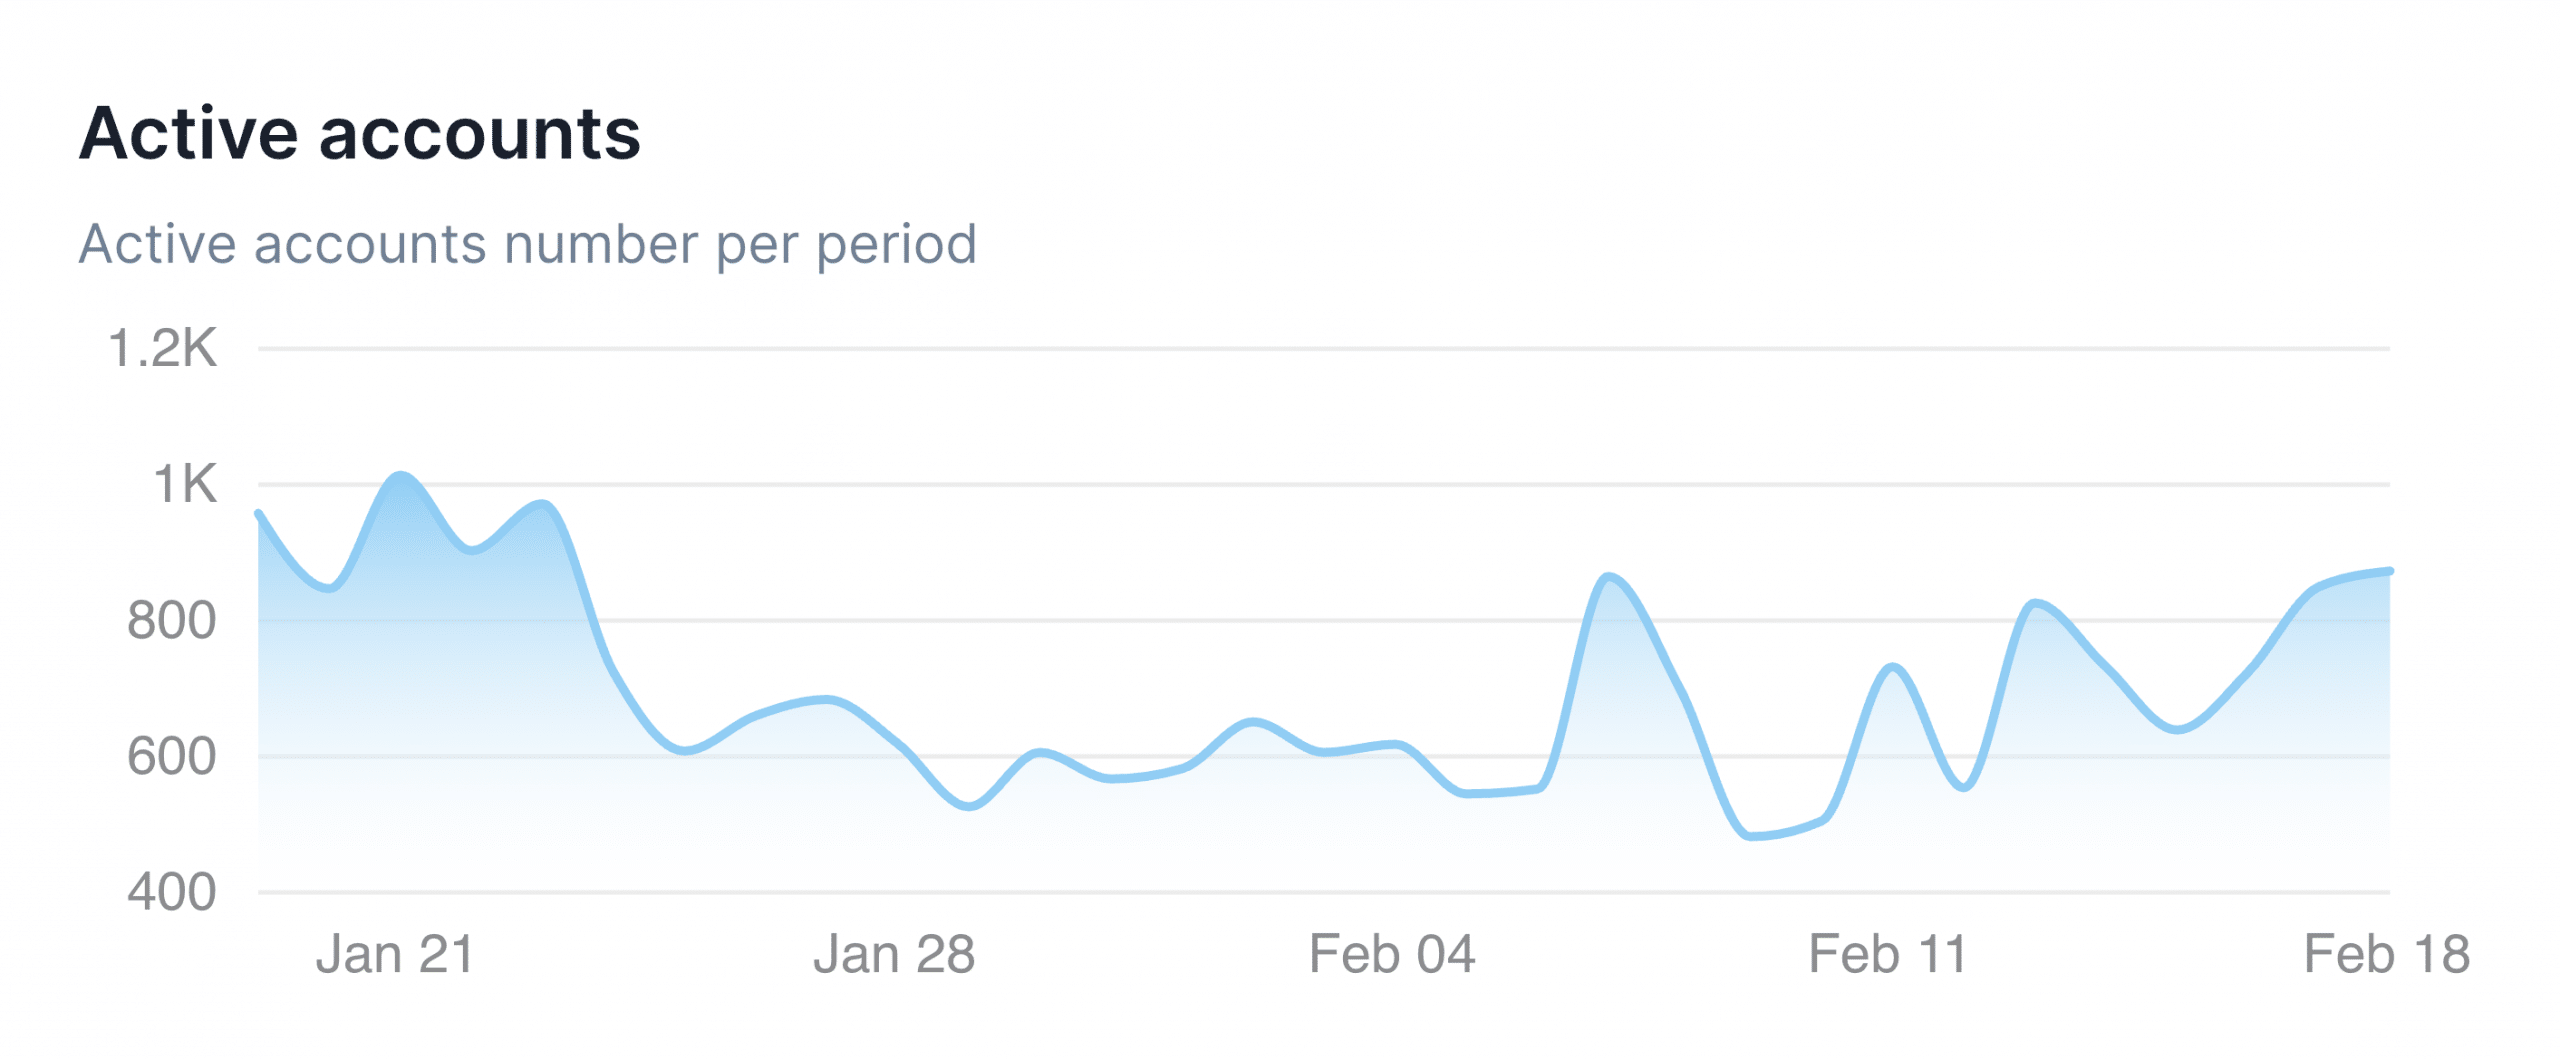
- Shibarium saw a rise in new demand between the 15th and the 18th of February.
- Although SHIB’s price has grown in the last week, it remained prone to swings.
Shiba Inu’s [SHIB] Layer 2 (L2) network Shibarium witnessed a surge in network activity following an extended period of decline in demand, data from Shibariumscan showed.
Between the 15th and 18th of February, the daily count of active addresses that completed at least one transaction on the L2 rallied by 37%.
The period was also marked by a rise in new demand for Shibarium, on-chain data revealed. The number of new transactions completed on Shibarium rose by 140%.
For context, on the 15th of February, 1 million new transactions were completed on the L2 platform. By 18th of February, this had grown to 2.4 million.
AMBCrypto found that the rise in Shibarium’s demand was preceded by a single-day 8,140% hike in BONE transfers on the network between the 14th and 15th of February.
According to data from Shibariumscan, new BONE transfers on the chain surged from 415 to 33,775 within a day.

Is SHIB the winner?
The increased activity on Shibarium and general market growth recorded in the last week caused SHIB to log a 5% price uptick in the last week.
According to data from CoinMarketCap, the leading meme coin exchanged hands at $0.000009807 at press time.
An assessment of the coin’s momentum indicator on a 24-hour chart showed sustained demand for SHIB. At press time, its Chaikin Money Flow was 0.16.
A CMF value above the zero line and rising is typically seen as a sign of strength in the market. It signals liquidity inflow, a necessary ingredient for a continued price rally.
Likewise, since the 11th of February, SHIB’s Awesome Oscillator (AO) indicator has posted only upward-facing green histogram bars whose heights have grown gradually daily.
An asset’s AO indicator measures the strength and direction of a trend of that particular asset over a given period. When it shows consistent green bars, it suggests a rise in buying pressure.
Traders often see this signal as a good time to enter a long position in an asset.
However, SHIB’s value surge in the last week has been accompanied by the possibility of a price swing.
Read Shiba Inu’s [SHIB] Price Prediction 2024-25
AMBCrypto’s readings from the coin’s Bollinger Bands (BB) revealed the steady widening of the gap between the upper and lower bands of the indicator.
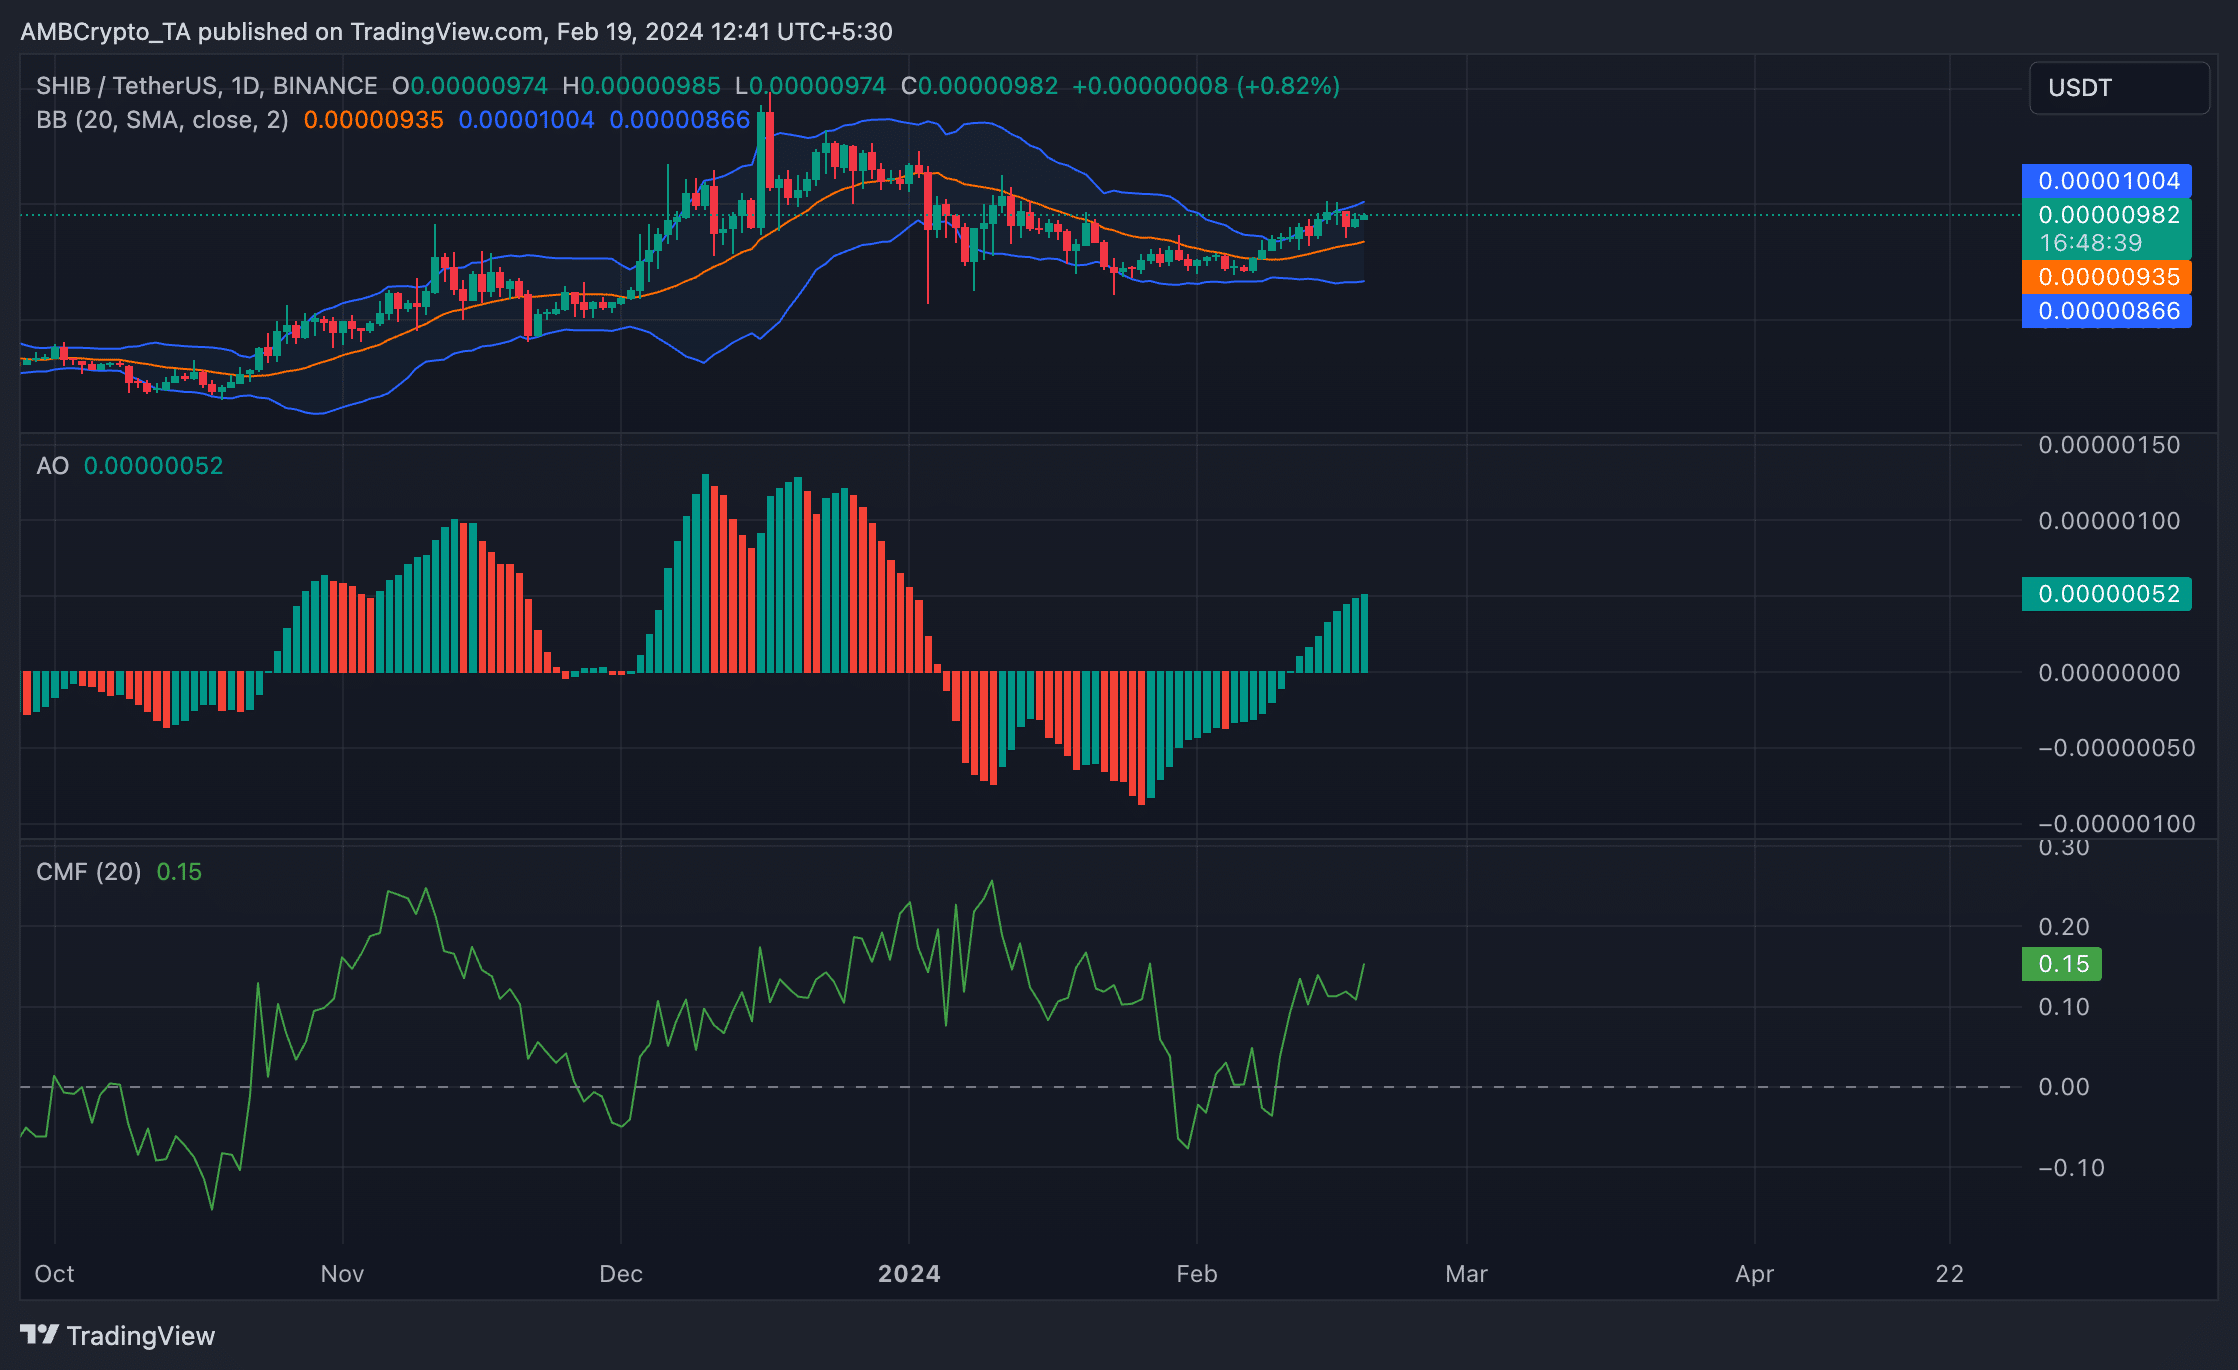
When this widens in this manner, it indicates that volatility is present in the market.