Short squeeze or bull trap? Cosmos crypto tests $1.50 resistance
While the short-term momentum appeared bullish, ATOM would likely struggle to clear the $1.50 supply zone.



Cosmos [ATOM] has rallied 8.3% over the past 24 hours, with a 91.9% surge in daily trading volume. The uptick in volume was accompanied by speculative interest, too, but there could be a warning sign in the short-term.
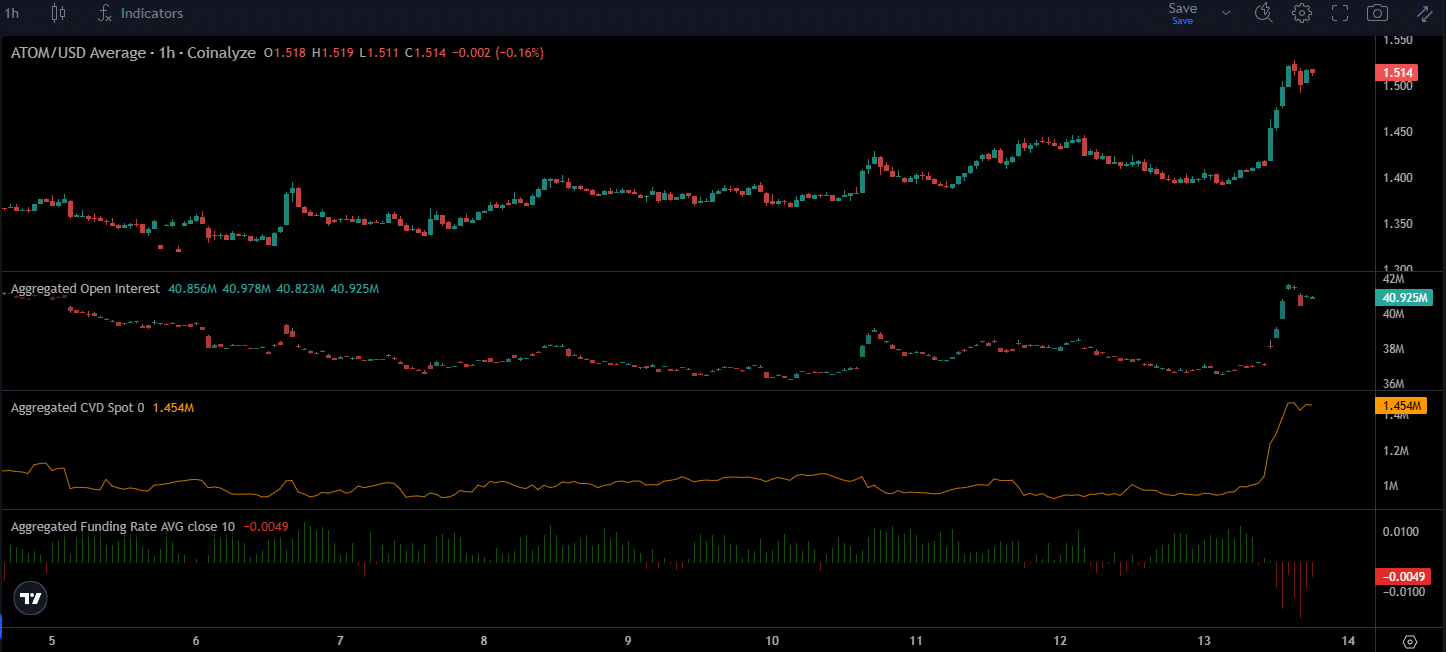
The Open Interest has climbed 11.3% in the past 24 hours. This signaled heavy speculative activity, and the spot demand was also high, as demonstrated by the uptick in trading volume as well as the spot CVD spike in recent hours.
However, the negative funding rate was a sobering thought for the bulls. The market was betting on a price reversal, and short positions were willing to pay a fee to keep their positions open.
Here’s what the price action has to say about the upcoming ATOM trends.
Bullish moving average crossover foretells bullish ATOM momentum
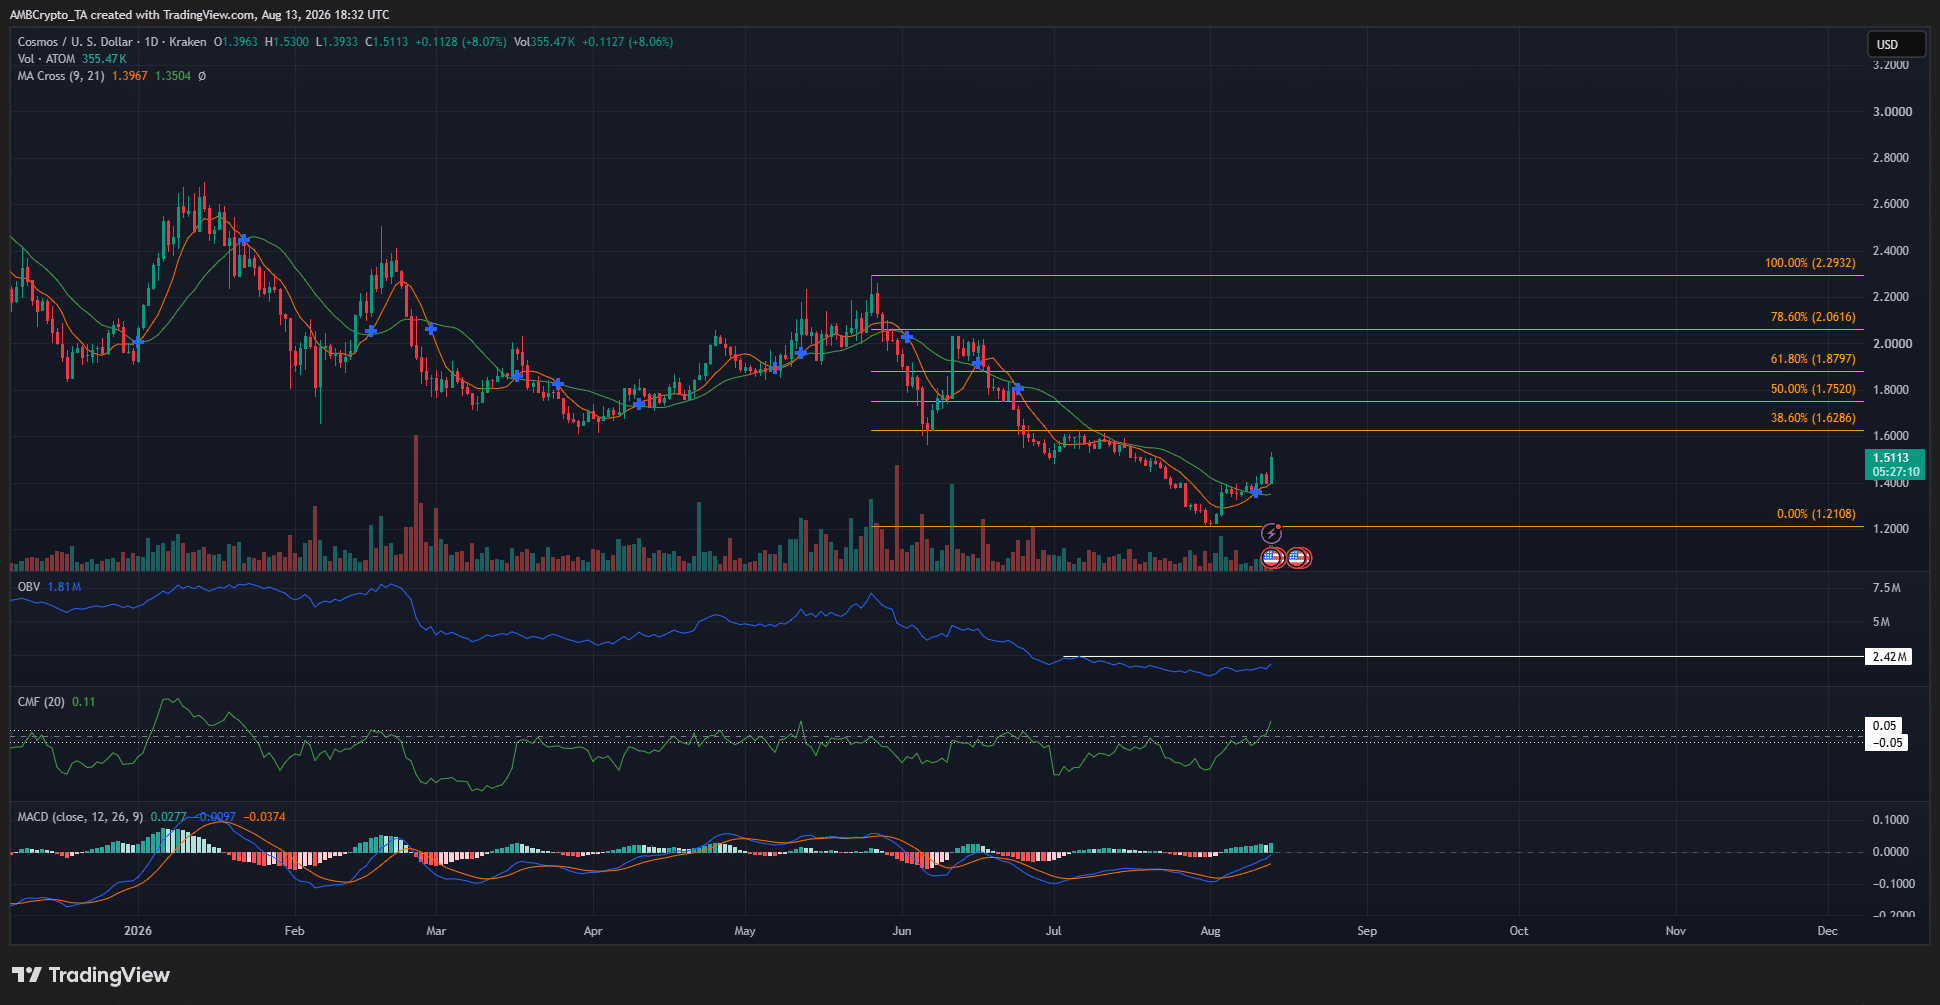
The swing move down from $2.29 to $1.21 began in late May. The structure was clearly bearish, but it does not rule out a short-term bounce.
At the time of writing, the moving averages formed a bullish crossover, and the Cosmos crypto price has also climbed above the averages.
The MACD was also climbing toward the zero line, showing weakening bearish momentum and a potential recovery higher.
While the MACD was unable to climb toward the early July highs, the CMF managed to break out past the +0.05 mark to signal strong capital inflows.
Despite the mixed signals on the daily timeframe, there was one warning sign to watch out for.
Traders’ call to action- Beware of a liquidity sweep
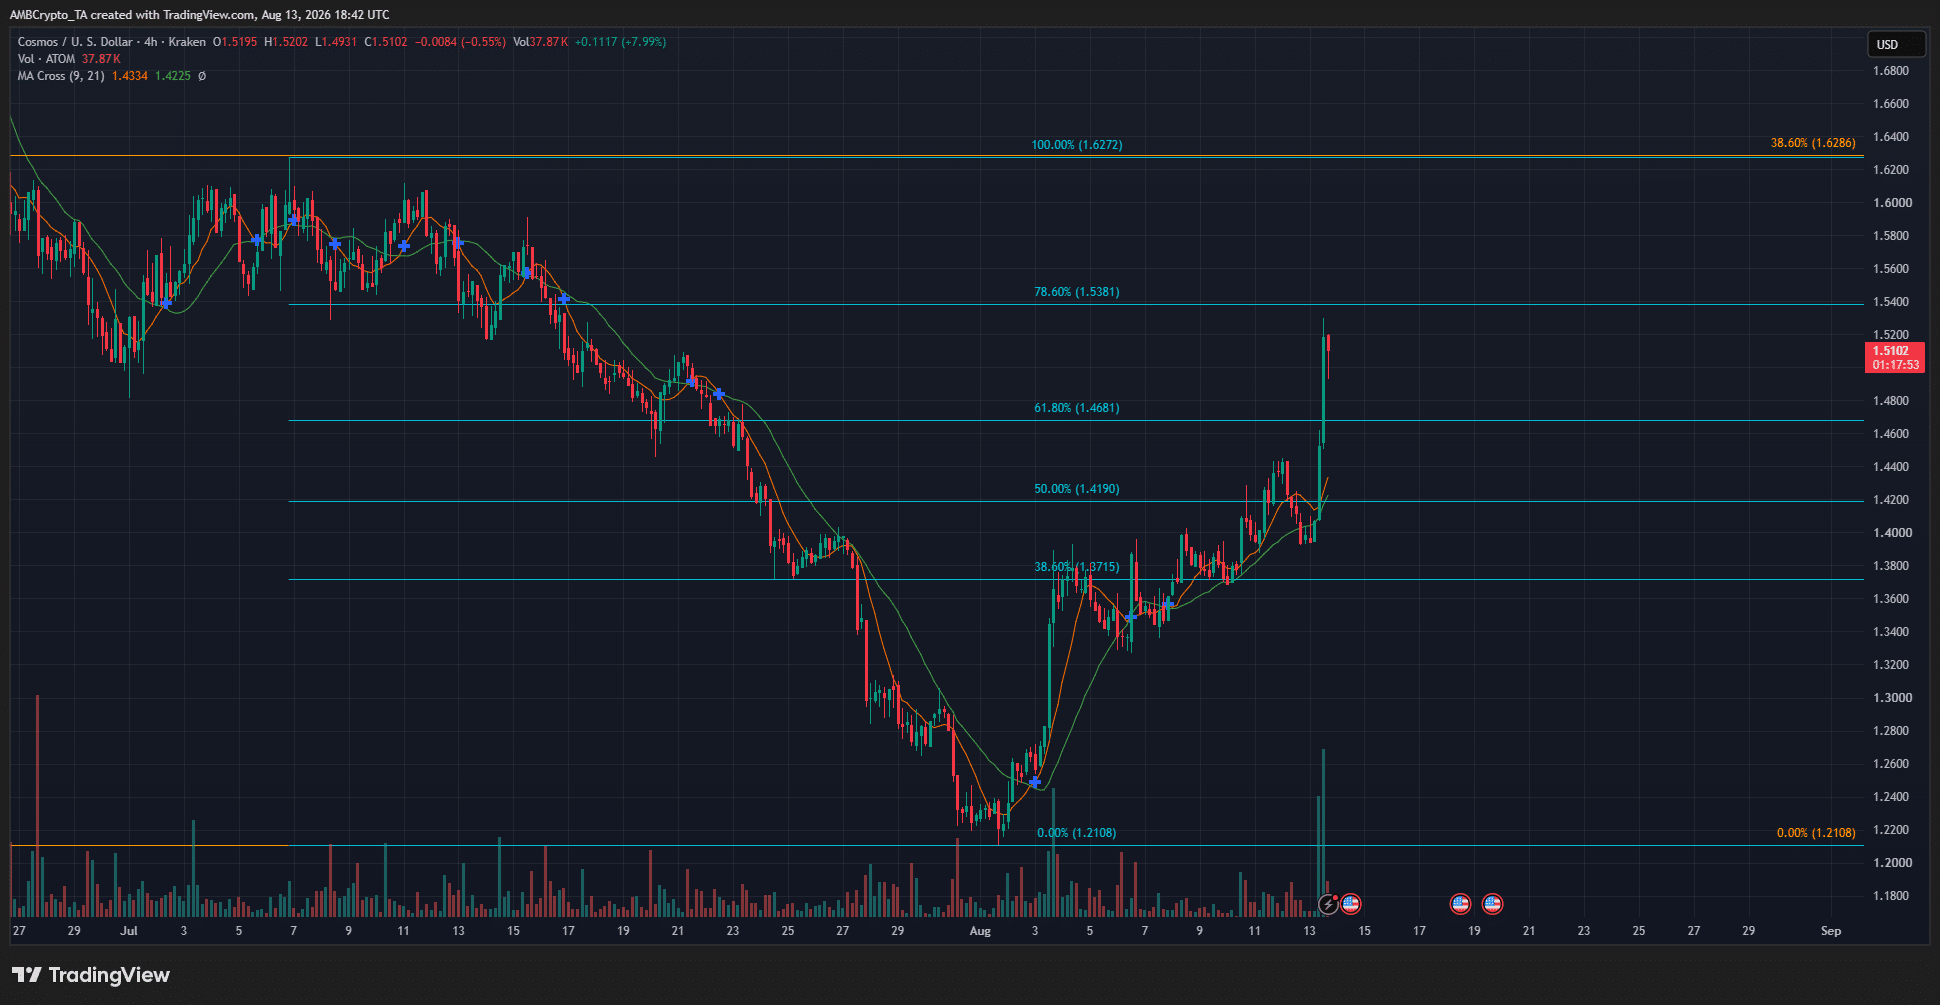
The 4-hour chart’s structure was also bearish. The Fibonacci retracement levels showed that the Cosmos crypto token was trading within the golden pocket between $1.46 and $1.53.
A rejection from the $1.50 resistance zone is expected, based on this structure.
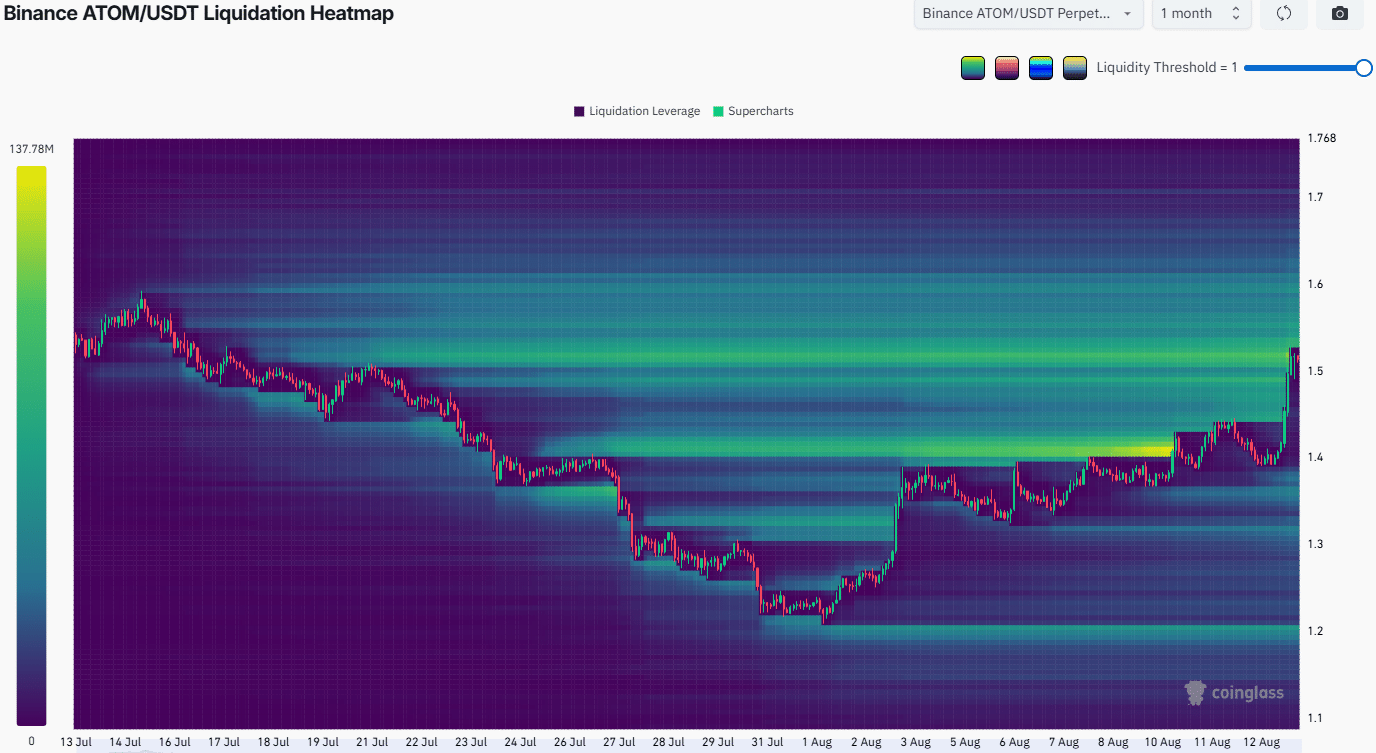
The 1-month liquidation heatmap also highlighted the cluster of short liquidations around the $1.50 area. The recent rally higher has swept this magnetic zone.
Based on the evidence at hand, a bearish trend continuation appeared likely. Sustained buying pressure and a rally past the $1.62 level is needed to signal a potential rally toward the psychological $2 resistance.
Final Summary
- The Cosmos crypto token has rallied by just over 8% in 24 hours, with a 91.3% daily trading volume spike and an 11% Open Interest surge.
- While the short-term momentum appeared bullish, ATOM would likely struggle to clear the $1.50 supply zone.