Bitcoin
Short-term BTC holders sell at loss: Time to accumulate?
With bearish sentiment surging, Bitcoin faces rising sell-offs by short-term investors. However, insights from SOPR and Realized Cap HODL Waves suggest…

- Key metrics reveal a deeper story behind BTC’s recent dip, highlighting both risks and potential opportunities for accumulation.
- As bearish sentiment grows, insights from HODL Waves and SOPR charts suggest this could be a pivotal moment for strategic investors.
Bitcoin’s[BTC] recent market trajectory has sparked widespread discussion, with its price dipping and bearish sentiment gaining momentum.
While short-term investors seem to be selling at a loss, historical data suggests this phase could be a potential buying opportunity.
This article explores the indicators shaping the market outlook, leveraging insights from the Realized Cap HODL Waves, Short-Term Holder SOPR, and BTC price charts.
Current Bitcoin market sentiment: Rising bearishness
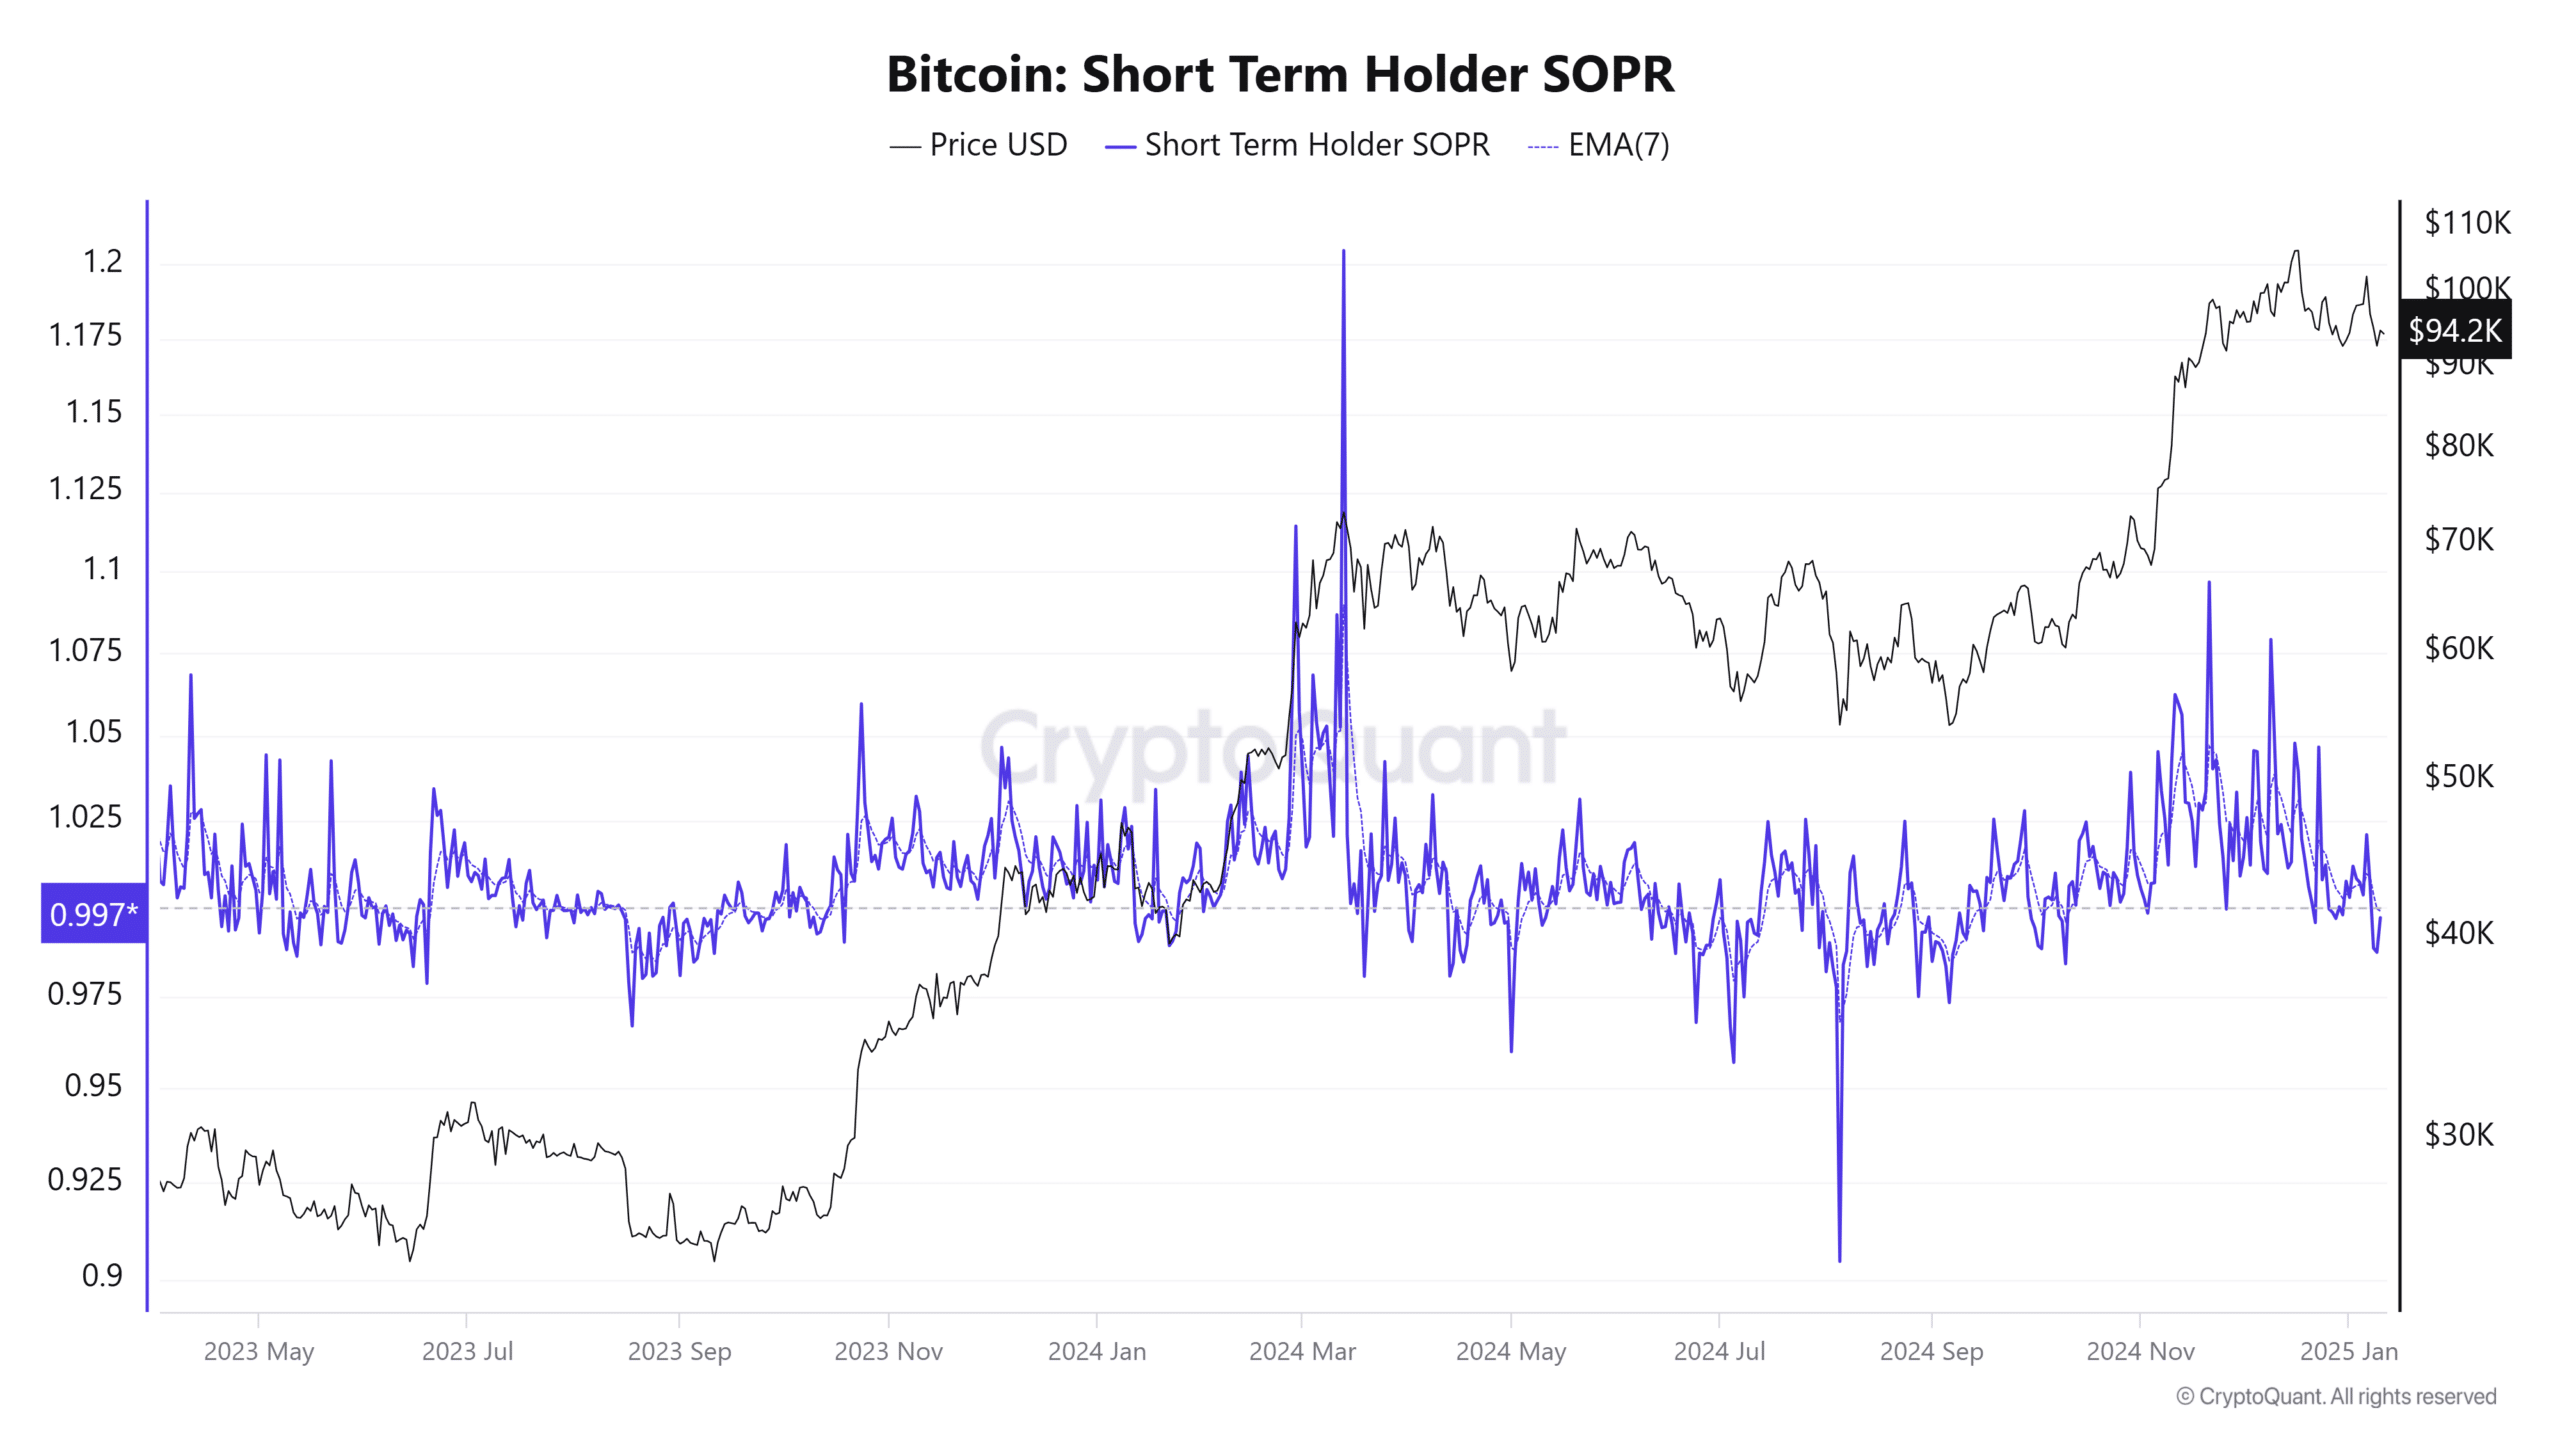
The crypto market’s mood has turned sour, as seen in the increased sell-offs by short-term investors. The Short-Term Holder SOPR Chart indicates a dip to 0.987, suggesting that many investors are selling Bitcoin
at a loss.Historically, SOPR values below 1.0 have often marked points of accumulation, where patient investors capitalize on discounted prices.
This bearish sentiment is further fueled by increasing social media negativity and panic-driven selling.
However, the SOPR chart’s historical trend highlights recovery patterns after such dips, implying that bearish phases often precede accumulation opportunities.
Distribution by mature investors and the role of new demand
The Realized Cap HODL Waves Chart reveals a significant shift in Bitcoin’s liquidity structure. Coins aged less than three months now account for 49.6% of network liquidity.
This signals that mature investors have distributed a significant portion of their holdings.
This trend indicates two things: seasoned investors are cashing out after the uptrend, and new demand is absorbing the sell-side pressure.
Historically, such redistributions often stabilize the market as fresh capital flows in. This provides a buffer against further downside, suggesting that the market is transitioning into a consolidation phase rather than a crash.
Short-term Bitcoin SOPR analysis: A historical perspective
The Short-Term Holder SOPR Chart offers insights into market sentiment. The current value of 0.987 reflects short-term holders selling at a loss, a pattern typically seen during periods of heightened fear.
Interestingly, historical trends show that SOPR values below 1.0 often signal market bottoms. This suggests that while panic dominates, seasoned investors may see this as an ideal accumulation period.
The Bitcoin SOPR chart highlights this cyclical behavior, showing how periods of loss have historically coincided with subsequent recovery phases.
Price action and key levels to watch
The BTC Price Chart provides critical insight into the current price dynamics. Bitcoin’s price is hovering around $94,330, below its 50-day moving average of $97,470 but comfortably above its 200-day Moving Average(MA) of $73,293.
This MA provides key resistance and support levels for traders.
The RSI at 45.93 indicates that Bitcoin is approaching oversold territory. Historically, an oversold RSI reading has been followed by price rebounds.
Traders should closely monitor the $95,000 resistance and $92,000 support levels for any directional breakout.
Is this a crash or a buying opportunity?
While the bearish sentiment and selling by short-term holders suggest caution, the underlying data points to resilience. The absorption of sell-side pressure by new investors, combined with SOPR’s historical precedent for recovery, indicates that this might not be a crash but a consolidation phase.
The Bitcoin Realized Cap HODL Waves and Short-Term SOPR charts, coupled with price levels, paint a mixed picture. Long-term investors might see this as a prime accumulation opportunity, while short-term traders need to remain vigilant for potential volatility.
– Read Bitcoin (BTC) Price Prediction 2025-26
The current Bitcoin market phase is a delicate balance of fear and opportunity. While sentiment leans bearish, data from SOPR and HODL Waves charts suggest a potential market recovery is on the horizon.
Investors must weigh these indicators against broader macroeconomic conditions and make informed decisions.


