
Disclaimer: The findings of the following analysis are the sole opinions of the writer and should not be taken as investment advice
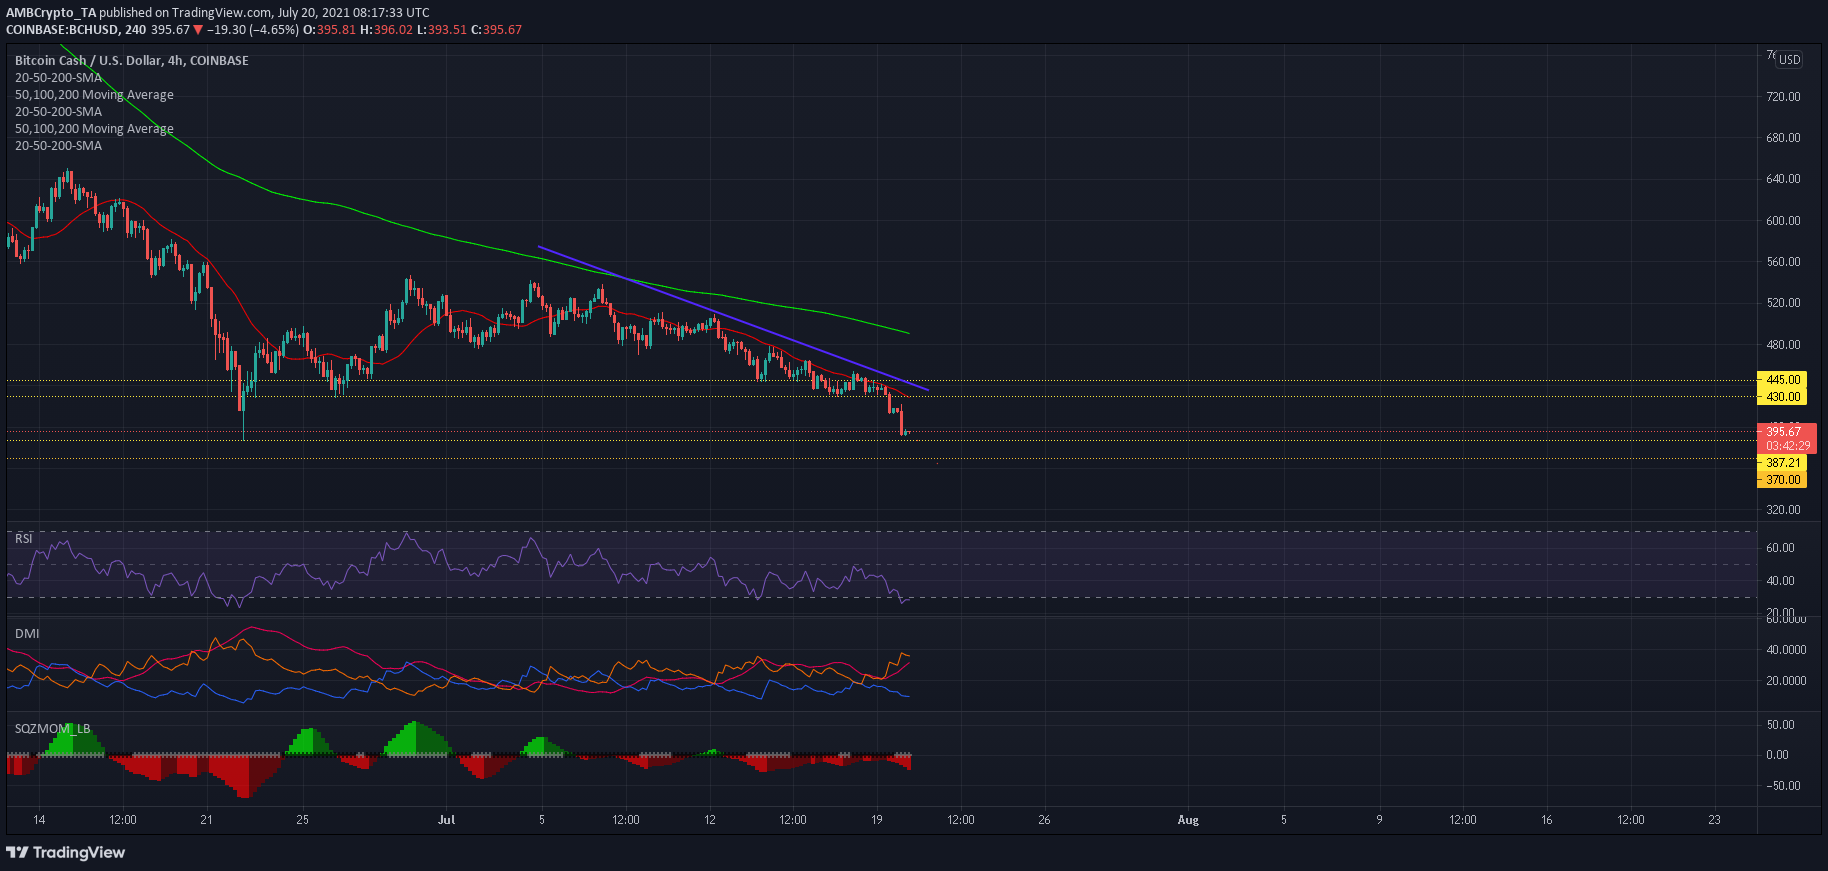
Bitcoin Cash, like most of its counterparts, has had a difficult July. Since the first week of the month, the price has been unable to hold its position above multiple support levels due to a lack of sustained buying pressure. Its most recent fall below the $430 support triggered another 10% decline towards its 22 June swing low of $387 and the threat of an extended sell-off loomed large.
At the time of writing, Bitcoin Cash held the 12th position on CMC’s charts with a market cap of $7.41 billion.
Bitcoin Cash 4-hour chart
Source: BCH/USD, TradingView
BCH’s upper sloping trendline extended from its 4th July high of $540 but denoted a steady fall in value of nearly 30% to a low of $391. Further south of the charts rested a defensive line of $387 – An area that cushioned BCH’s 40% plummet in late June. The support level could lead to a temporary uptick in price but a close below $387 would drag the digital asset to its next defensive zone around $370 which was last seen in late January.
Reasoning
The Relative Strength Index was heading into the oversold territory – A finding that could lead to some bullish resurgence. However, the reversal would most likely be temporary considering Bitcoin weakening below the $30,000-mark. The Directional Movement Index’s -DI drifted further away from the +DI as bearishness was on the up.
Moreover, the ADX was pointing north from 32 and meant that losses could amplify over the coming sessions as a result of increasing bearishness. The Squeeze Momentum Indicator confirmed a buildup of selling pressure and highlighted rising volatility as well.
Conclusion
BCH’s defensive line of $387 did trigger a rally in late June and a close eye must be kept on its indicators for a similar outcome. If the RSI reverses direction and bearish momentum diminishes on the SMI, the next few sessions could lead to some minor gains.
However, chances of a breakdown seemed higher and a close below $387 would lead to a retracement towards $370 – A level last seen in late January. Traders can capitalize on this move and short BCH once a move below its press time support level is confirmed.
![Why Chainlink [LINK] and Polygon [MATIC] are more similar than you realise](https://ambcrypto.com/wp-content/uploads/2024/04/Chainlink_and_Polygon-1-400x240.webp)