Should you sell Bitcoin [BTC]? Here’s what its recovery prospects are like

Disclaimer: The findings of the following analysis are the sole opinions of the writer and should not be considered investment advice.
After an expected rectangle bottom breakdown, Bitcoin [BTC] lost the vital $28K support while finding resting grounds near $19.2K. While the recent movements affirmed a sideways market, sellers have kept the coin below the daily EMA ribbons.
Paying heed to a host of barriers at the $21K level, BTC could continue its lagging squeeze in the coming days. A close below the current pattern would open doorways for potential shorting opportunities.
At press time, BTC was trading at $20,423, up by 1.97% in the last 24 hours.
BTC Daily Chart

Maintaining a conservative standpoint, BTC could see a continued tight phase in the $19.2K-$21K range in the coming sessions. Over the last three weeks, the king coin has formed a bearish pennant-like setup in the daily timeframe. However, the coin has been struggling to break the chains of its 20 EMA for nearly a month now.
As the upper trendline of the pennant coincided with the 20 EMA level, the $21K level could impede buying efforts. Meanwhile, the price action squeezed within the pennant while preparing for a likely volatile move.
Any close below the pattern would make room for a shorting opportunity. In this case, the take-profit levels would lie in the $17.1K zone. But if the BTC HODLers are keen on protecting the $18.9K-$19.2K range, the coin would see an extended sideways market.
In an unlikely case of a bearish invalidation, a close above the pattern could aid the buyers in retesting the three-month trendline resistance (white, dashed).
Rationale
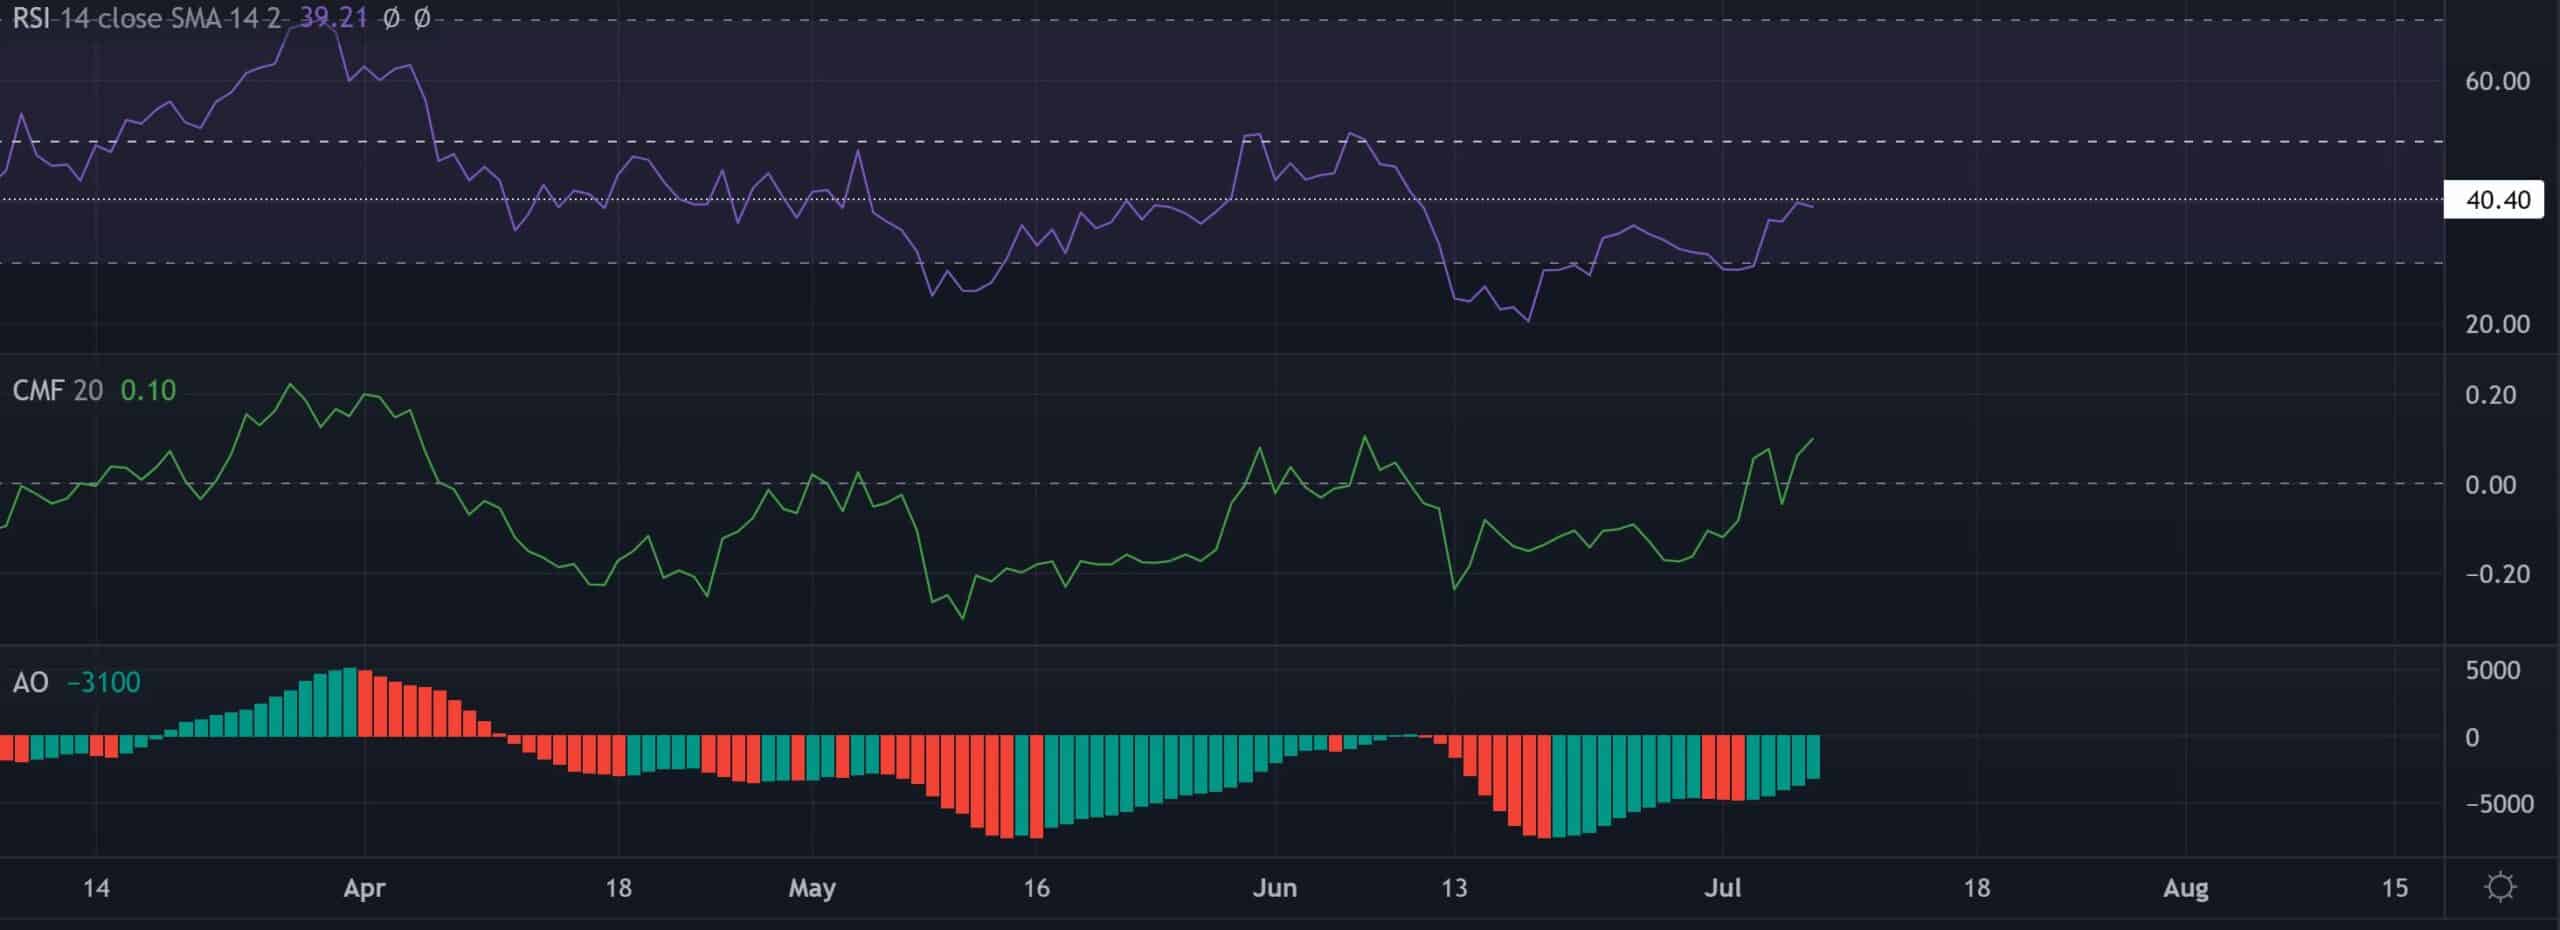
The Relative Strength Index (RSI)’s position below the midline has resonated with the bearish narrative for the three months. A close above the 40-mark could help buyers delay the bearish moves.
With the Chaikin Money Flow (CMF) witnessing a steep growth, buyers inflicted an uptick in the money volumes. But its recent peaks have bearishly diverged with the price action. Also, the Awesome Oscillator (AO) despite showing slight improvements needed to find a close above the zero-line to reveal a bullish edge.
Conclusion
In light of the bearish pennant approaching the EMA resistances, BTC could see a near-term setback on the charts. A confirmed break below the pattern and the $18.9K-mark would reaffirm the targets mentioned above.
Further, investors/traders should factor in the macro-economical factors affecting the broader sentiment. This analysis will help them to increase the chances of a profitable bet.