SIREN crashes 55% as pump-and-dump claims erupt – Is recovery possible?
Here's what caused the price of SIREN to crash more than 90% in two days.

siren [SIREN] plunged more than 55% over the past 24 hours, with its market cap collapsing to $40.78 million.
At its peak, the memecoin was valued at $2.77 billion. Daily trading volume reached roughly $194 million, nearly five times its market cap.
Despite the crash, SIREN still had around 62,050 holders at press time. This left traders questioning whether the token was facing a temporary collapse or something more serious.
Uncovering SIREN’s textbook pump-and-dump scheme
Allegations that SIREN followed a pump-and-dump pattern gained traction after fresh on-chain findings emerged.
According to the data, a wallet linked to the token’s price action sold more than 95% of the total supply. The wallet offloaded roughly 670 million SIREN across Bybit, Bitget, Binance, KuCoin, and Gate.
That selling coincided with a drop from about $1.30 to $0.05, wiping out more than 90% of the token’s value. The wallet subsequently received over $64 million in USDT and transferred roughly $26 million to other addresses.
Such activity may indicate an effort to disperse funds across multiple wallets, making tracking more difficult.
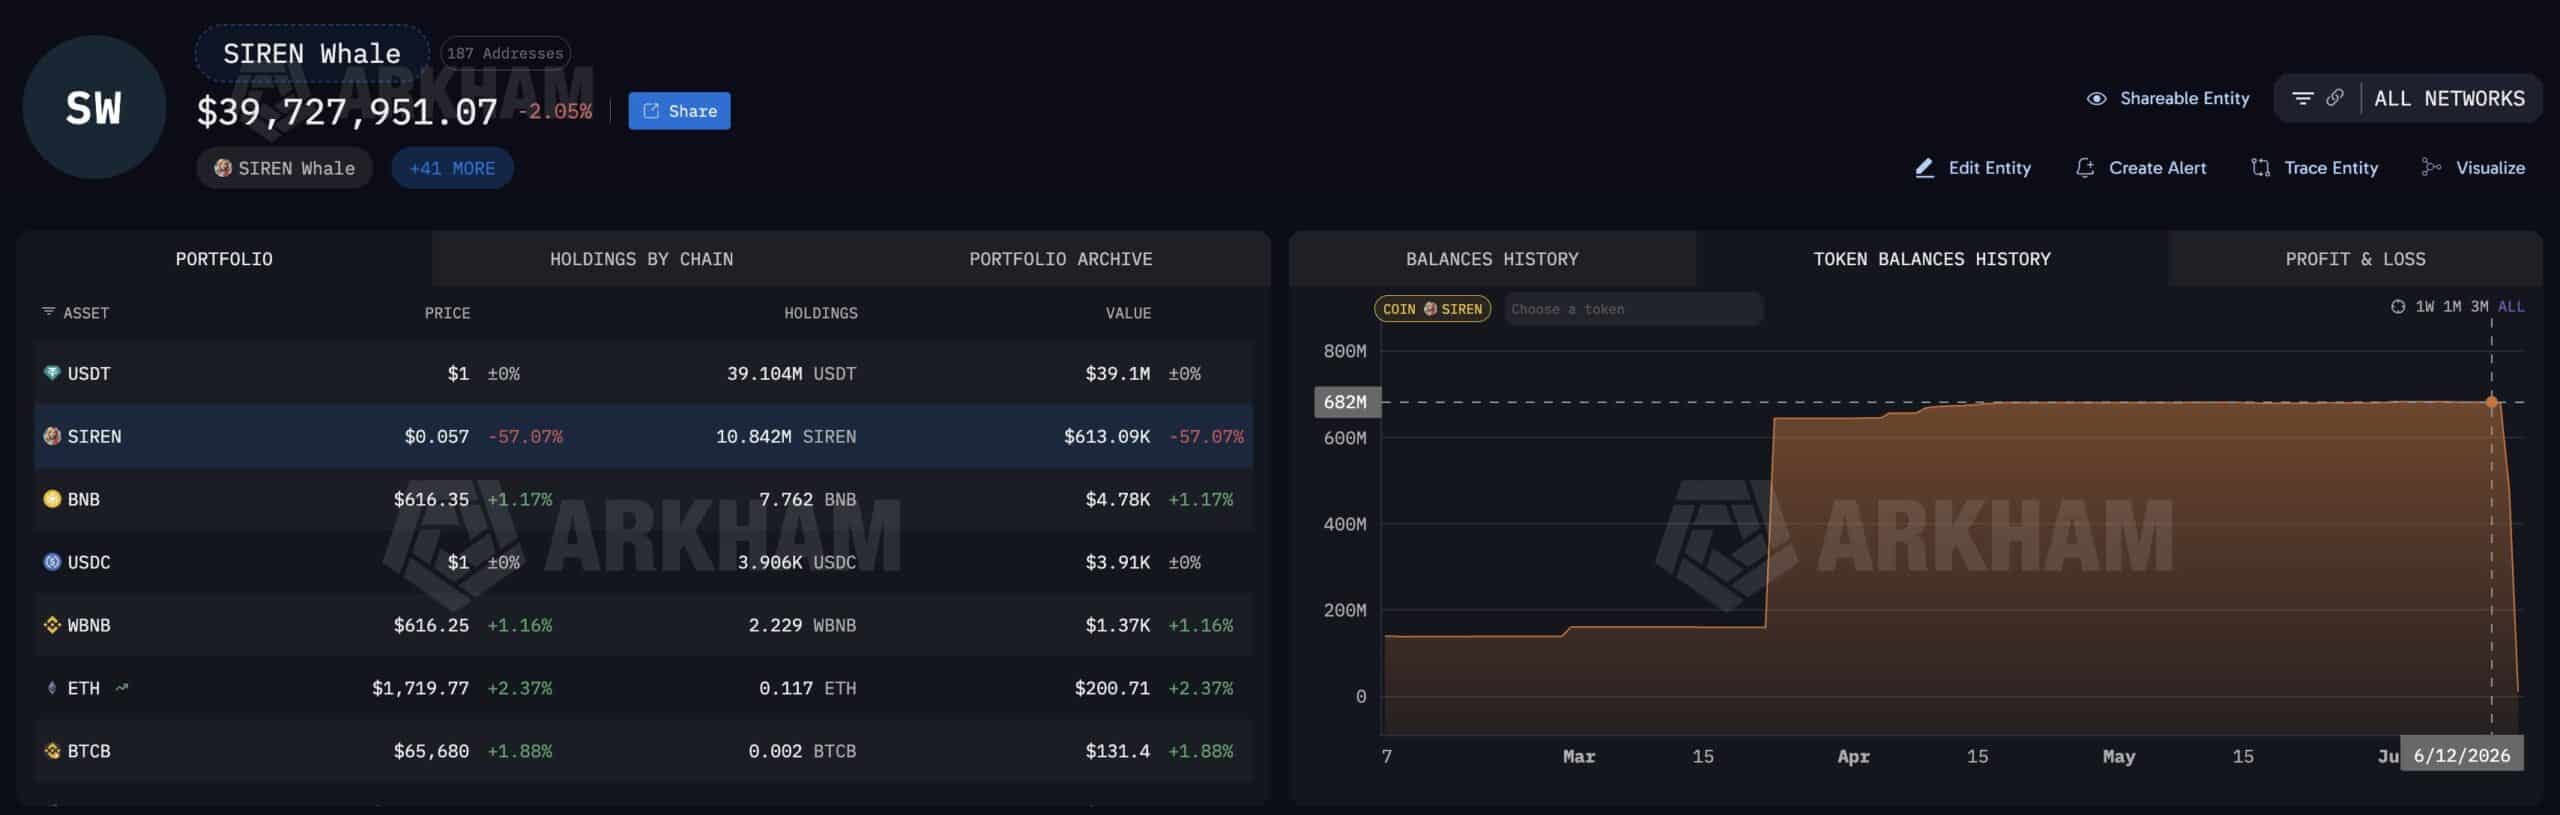
Even so, about $39 million remained on-chain. This left traders focused on whether the funds could be used in another market-moving event.
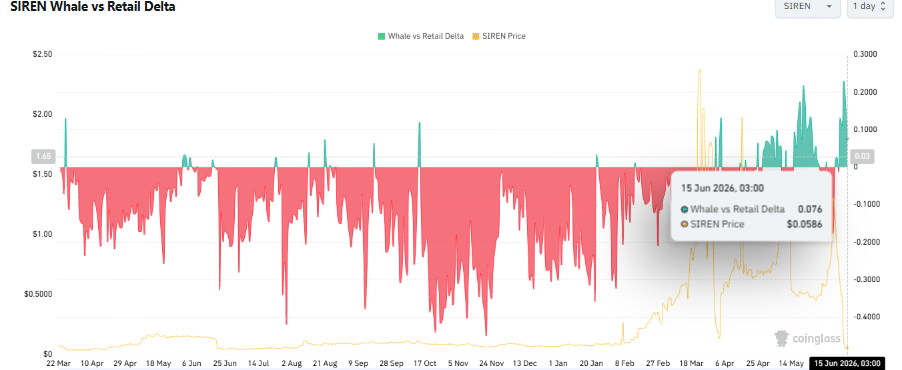
On top of that, whale participation also weakened.
The Whale vs. Retail Delta fell from 0.23 to 0.076, signaling a sharp decline in large-holder positioning.
Is SIREN price action dead?
The sell-off pushed SIREN from $1.30 to $0.05, erasing roughly 97% of its market value.
Before the collapse, the token had rallied from $0.44 to $1.30, a move that now resembles a possible exit pump. Having said that, liquidity had not completely disappeared.
The liquidity-to-market-cap ratio stood at 7.96%, suggesting trading activity remained present despite the decline. The Bollinger Bands continued widening, highlighting elevated volatility across the market.
Moreover, the Accumulation/Distribution indicator dropped to negative 7.13 billion.
That reading suggested distribution dominated trading activity and aligned with the large-scale selling observed on-chain.
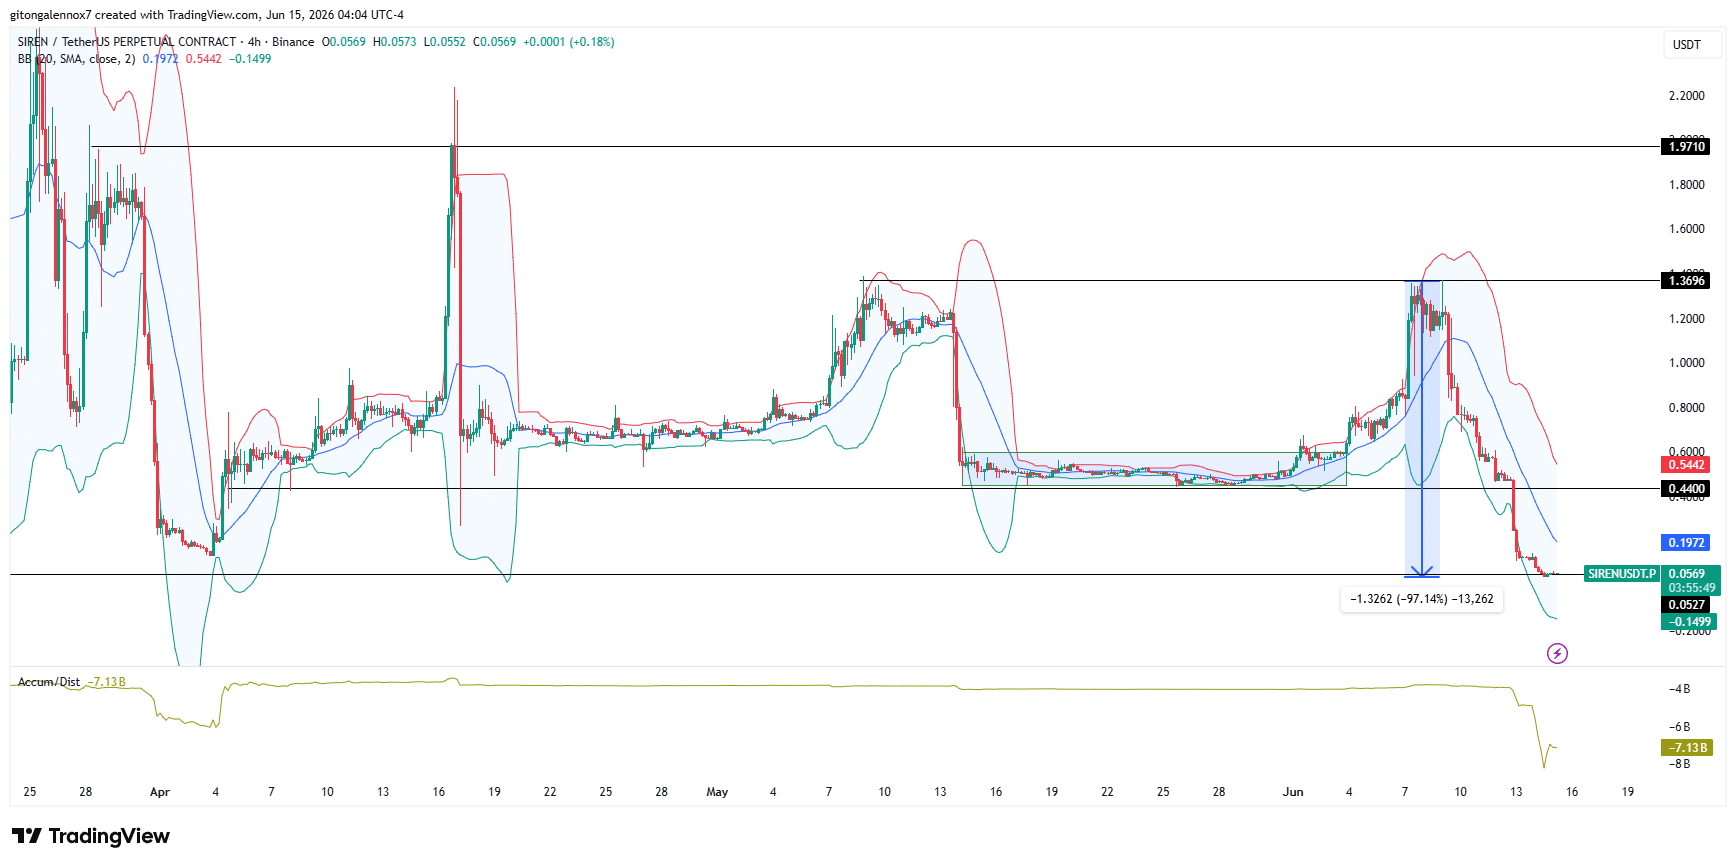
At press time, SIREN traded near its all-time low of $0.05. Notably, that same region previously preceded rallies toward $2.77 and $1.97.
If buying interest returns and the selling pressure subsides, a rebound could emerge from current levels.
However, if further manipulation or liquidity withdrawals occur, the token could remain under pressure and lose trading relevance altogether.