Solana
SOL to $250? Here’s why Solana might hit this milestone next!
Solana successfully broke above a bullish pattern and retested its support, which could push the token to $250 in the long run.
- Solana bears stepped up in the last 24 hours as its daily chart turned red.
- If a bull rally happens, then SOL might first target $188.
After a week-long price increase, Solana [SOL] has recently witnessed a minor price correction. But the scenario might change soon as the token has successfully retested a bull pattern.
This episode meant that the token might soon initiate yet another bull run, which could push the token to new highs.
Solana’s bullish move
According to CoinMarketCap, SOL’s price increased by over 6% in the last seven days. However, the last 24 hours were somewhat of a setback as the token’s value plunged by 0.83%.
The recent price decline had a negative impact on its weighted sentiment on the 27th of July, which suggested that bearish sentiment around the token increased.
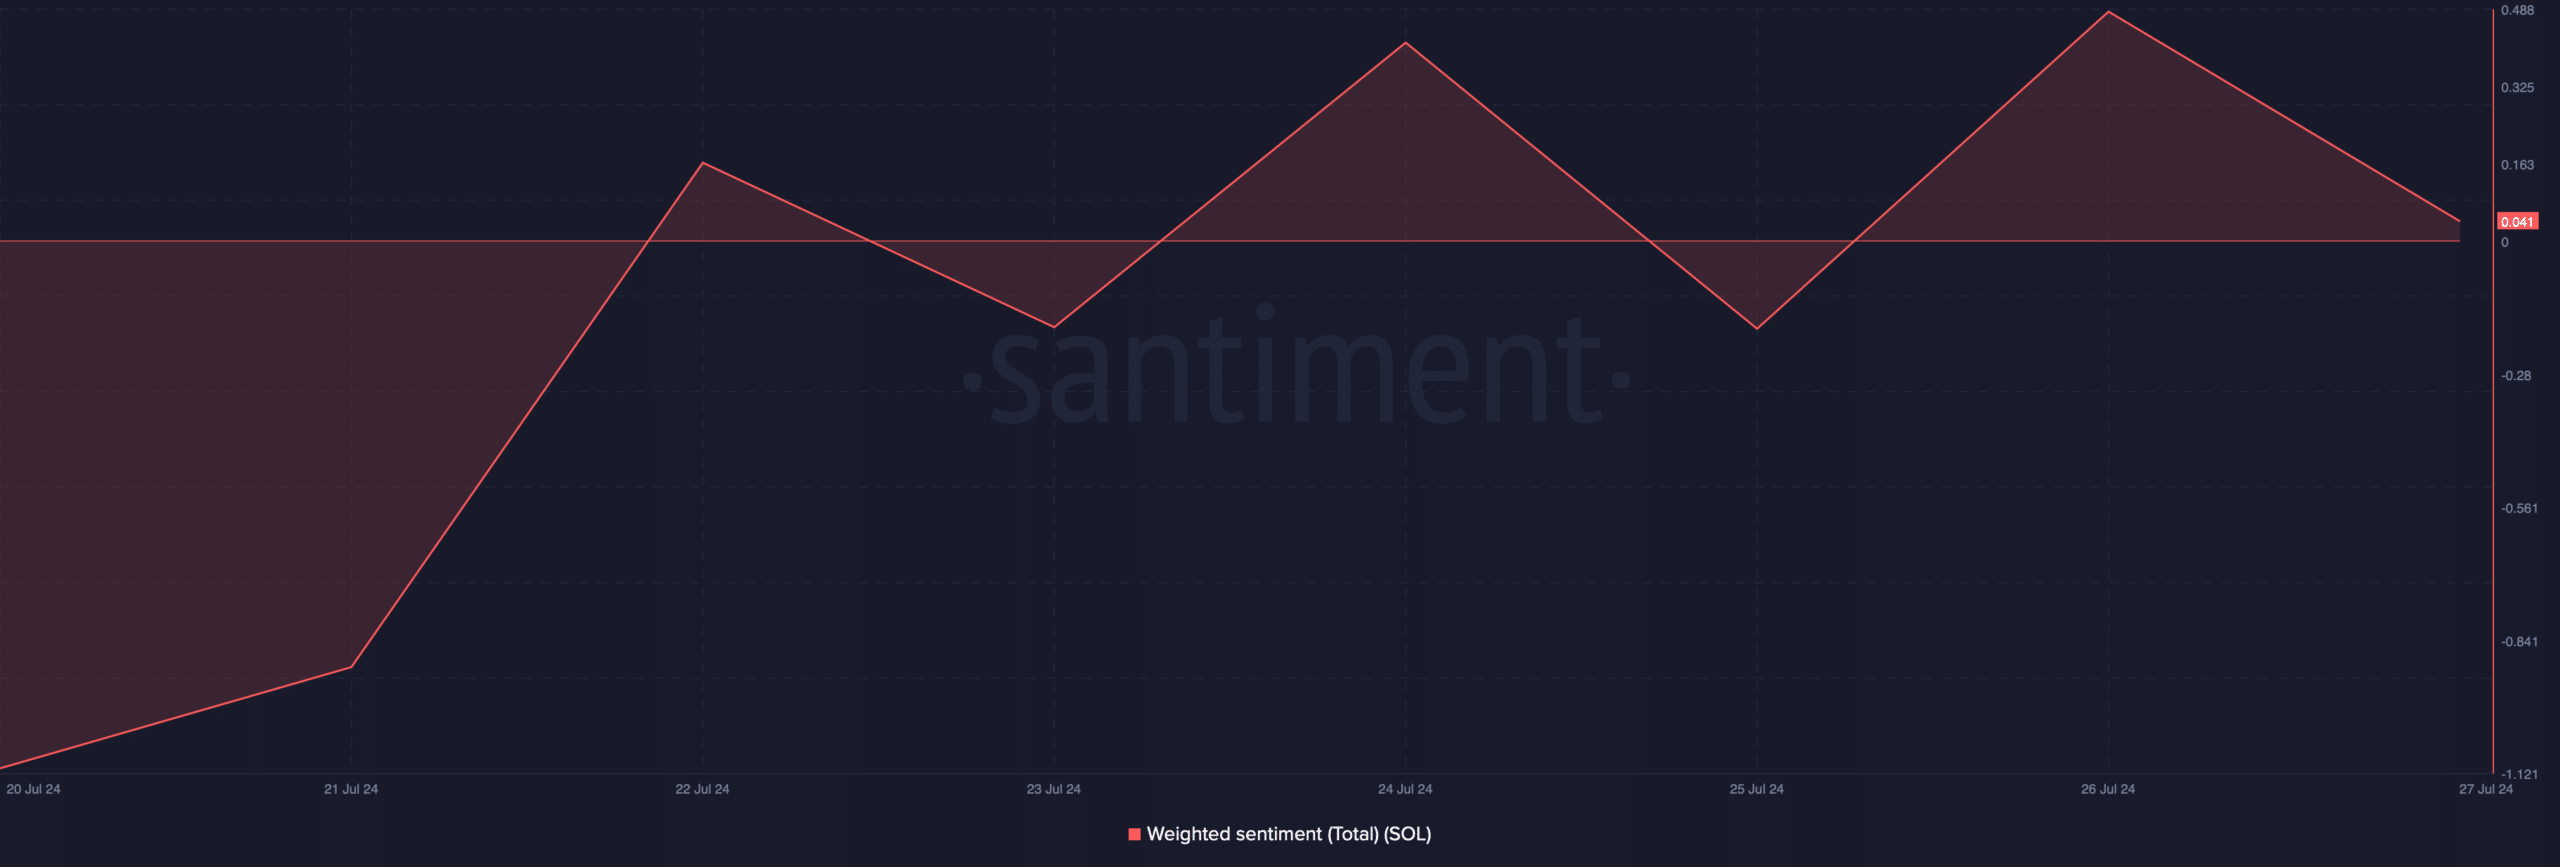
Source: Santiment
However, this might not actually be the beginning of a bear rally, as SOL recently broke above a bull pattern.
World Of Charts, a popular crypto analyst, recently posted a tweet highlighting the fact that SOL broke above the bullish pennant pattern and also retested its support.
To clear the air, a bullish pennant pattern appeared in March, and since then Solana’s price has been consolidating inside the pattern, only to break out a few days ago.
The tweet also mentioned that the recent retest of the support could begin a bull rally that could push Solana to $250, a new all-time high.
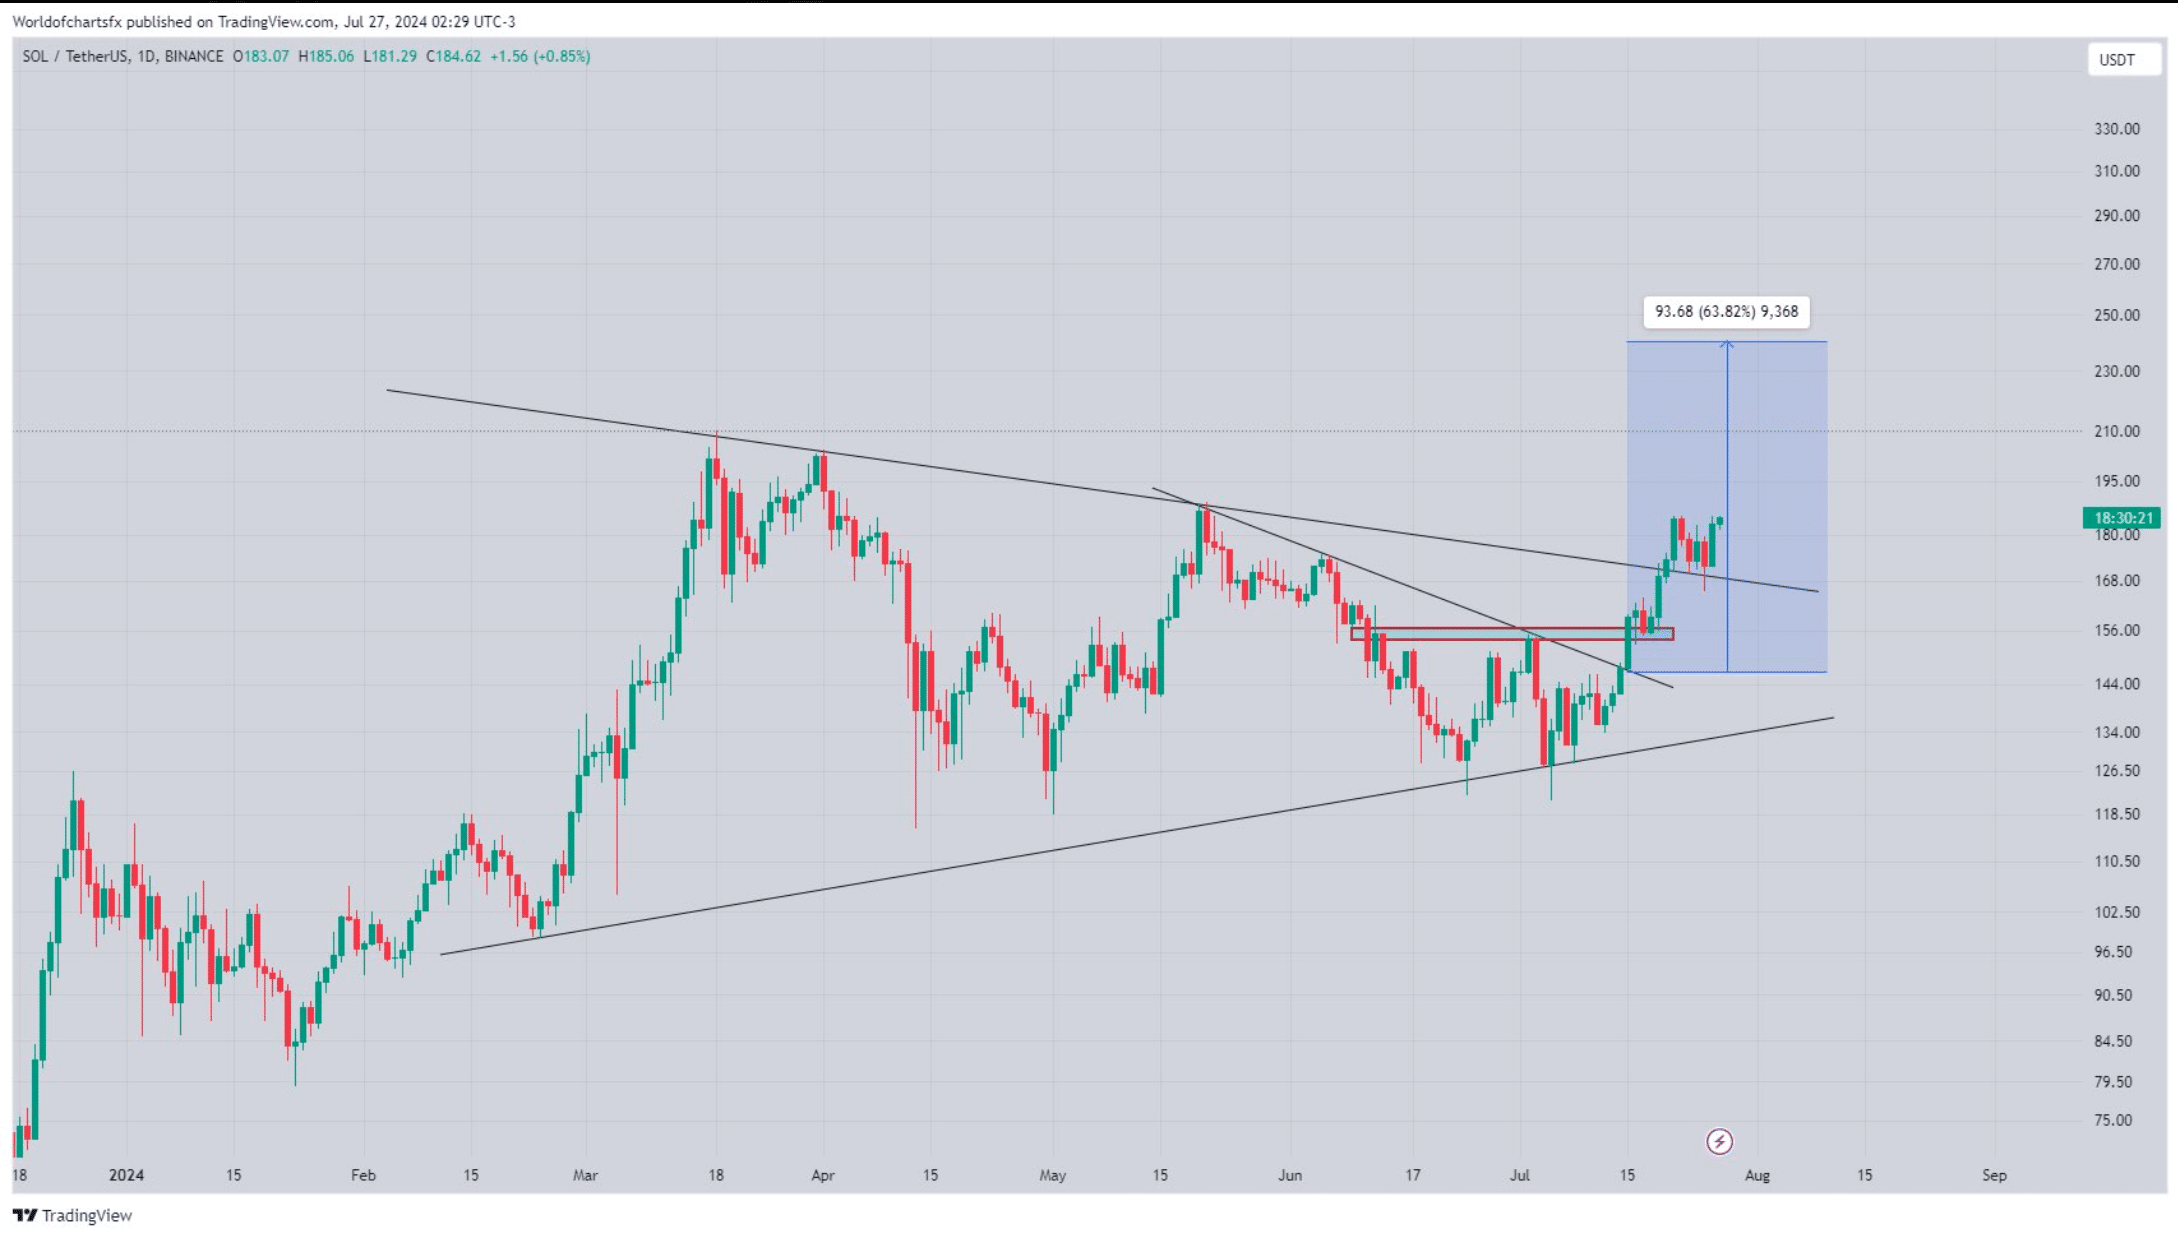
Source: X
Is SOL to $250 likely?
Since the target of reaching $250 seemed a bit ambitious in the short term, AMBCrypto planned to delve deeper into SOL’s state to see what to expect from it.
As per our analysis of Coinglass’ data, SOL’s long/short ratio registered an increase after a dip. A decline in the metrics means that there were more long positions in the market than short positions, which is considered a bullish signal.
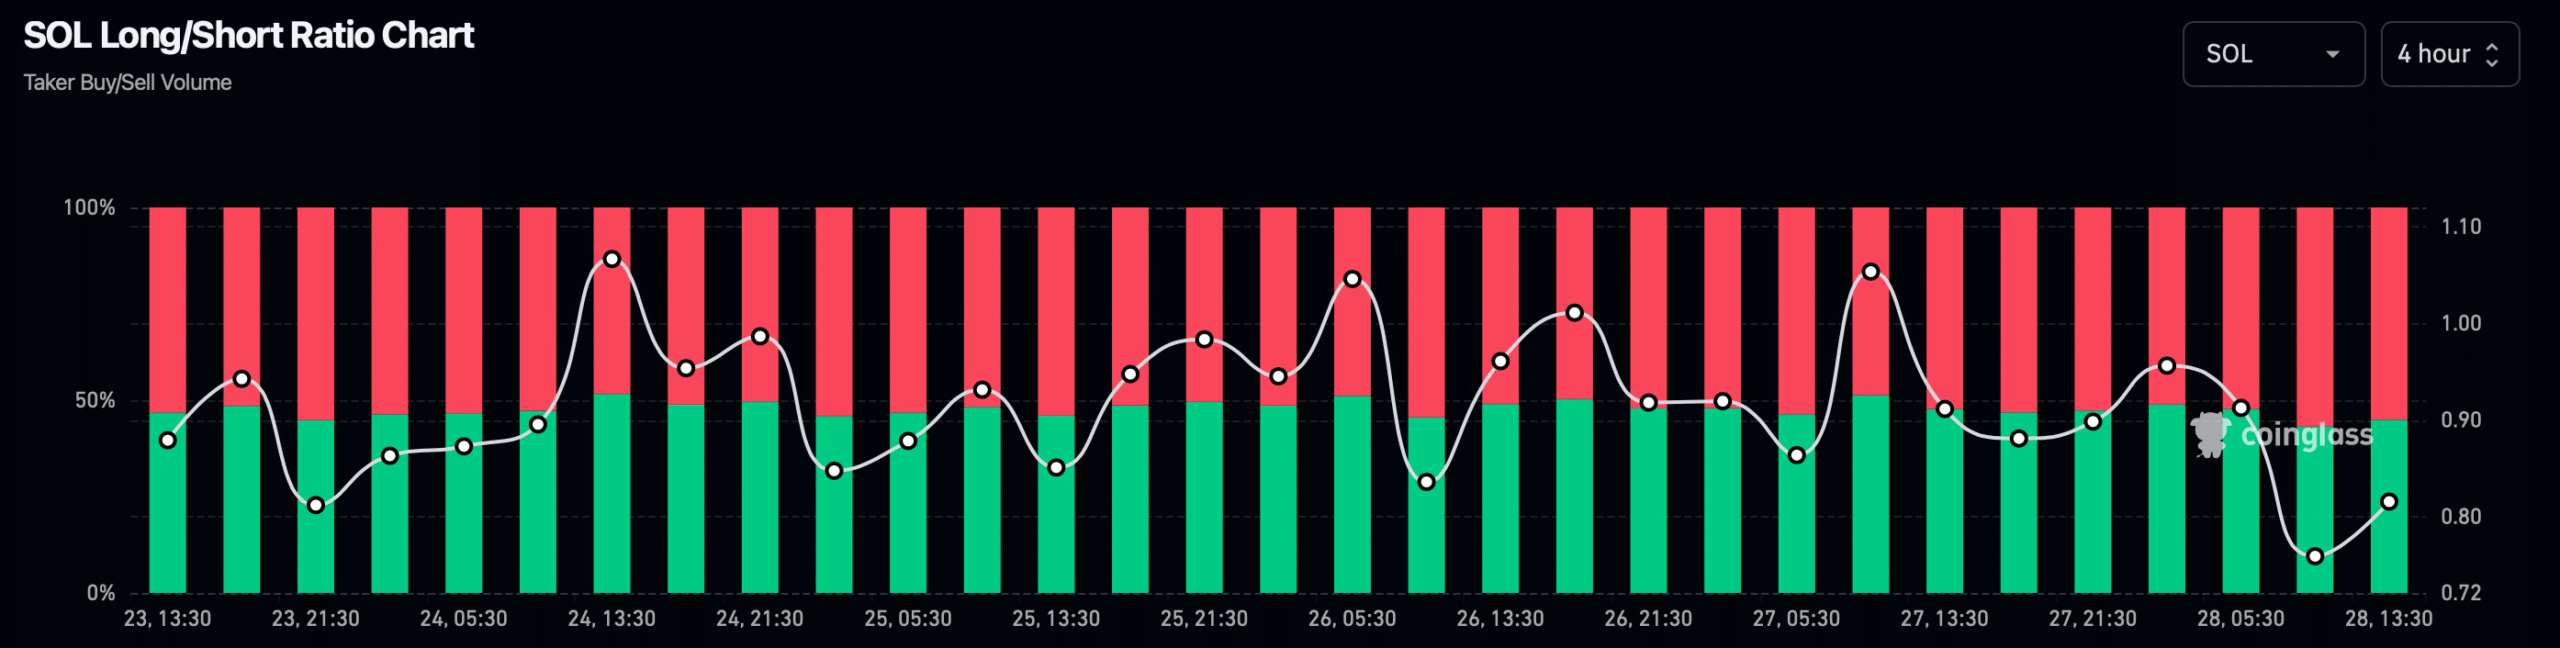
Source: Coinglass
We then checked the token’s daily chart to find whether it could actually begin a bull rally in the near term. As per our analysis, SOL’s Chaikin Money Flow (CMF) registered a downtick, as did its Relative Strength Index (RSI).
Both of these technical indicators hinted at a continued price decline. Moreover, the MACD also displayed the possibility of a bearish crossover.
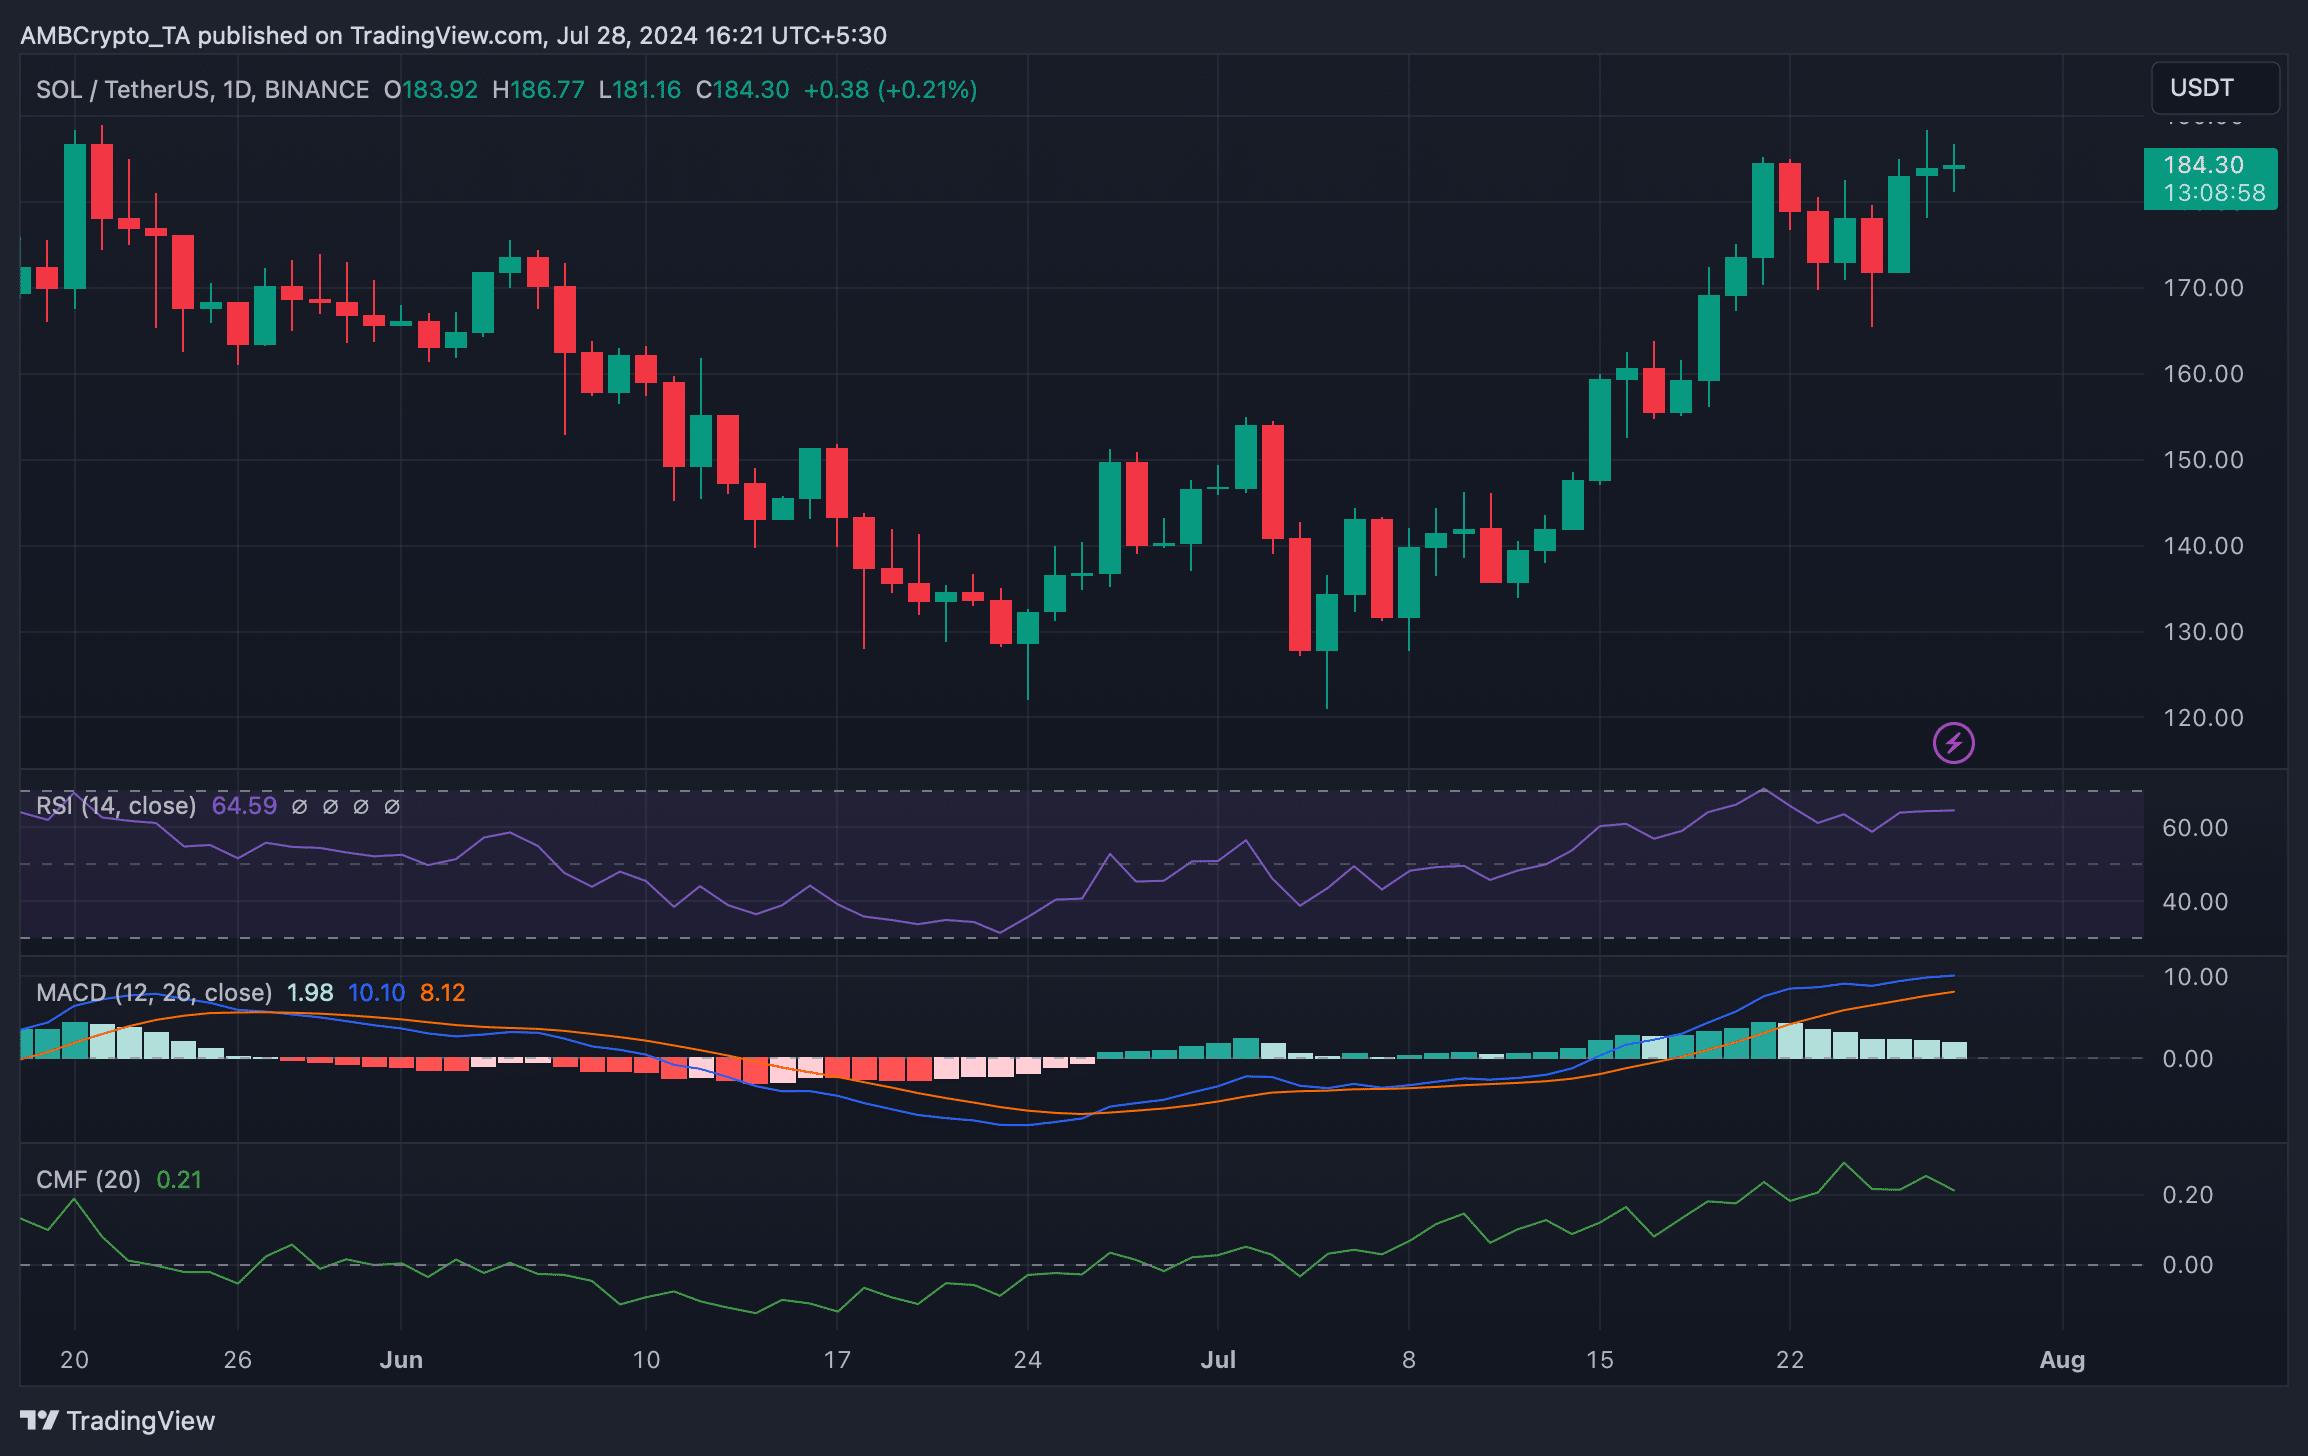
Source: TradingView
Realistic or not, here’s SOL’s market cap in BTC’s terms
In case of a bullish takeover of the market, then Solana might touch $188 once again before it sets its eyes on the $250 mark.
However, if the bears continue to dominate, as suggested by the market indicators, investors might witness SOL dropping to $176.
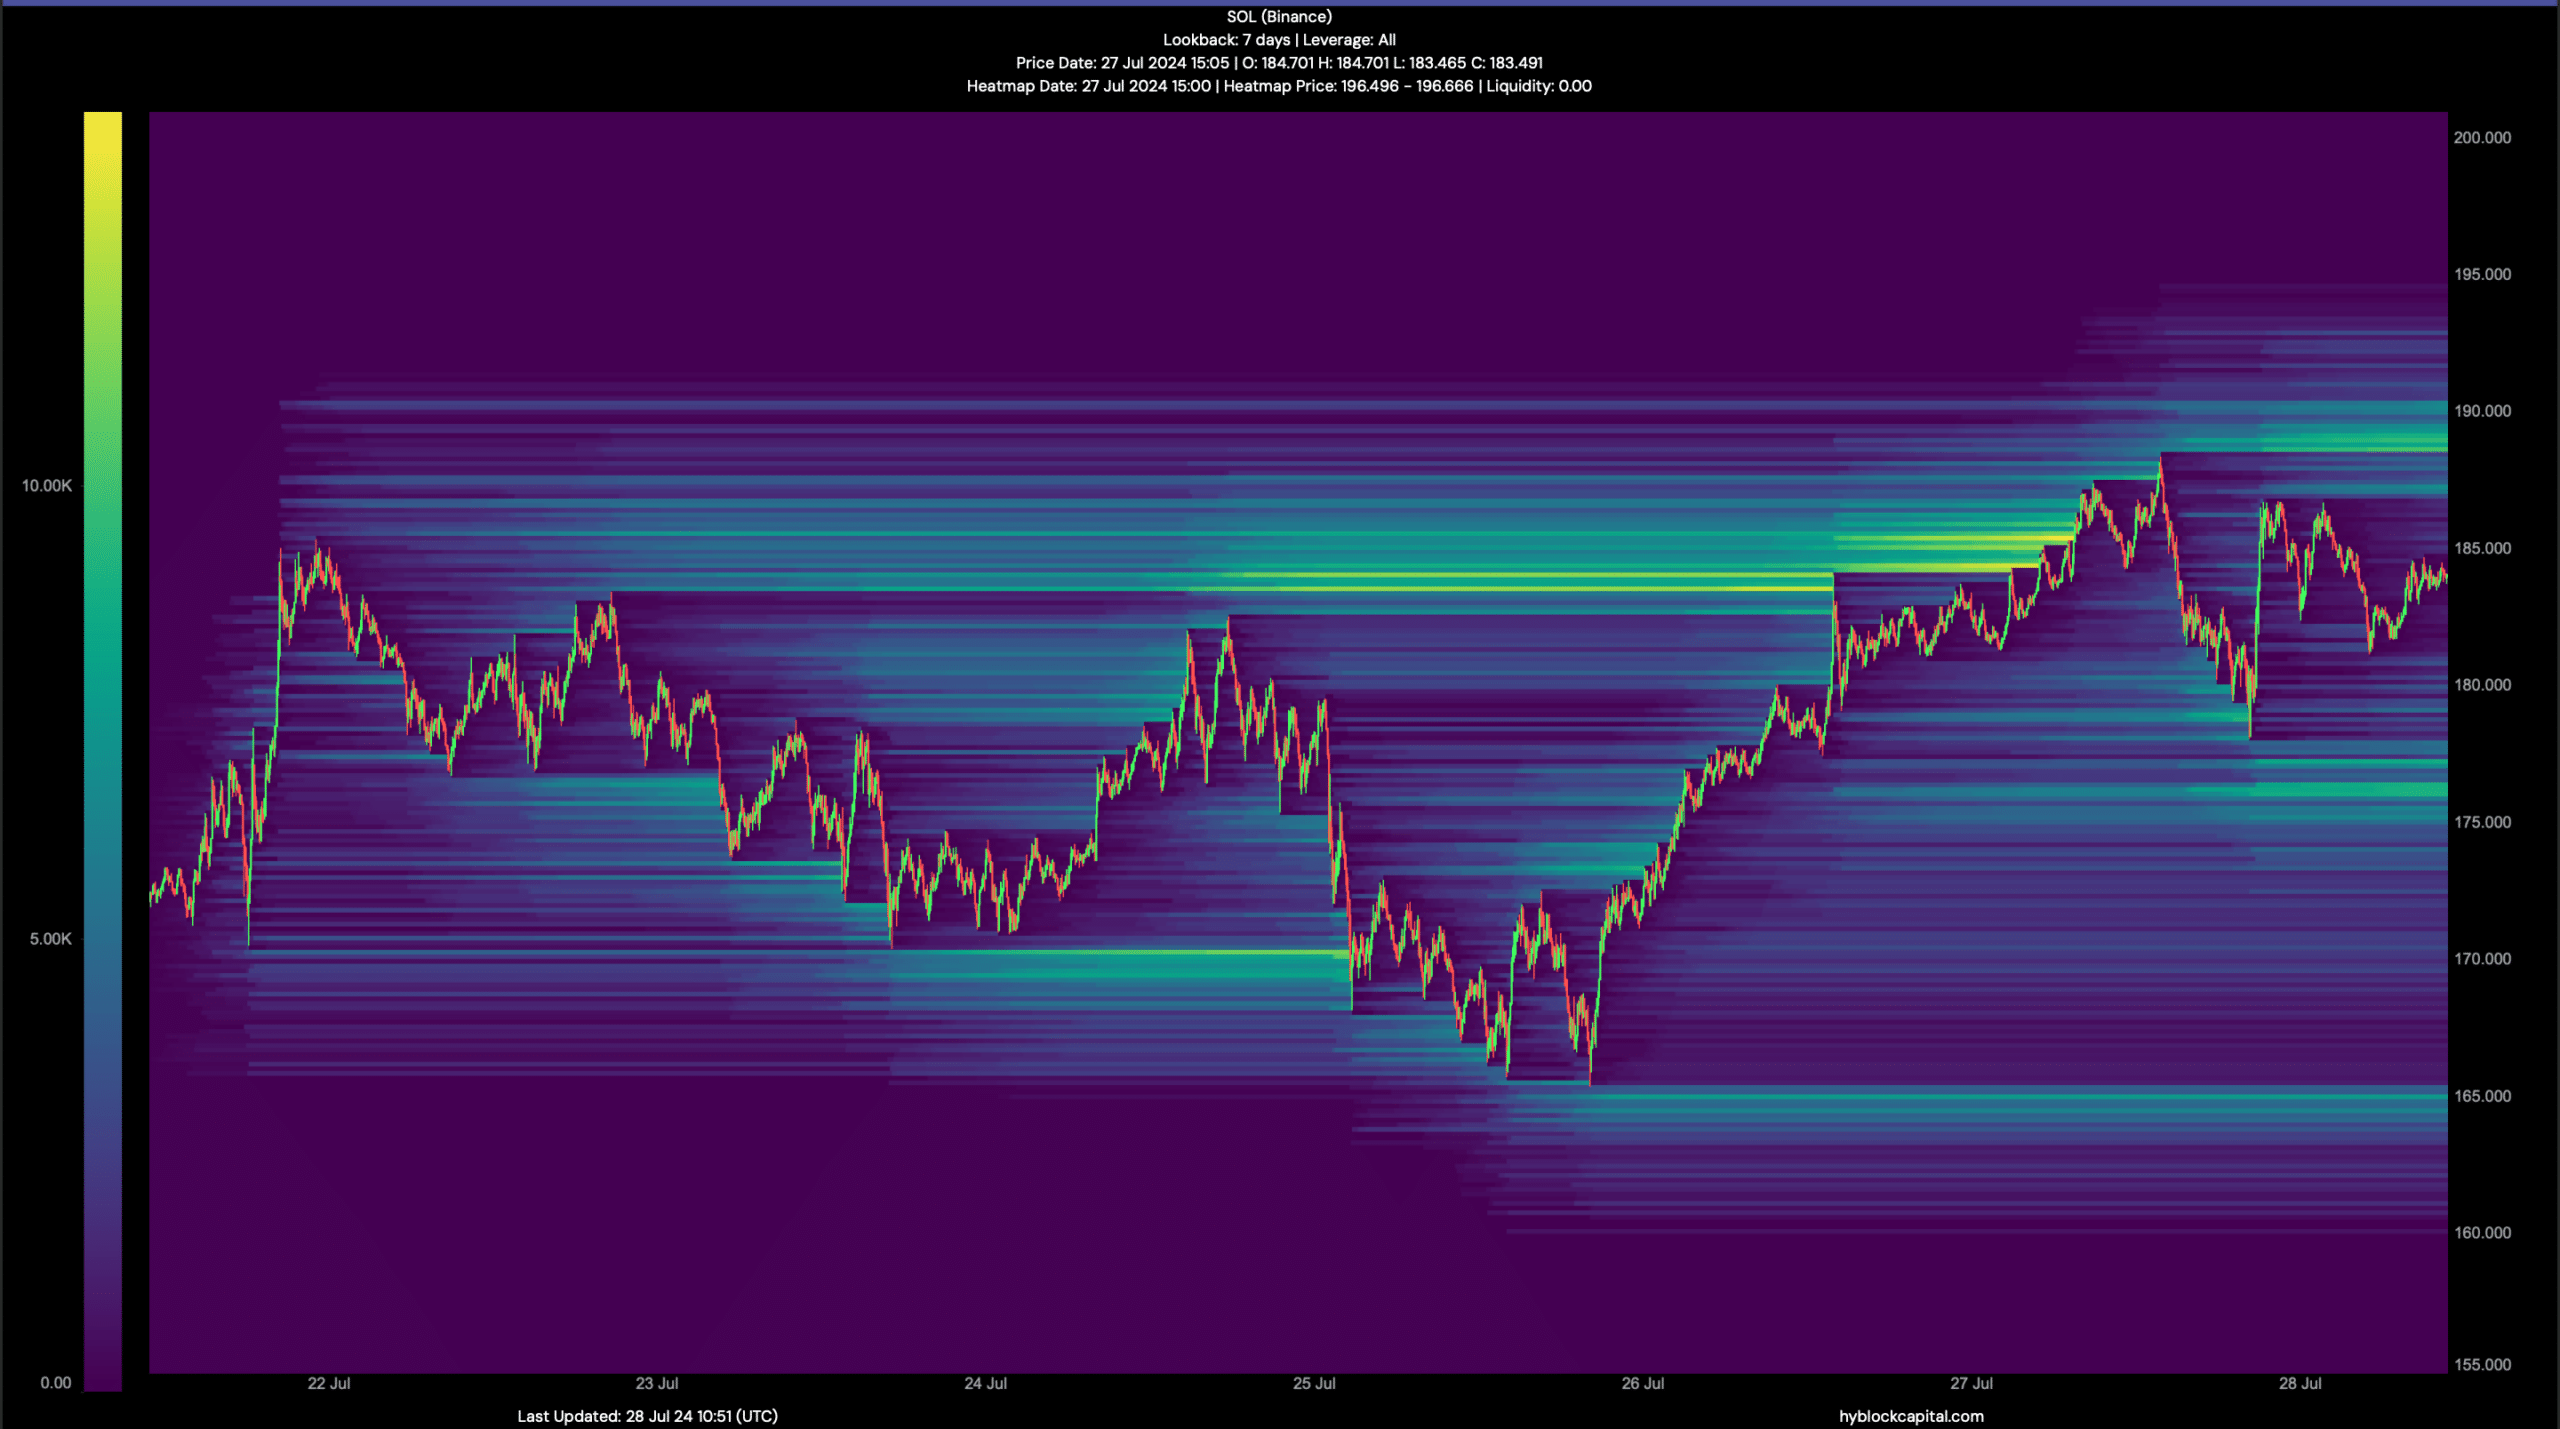
Source: Hyblock Capital