Solana’s $57M whale move raises red flags – Here’s why
Whales have moved $57 million worth of SOL to a centralized exchange (CEX) as its price nears a strong resistance level, creating sell pressure.

- Solana’s daily chart appears to be forming a double-top bearish price action pattern.
- Despite the spot Ethereum ETF approval, whales are moving Solana.
When U.S. regulators approved the spot Ethereum [ETH] Exchange-Traded Fund (ETF) on 23rd July, the market turned red. It has been observed that institutions started dumping tokens following the ETF approval.
Amid this ongoing dumping, whales are looking to offload Solana [SOL], the world’s fifth biggest crypto asset.
The blockchain transaction tracker Whale Alert shared a post on X stating that whales have transferred nearly $57 million worth of SOL to the centralized exchange (CEX) Binance.
However, this massive SOL transfer occurred through two separate transactions.
In the first transaction, the whale transferred a massive $22.3 million of SOL, while in the second transaction, the whale transferred a notable $35.16 million of SOL to Binance.
Additionally, this massive transfer comes at a time when SOL is near its strong resistance level.
The potential reason behind these token transfers could be the current market sentiment and Solana’s bearish price action pattern in a shorter time frame.
Solana technical analysis and upcoming level
According to expert technical analysis, SOL was looking bullish on a larger time frame but bearish on a smaller one. On the daily time frame, SOL was forming a double-top bearish price action pattern and may experience a price drop in the coming days.
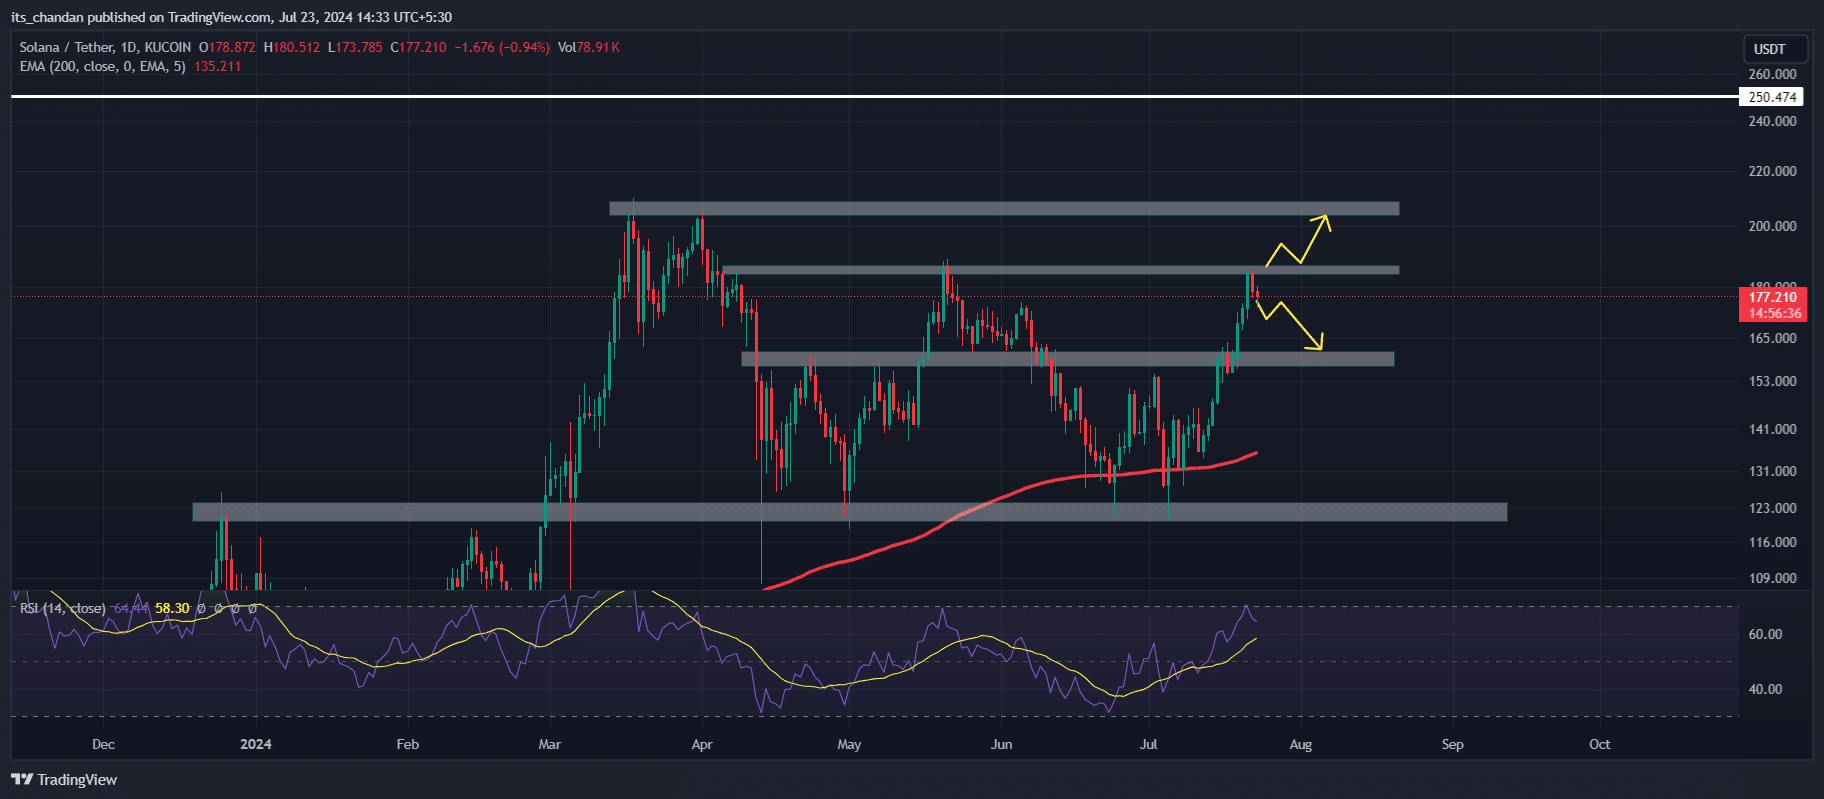
However, this bearishness was also supported by the Relative Strength Index (RSI), which is in the overbought area. The RSI value in the overbought area signals potential price retracement.
Following this short-term bearishness, the open interest (OI) of SOL in the last 24 hours has dropped by 1.65%. This decline in OI indicates reduced interest from investors and traders.
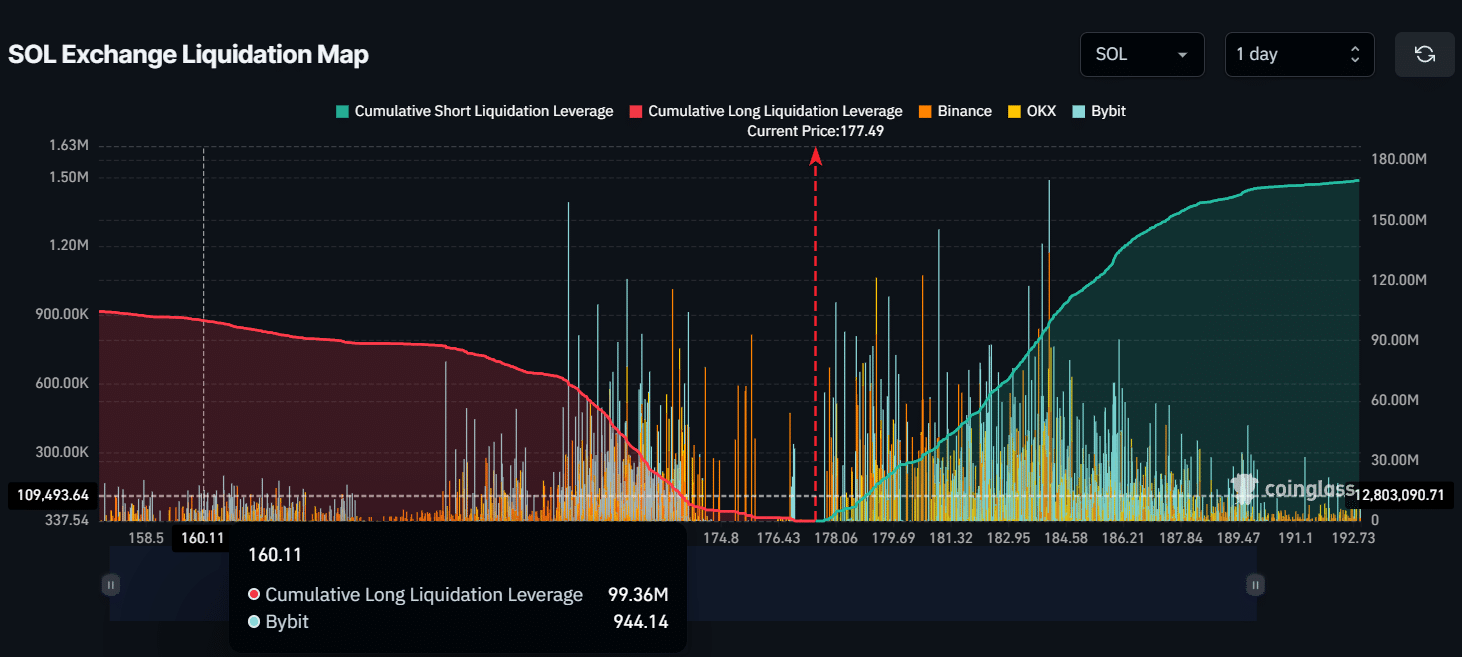
According to the chart structure and historical data, there is a high chance that SOL could fall and hit the $160 level. If SOL reaches the $160 level, nearly $100 million worth of long positions will liquidated, according to CoinGlass data.
Is your portfolio green? Check out the SOL Profit Calculator
As of writing, SOL was trading near $176.6 and has experienced a 1.2% price drop in the last 24 hours. Additionally, in intraday, it also made a high of $182 level.
If we look at the performance of SOL over a longer period, it has experienced a price surge of over 16% in the last seven days.