- SOL maintained its trend above its 50 MA.
- Derivative metrics flashed positive signals.
Over the past 14 days, Solana’s [SOL] price has experienced significant fluctuations. One week, it appeared to be on the verge of reaching its all-time high again.
The next week, it faced declines that threatened to push it below a critical threshold.
Solana hops between gains and losses
According to AMBCrypto’s analysis of the daily time frame chart, Solana has shown contrasting trends in recent weeks.
The price range tool highlighted these fluctuations. Between the 14th and the 20th of May, Solana’s price increased by approximately 23%, rising from around $141.9 to over $186.
This climb suggested that Solana might reclaim the $200 price zone it reached in March. However, after hitting the $186 mark, the price reversed.
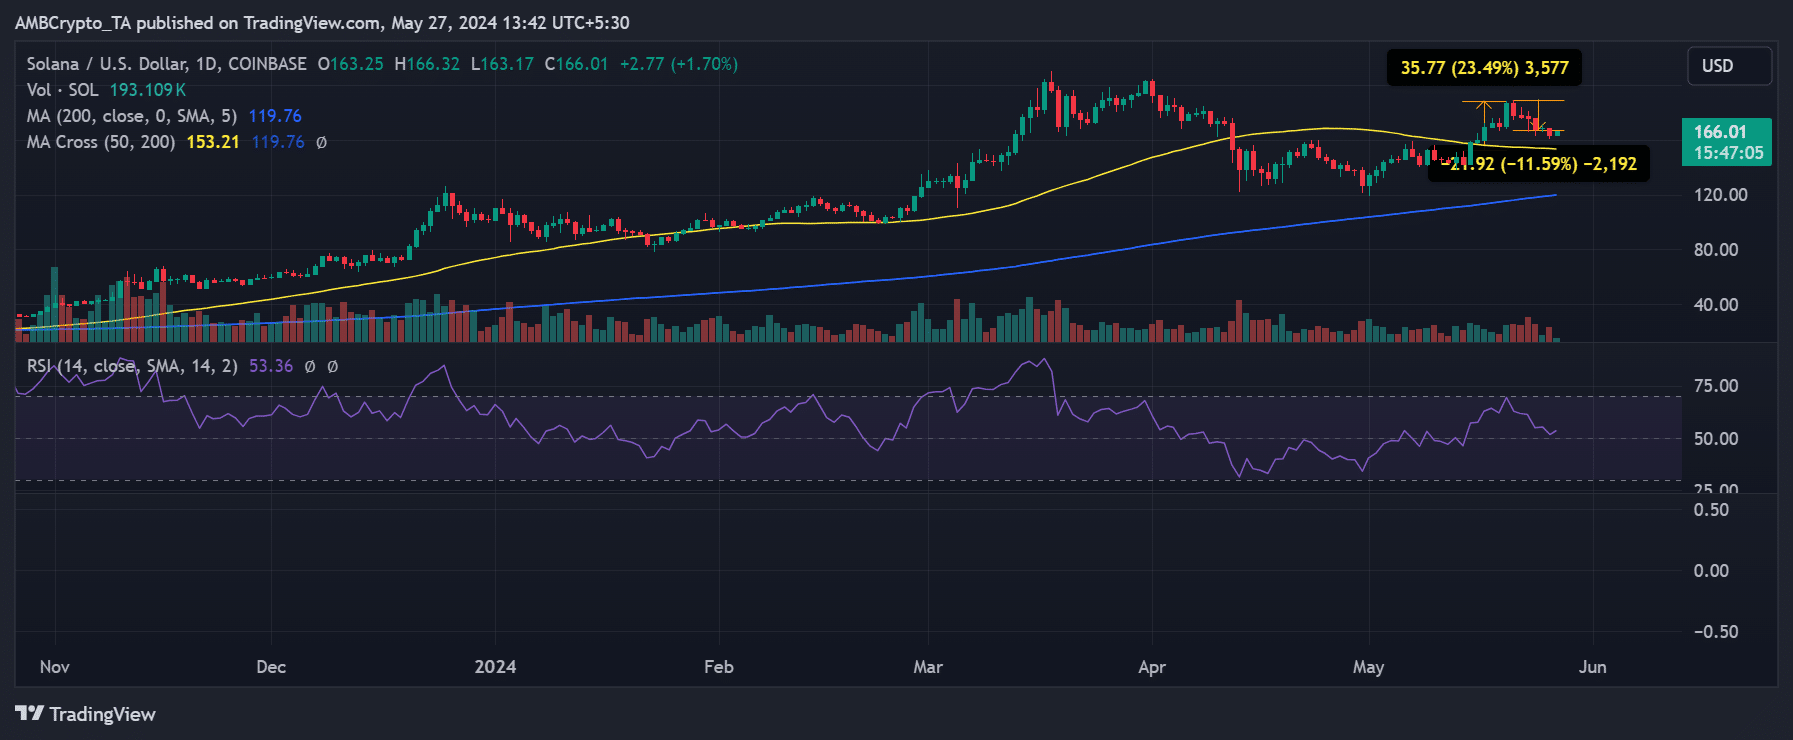
Source: TradingView
The price range tool indicated that over the last seven days, from the 21st of May to press time, the price dropped by over 21%.
After spiking to the $180 zone with a 9% increase, it saw a more than 4% decline in the next trading session on the 21st of May.
Subsequent declines followed, and the few uptrends were insufficient to offset these losses. At the time of writing, Solana was trading around $166, showing a 1.70% increase.
Notably, it was trading above its short Moving Average (yellow line), which was acting as support at approximately $154. However, other key metrics will determine if this current support level can hold.
Solana volume rise above $2 billion
An analysis of Solana’s trading volume revealed a significant recent drop. According to Santiment, the volume fell from over $5 billion to around $1.8 billion on 25th May.
However, starting on the 26th of May, the volume began to rise slightly, reaching around $2.5 billion.
At the time of writing, the volume was over $2.7 billion. This indicated that despite the price decline, Solana was still experiencing a decent trade volume.
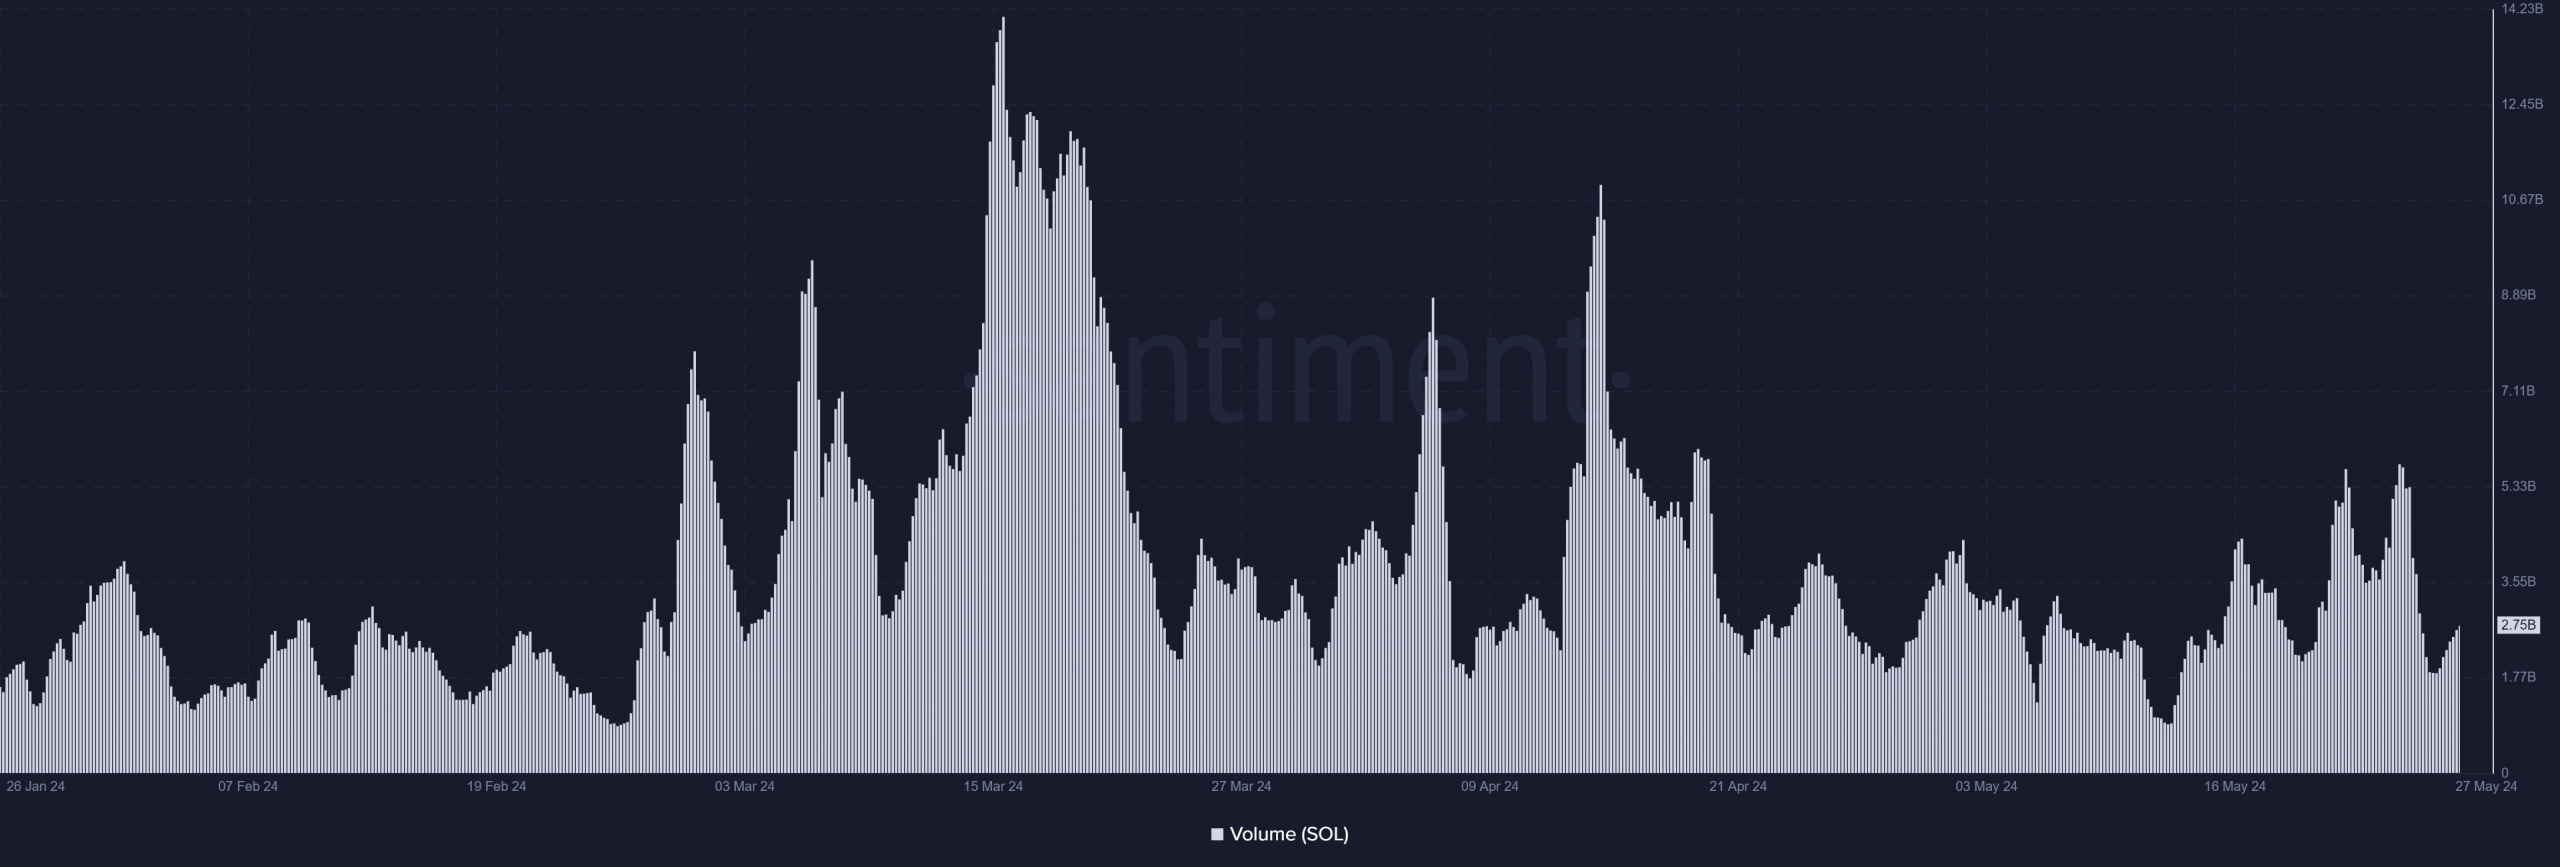
Source: Santiment
SOL interest and Funding Rate flash positive signals
An analysis of the Funding Rate on Coinglass showed a recent increase, with the rate at around 0.019% at the time of writing. This indicates that buyers are more active, betting on a rise in Solana’s price.
Additionally, an analysis of the Open Interest revealed a slight increase, with SOL’s Open Interest at approximately $2.4 billion during press time. This influx of cash is a bullish signal.
Considering the trading volume and derivative metrics, Solana’s current support level might hold strong for a while.
Read Solana’s [SOL] Price Prediction 2024-25
The rising volume indicated sustained interest, and the increase in Open Interest suggested more cash is flowing into SOL.
This could push the price higher, and even if it doesn’t, the likelihood of it falling below the current support level is low.