Solana approaches crucial $128 support: Will bulls hold the line?

- SOL is headed for a critical support level.
- If the bulls fail to defend that level, the coin’s price will fall below $115.
Solana [SOL] closed at a 30-day high of $186.70 on 20th May. As profit-taking surged, the coin’s price fell, forming a descending triangle.
At press time, SOL traded at $132.23, having declined by almost 30% in the last month, according to CoinMarketCap.
Solana bulls have to lock in
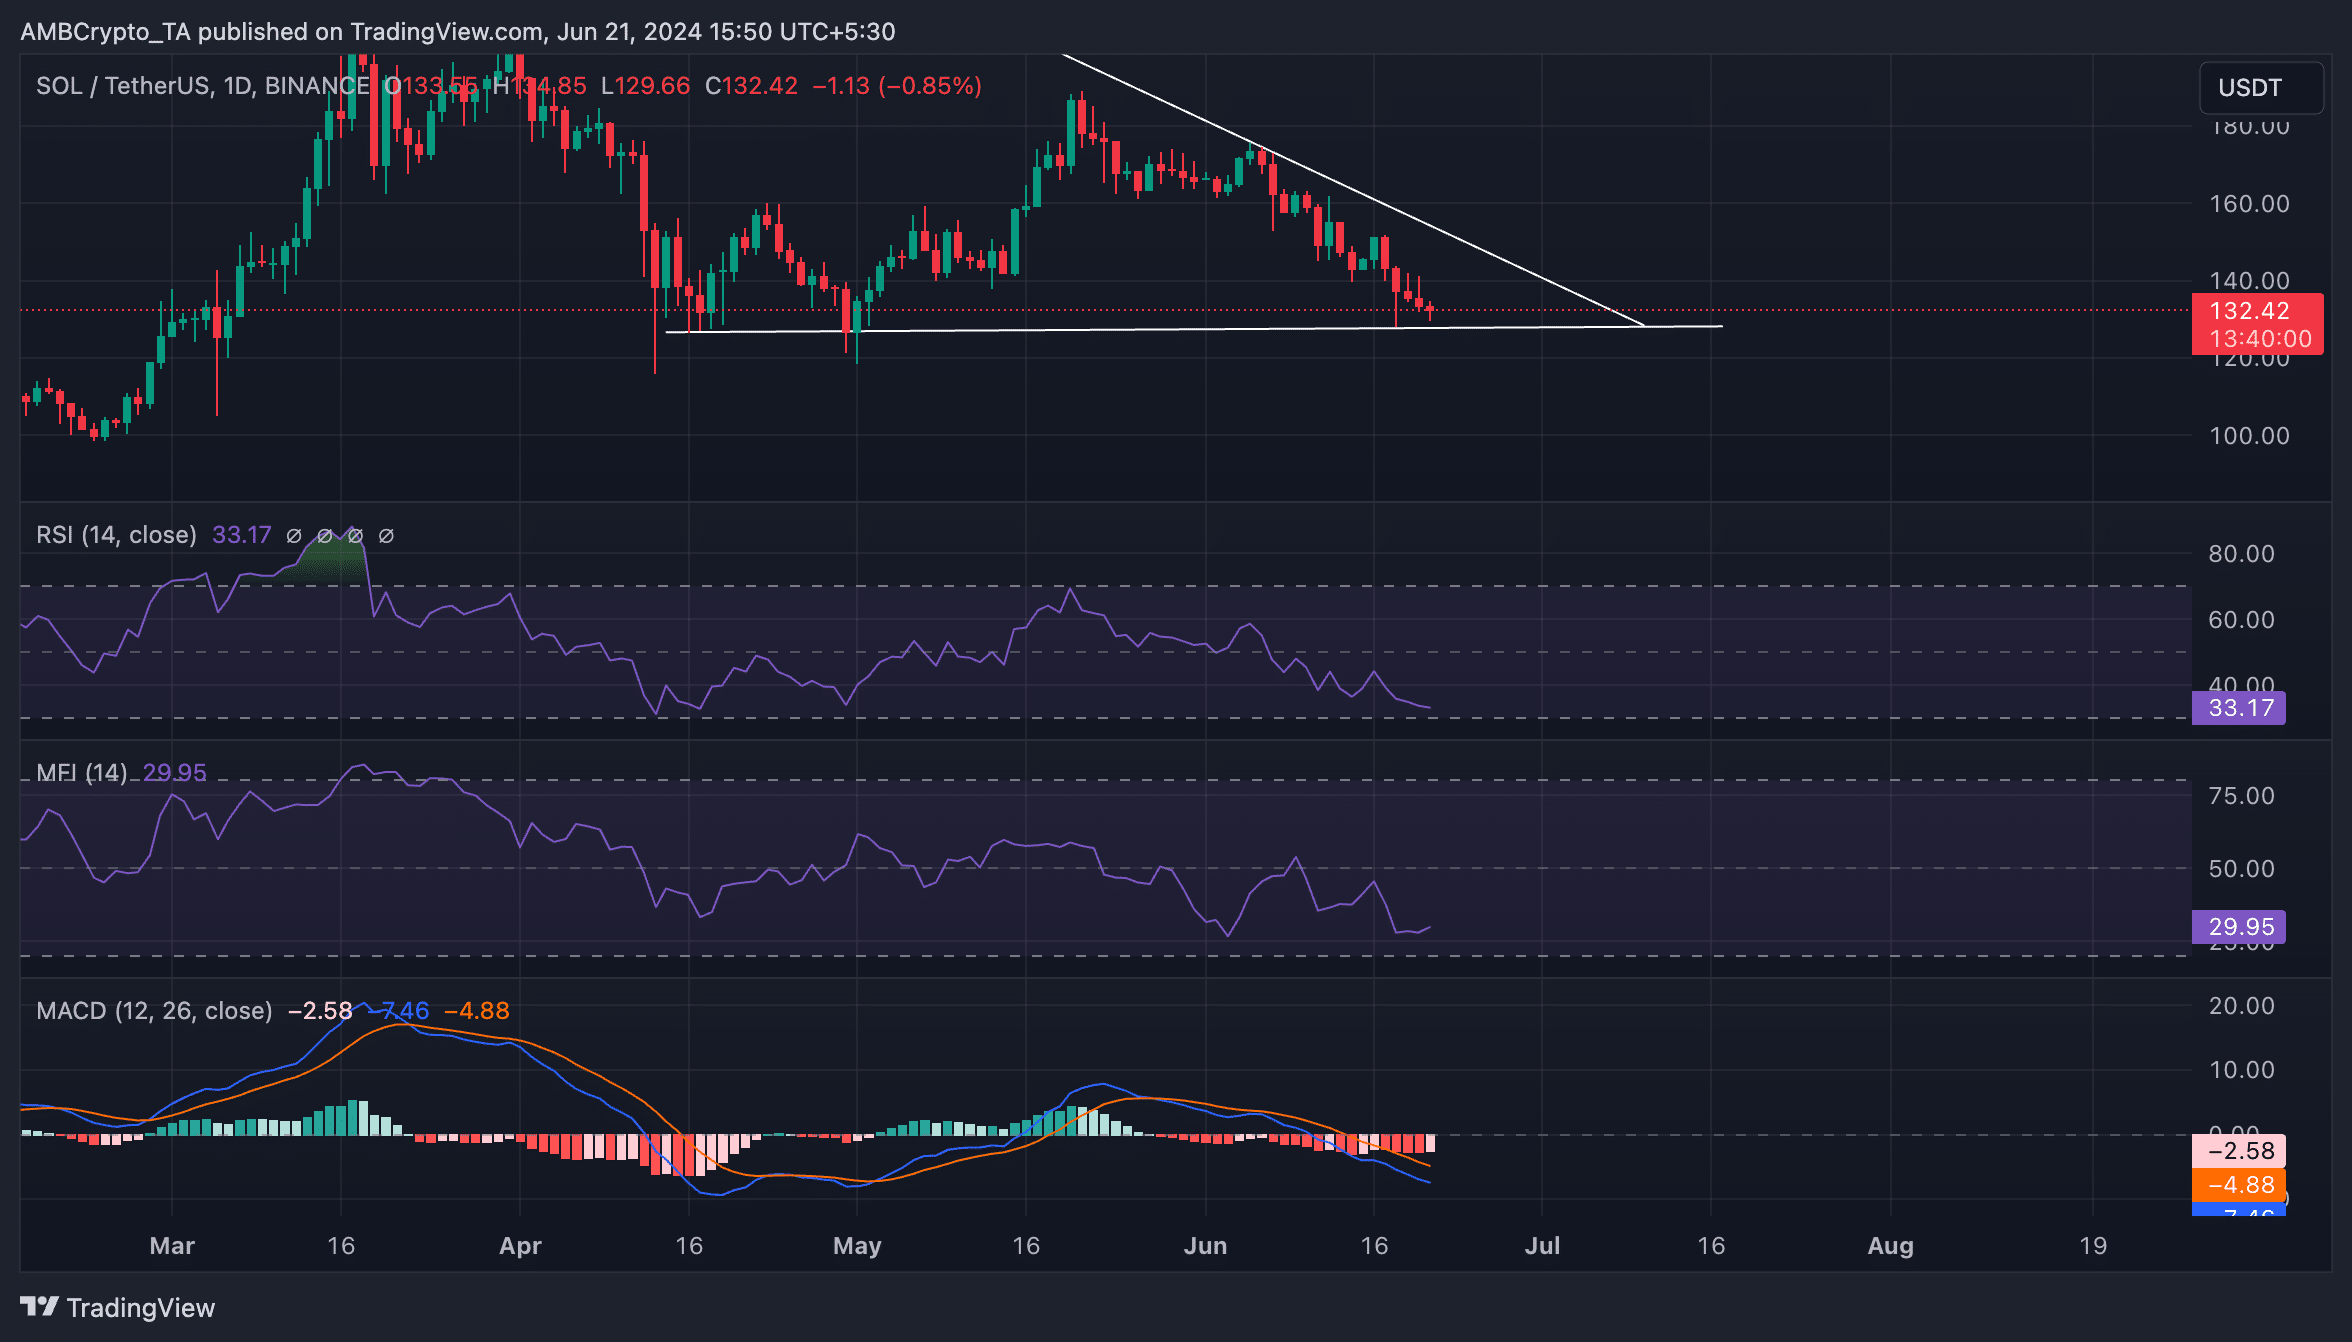
When an asset’s price forms a descending triangle, it is a bearish sign that confirms the high selling pressure in its market. This pattern is formed when an asset’s price makes lower highs and bounces off a horizontal support level.
SOL has found support at $128.49. This support level is very important. Generally, when a descending triangle is formed, and the bulls fail to defend the price when it touches the horizontal support line, it signifies a bearish breakout and a continuation of the downtrend.
It means that the sellers have overpowered the buyers, and the asset’s price will continue to fall.
An assessment of some of Solana’s key indicators confirmed the possibility of this happening. For example, its Relative Strength Index (RSI) and Money Flow Index (MFI) were 33.17 and 29.95, respectively, at press time.
These indicators measure an asset’s oversold and overbought conditions by tracking its price changes. They range from 0 to 100, with values above 70 signaling that the asset is overbought and due for a correction, while values under 30 suggest that the asset is oversold and may witness a rebound.
At their current values, SOL’s RSI and MFI suggested that the demand for the altcoin among market participants was low. The indicators signaled that selling pressure outweighed buying activity in the SOL market.
Further, readings from the coin’s Moving average convergence/divergence (MACD) confirmed traders’ preference for selling their SOL holdings. At press time, the coin’s MACD line (blue) rested below its signal (orange) and zero lines.
Is your portfolio green? Check out the SOL Profit Calculator
When an asset’s MACD is set up this way, it is a bearish signal. Traders often interpret it as a sign to exit long and take short positions.
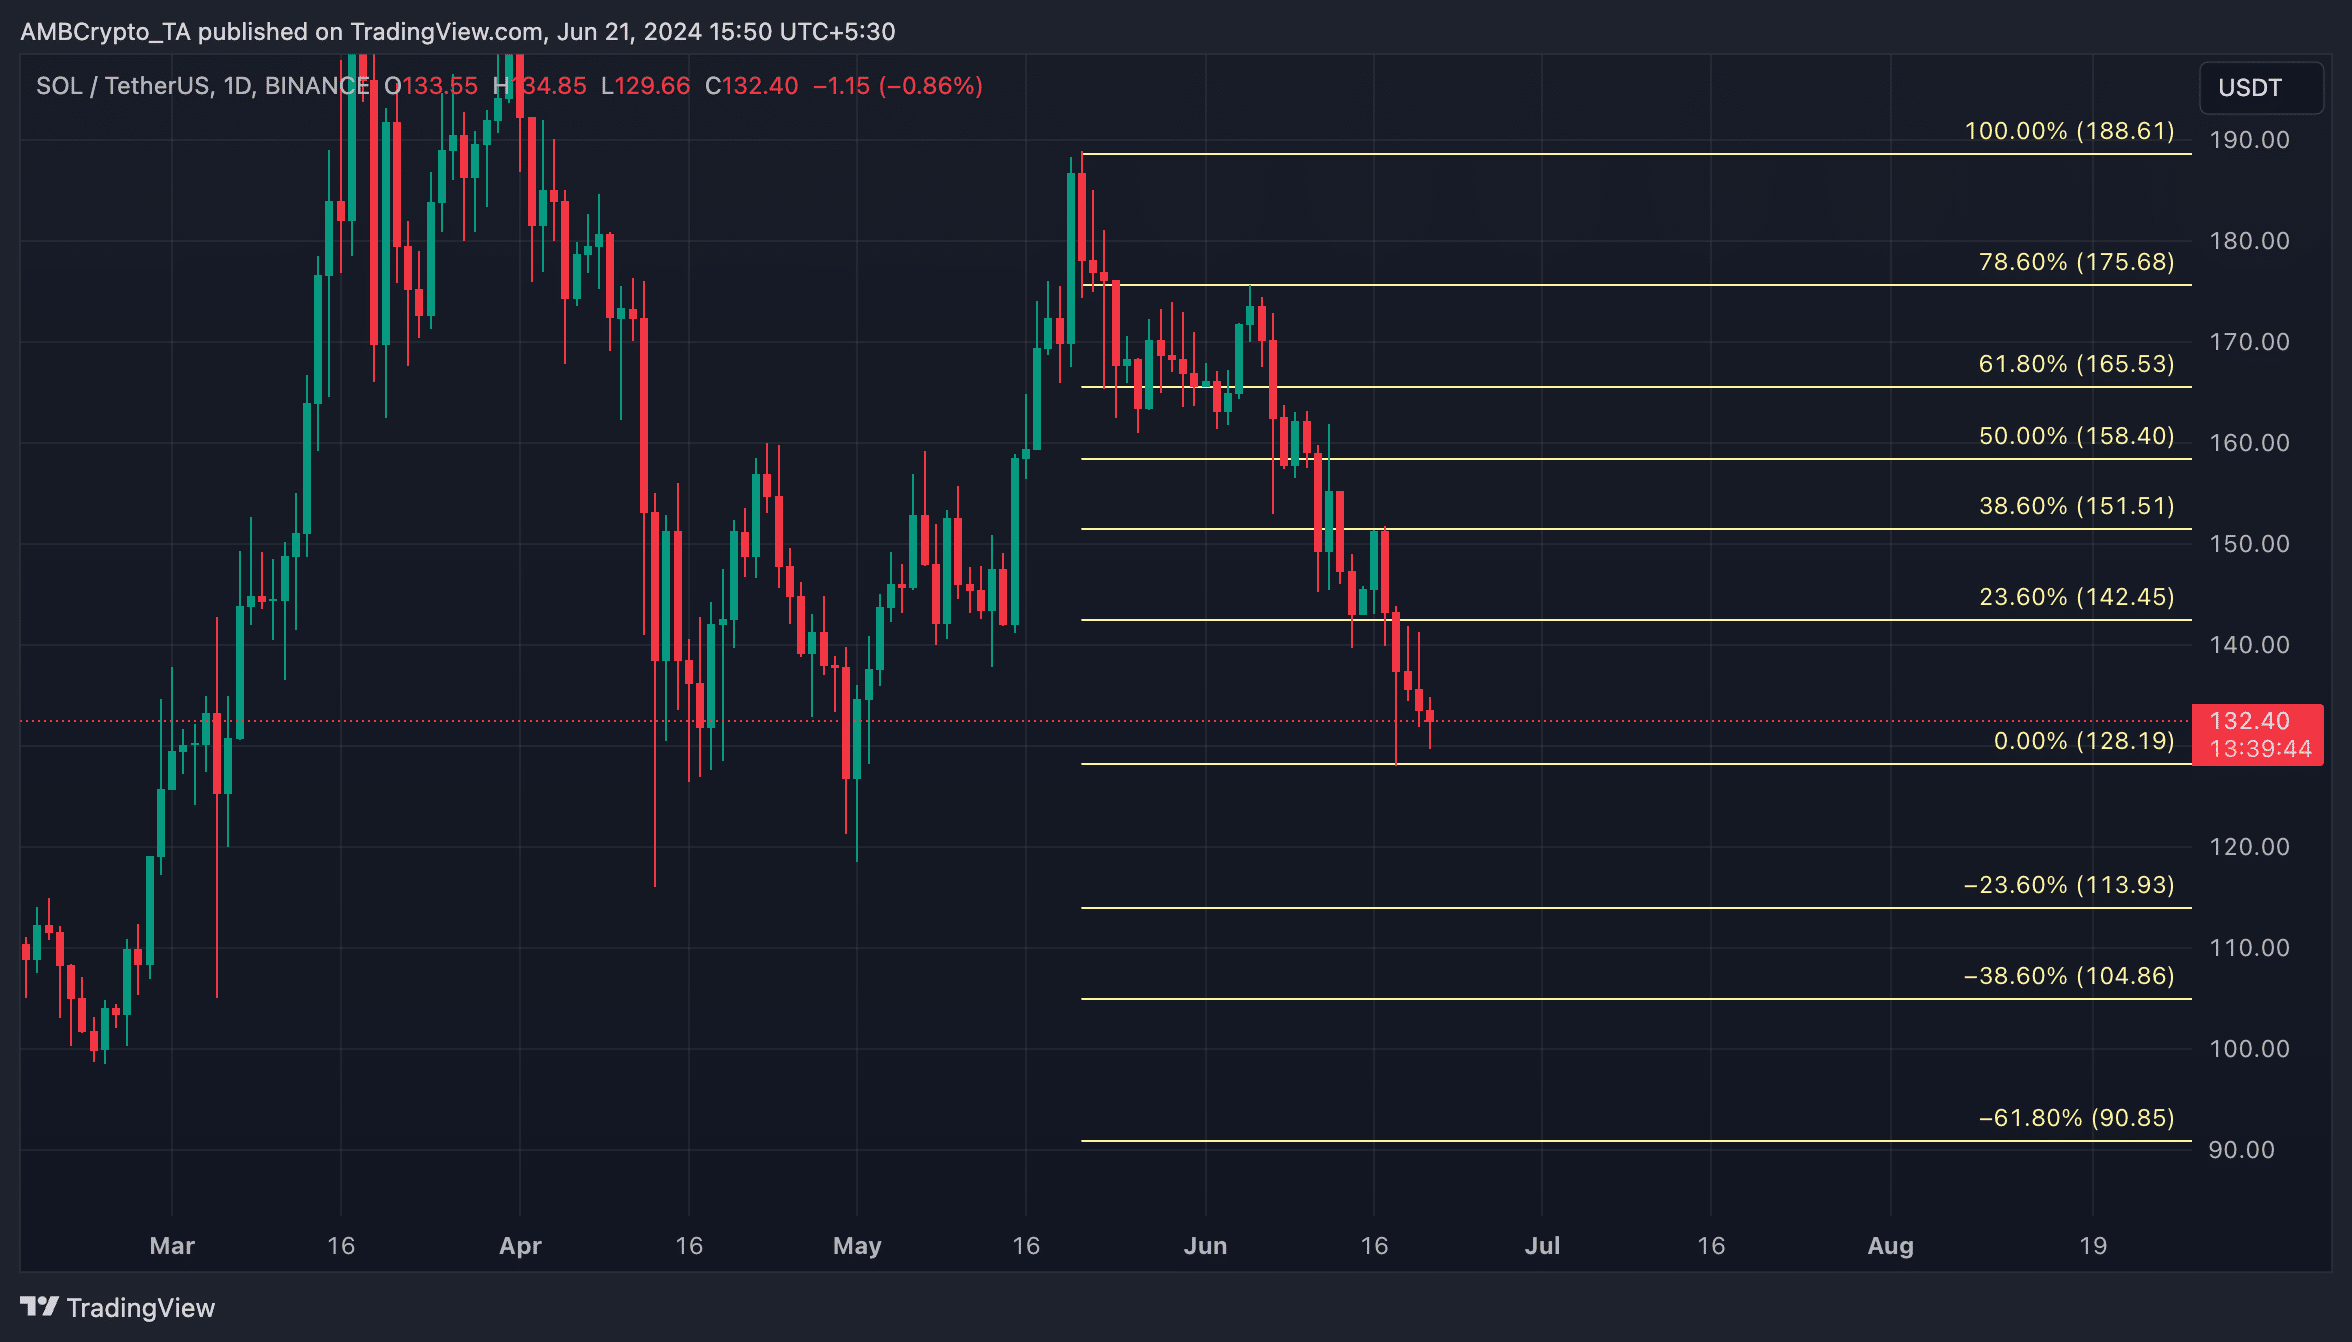
If SOL’s price falls to support and the bulls fail to defend it, its value will plummet further to $113.943. However, if market sentiment shifts and demand for SOL grows, the coin’s price might climb toward $142.45.


