
- Solana has seen a drop in NFT activity since the year started.
- SOL’s value has grown tremendously in the last three months.
Despite the re-emergence of interest in profile picture NFTs (PFPs) since the beginning of the year, Solana [SOL] has witnessed a steady decline in NFT activity.
According to data from Dune Analytics, the network has seen a steep decline in its count of monthly NFT trades completed since September 2022. With 349,937 NFT trades completed on Solana this month, there has been a 63% drop from the 944,010 total NFT trades completed in January.
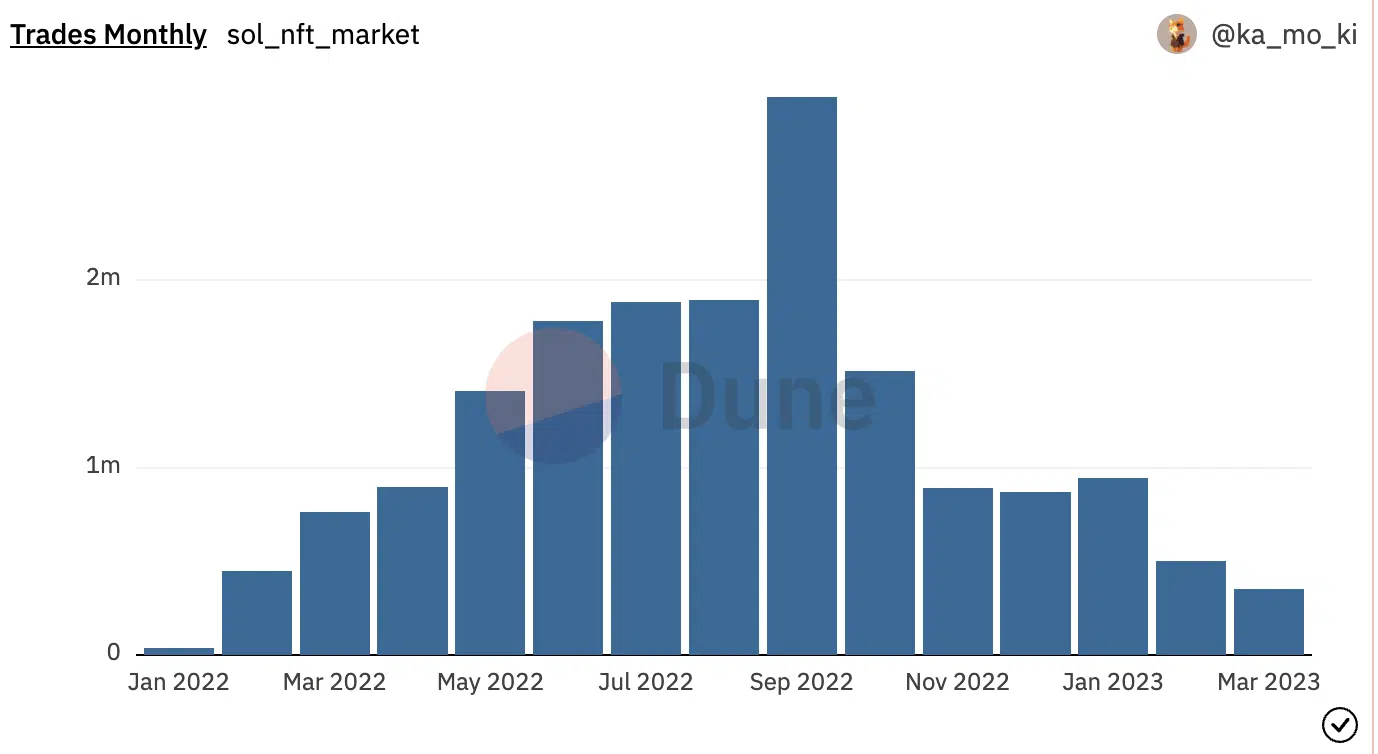
Source: Dune Analytics
As a result of a consistent fall in NFT trade count on Solana since the year started, the network has also experienced a drop in sales volume. With a sales volume of $35.35 million recorded so far this month, Solana has witnessed a 64% decrease from the $99.37 million registered as total NFT sales volume in January. In the last month alone, this fell by 22%.
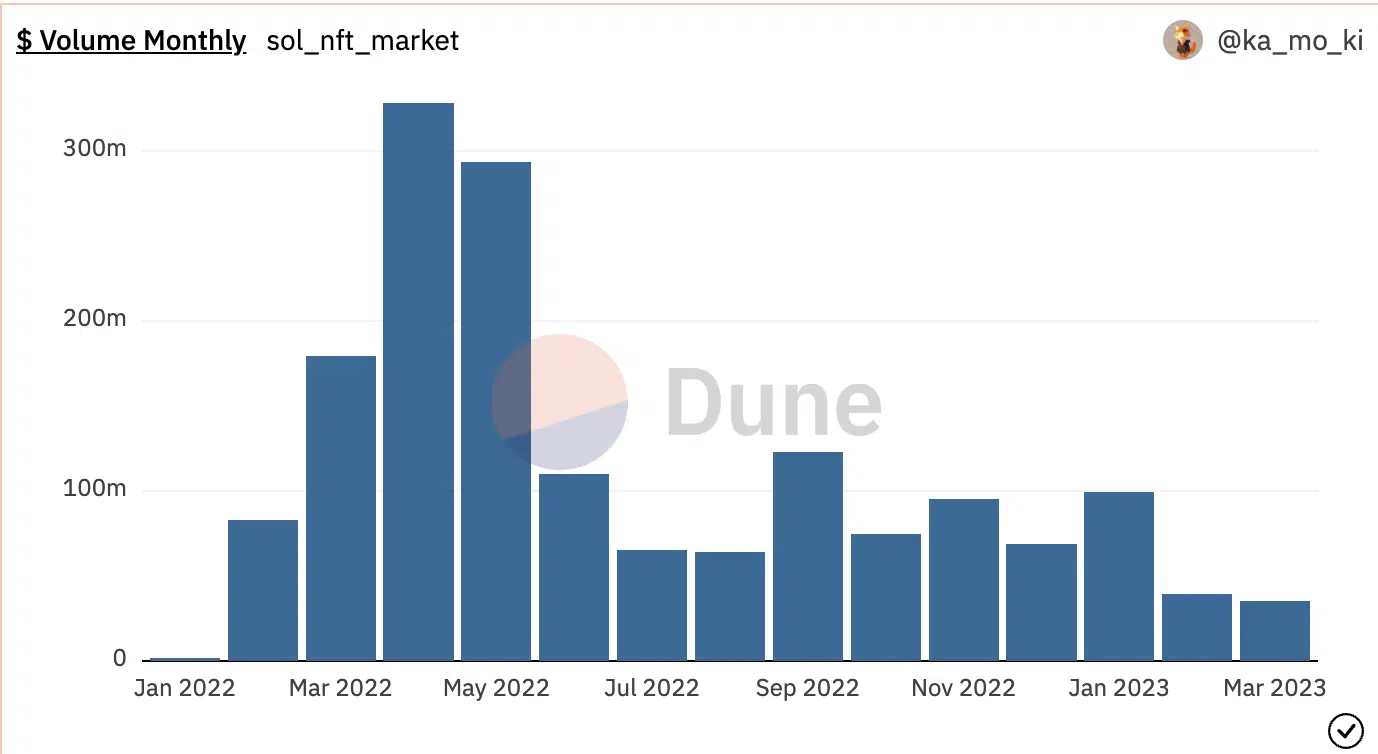
Source: Dune Analytics
Solana marketplaces are the biggest losers
Due to a decline in NFT activity on Solana, the NFT marketplaces native to the chain have faced a persistent fall in sales volume, buyer and seller count, and revenue.
Is your portfolio green? Check out the Solana Profit Calculator
Formfunction, a Solana-based NFT marketplace, recently announced its decision to stop operating after only 13 months of operation due to a decline in Solana NFT prices and trading volumes.
We have some sad news to share today—Formfunction is shutting down on Wednesday, March 29th.
This was an extremely difficult decision; however, after much discussion and careful consideration, we’ve come to the conclusion that we cannot continue to operate Formfunction.
— Formfunction (@formfunction) March 15, 2023
Also, leading NFT marketplace Magic Eden has seen a drop in NFT activity and a decline in its market share. For example, the weekly count of NFT transactions completed on Magic Eden has dropped by 75% since the first week of the year.
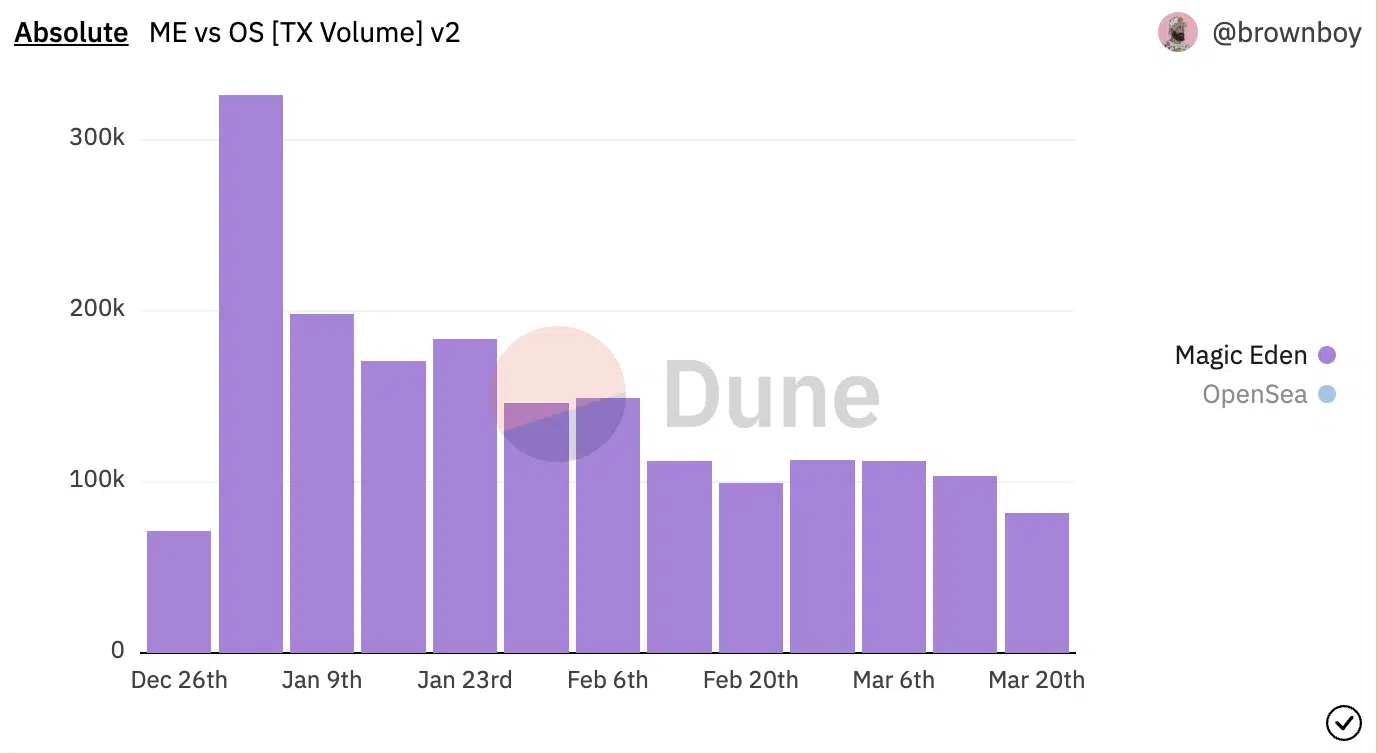
Source: Dune Analytics
Likewise, the number of active traders using the marketplace has also trended downward since the year started. Per data from Dune Analytics, this has since fallen by 31%.
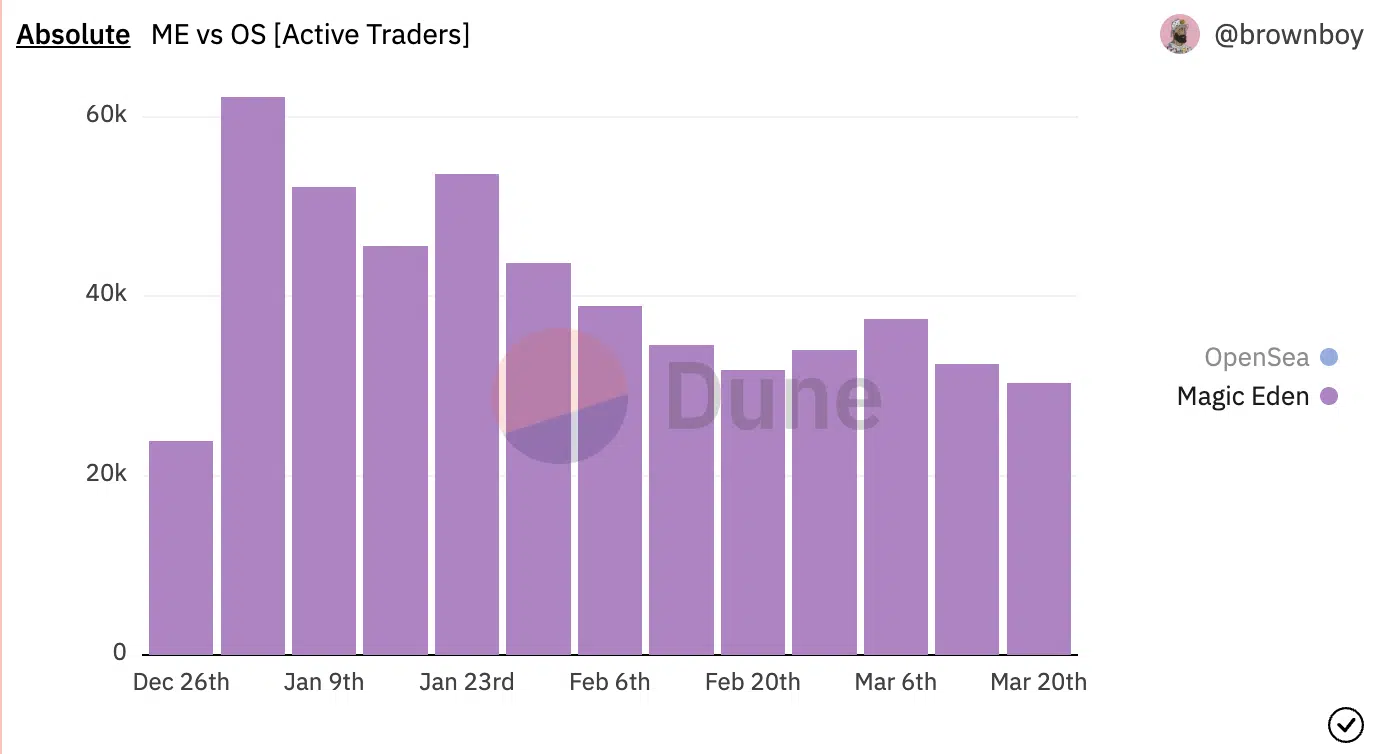
Source: Dune Analytics
Realistic or not, here’s SOL market cap in BTC’s terms
SOL amid all this
Thanks to the rally in the general cryptocurrency market since the year began, SOL’s value has surged by 105% on a year-to-date basis. At press time, the altcoin exchanged hands at $20.54 per SOL, data from CoinMarketCap revealed.
With increased coin accumulation in the last week, SOL buyers were spotted in control of the market on a daily chart at press time.
The Directional Movement Index (DMI) indicator put the buyers’ strength (green) at 19.85, above the sellers’ (red) at 16.69.
Likewise, SOL’s Money Flow Index (MFI) rested above the neutral 50 line at 64.57, indicating growing buying momentum.
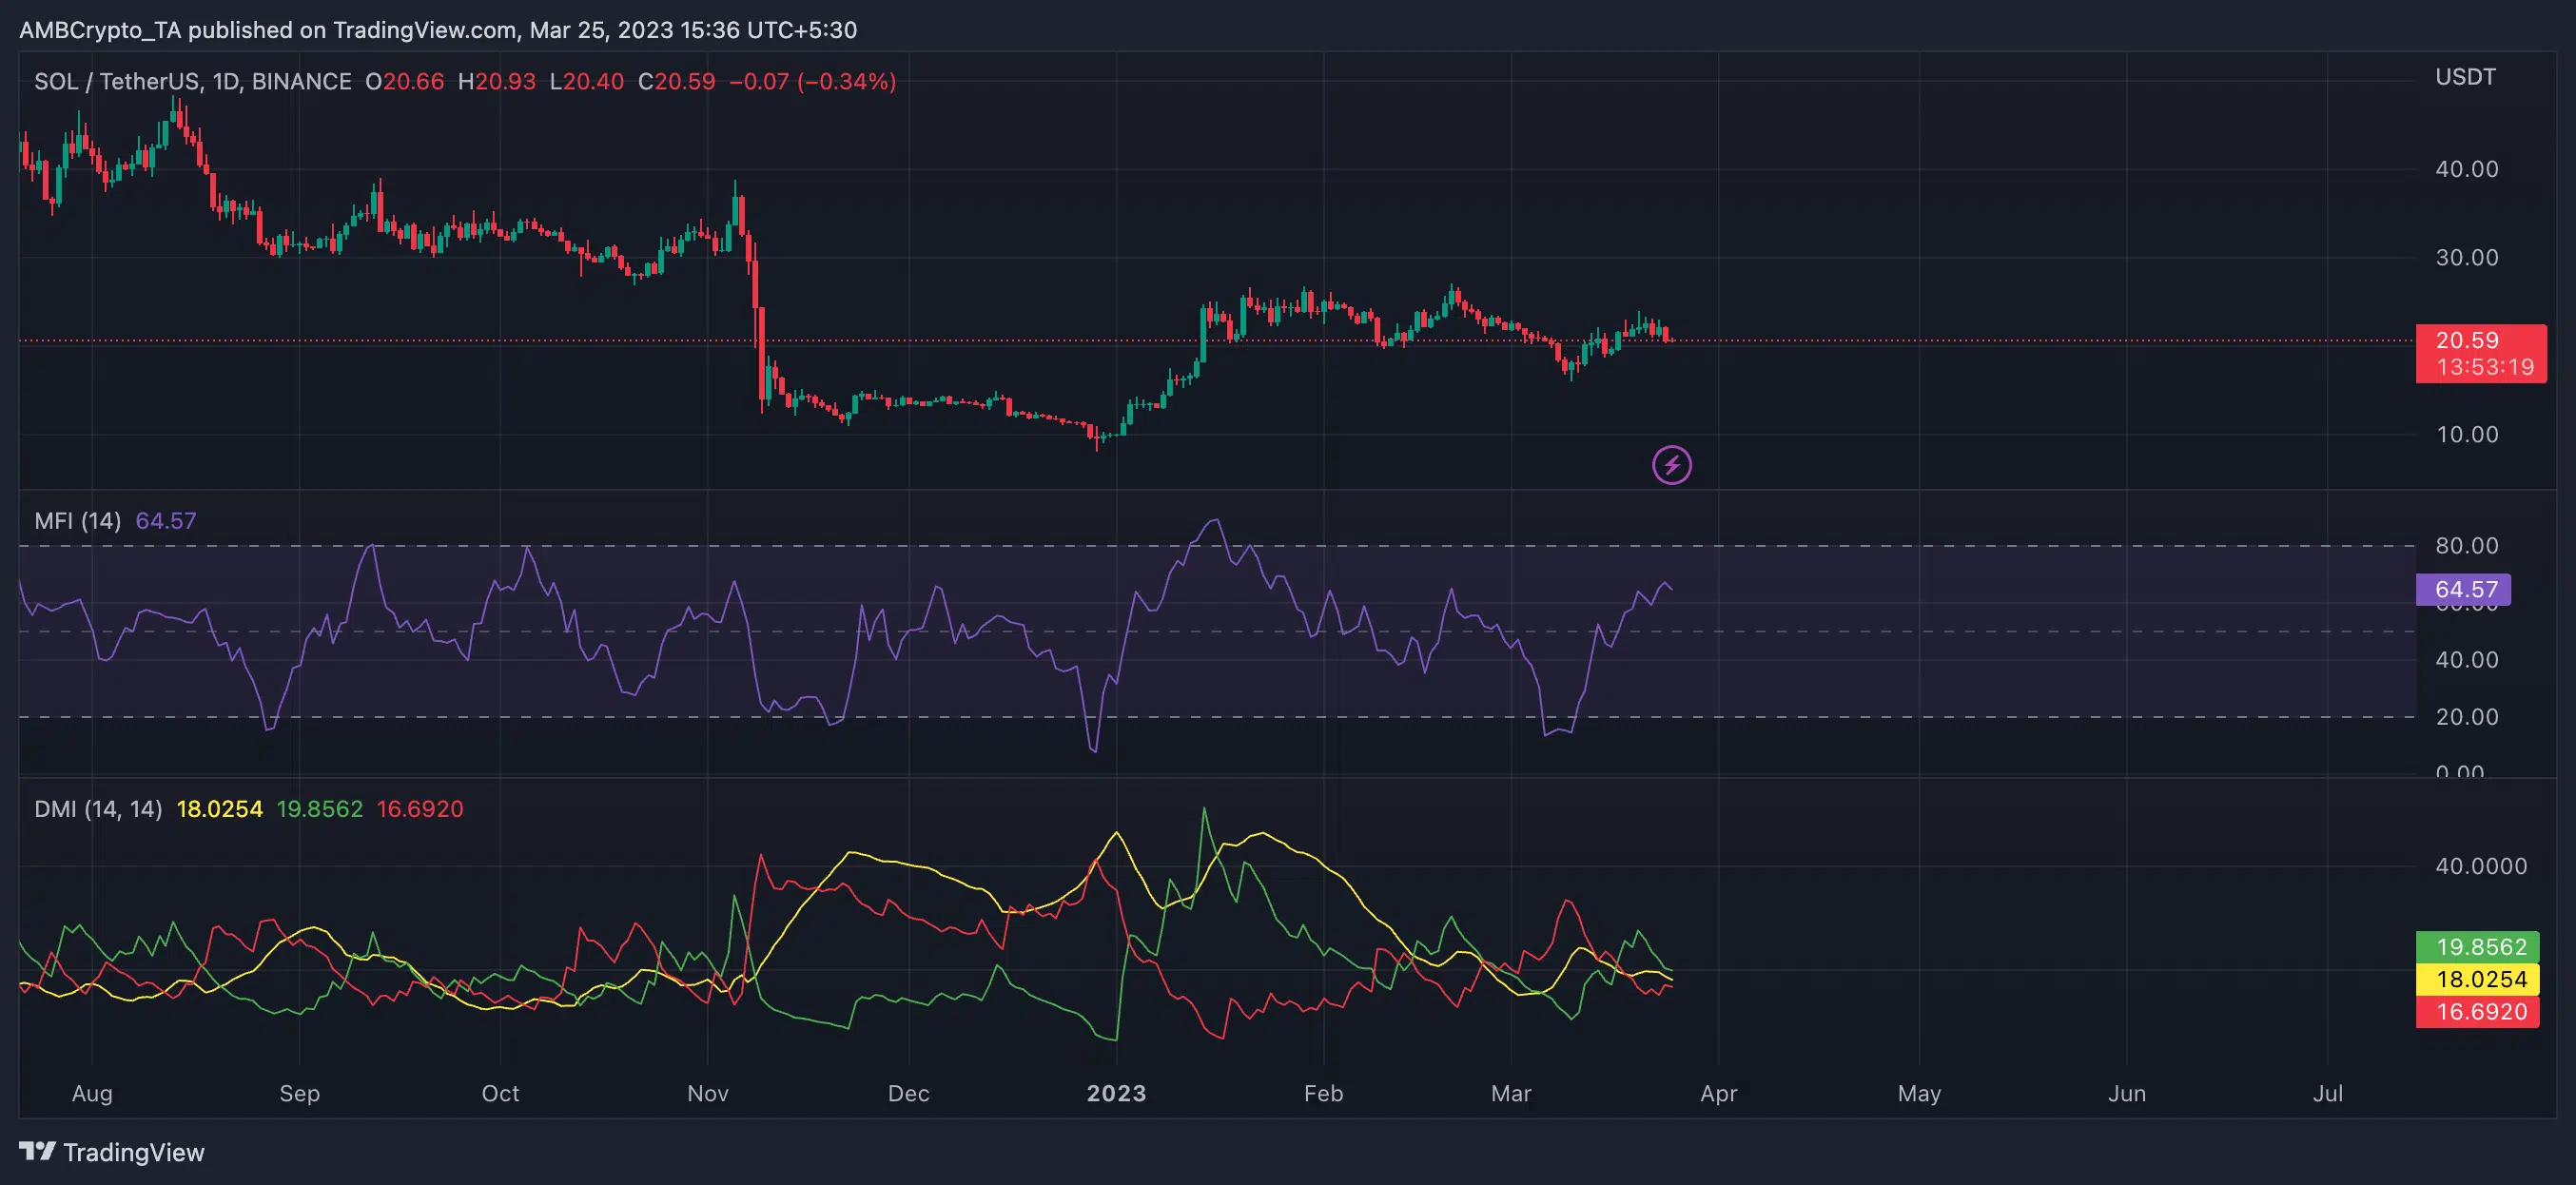
Source: SOL/USDT on TradingView