Solana price prediction – SOL investors will soon have this decision to make
The findings from the price action and technical indicators highlighted that Solana investors must brace for further losses.
- Solana has a strongly bearish market structure on the lower timeframes.
- The 78.6% Fibonacci level has been valiantly defended – but for how much longer?
Solana [SOL] did not have much positive news for it in terms of the price action. It faced rejection from a higher timeframe imbalance at $160 and has settled into a range formation.
This range extended from $156 to $116.3. The technical indicators had a bearish bias to them. A recent AMBCrypto report also highlighted the plight of the Open Interest behind SOL, and its bearish implications.
The mid-range level was resistance now
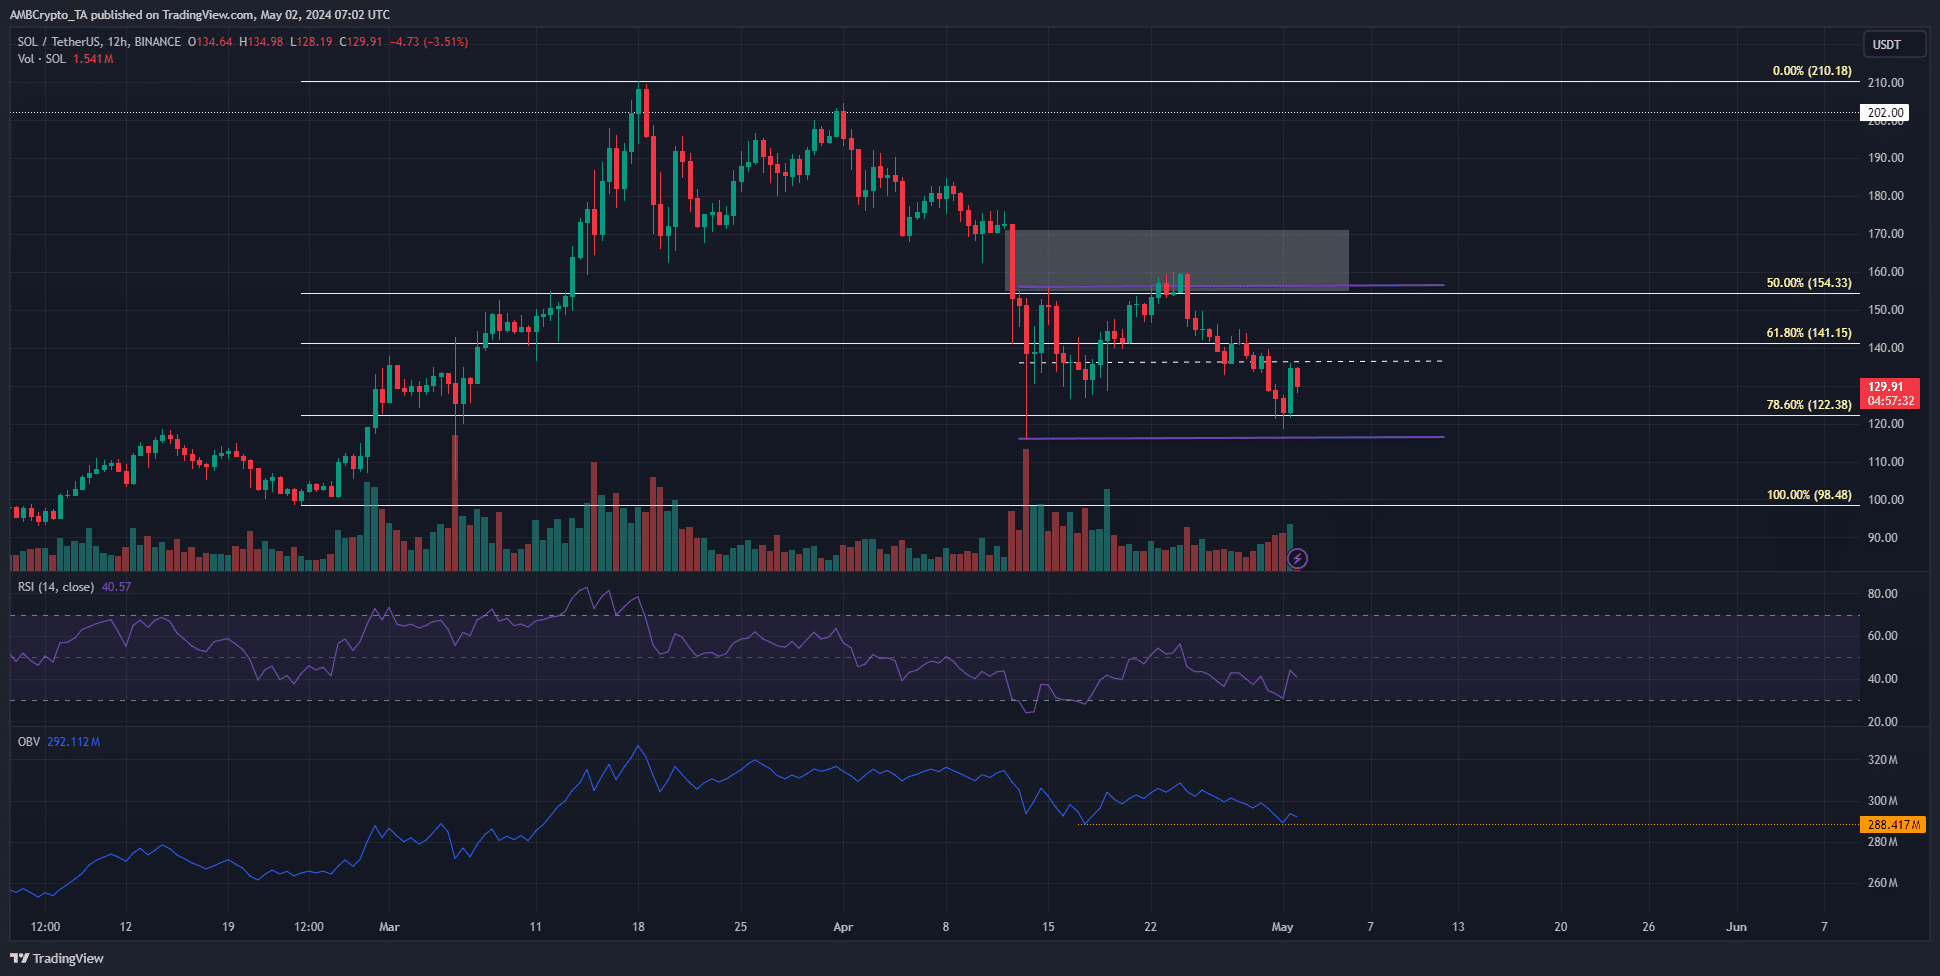
The range (purple) has its mid-range mark at $136.6. At press time, SOL was trading at $129.1. It appeared to be headed to the mid-range level as a retest and is likely to face rejection in the coming hours.
The RSI remained below the neutral 50 mark on the 12-hour chart. Its reading of 40.57 showed bearish momentum. The OBV has been in a slow downtrend in the second half of April. The past two days saw it bounce from the mid-April low.
If this OBV support is broken, it would indicate that SOL sellers were gaining strength. This might be enough to push prices below the range lows at $116. The Solana price prediction based on the internal structure highlighted that $122 was a critical support level.
The next magnetic zone could deflate all bullish hopes
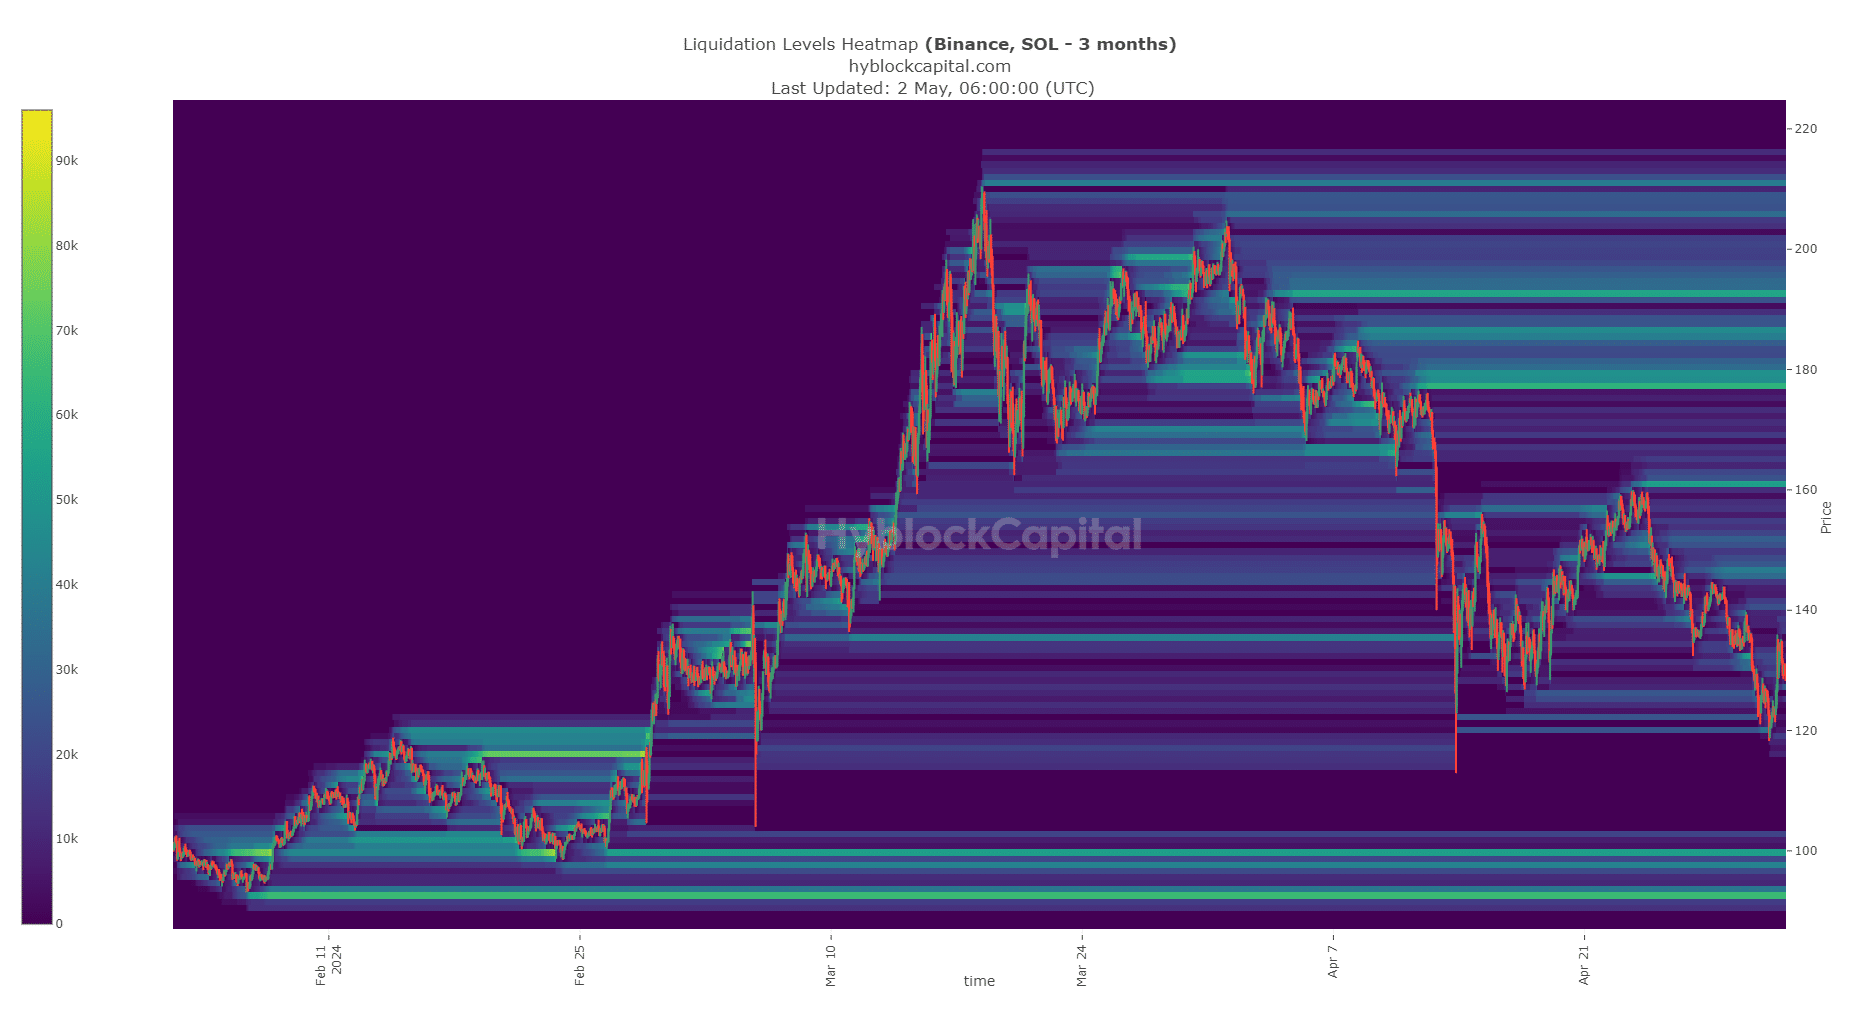
The sentiment in the market was already fearful. The move to $116 on the 13th of April and the subsequent bounce showed that the liquidity near $120 was already swept.
Read Solana’s [SOL] Price Prediction 2024-25
Right now, the next sizeable liquidity pool is at $100. To the north, the $160 and $145 levels were the resistances to watch.
Given the findings from the price action and technical indicators, a move to $100 or $92 would not be surprising.
Disclaimer: The information presented does not constitute financial, investment, trading, or other types of advice and is solely the writer’s opinion.


