
XRP Futures outpace Solana – Will $3.28 billion unlock stop the $3.50 charge?
- SOL’s price increased by more than 12% in the last seven days.
- Market indicators turned bearish on the token.
Solana [SOL] has successfully broken above a key bullish pattern that hinted at a continued price uptick in the coming days. On top of that, an indicator has flashed a buy signal for SOL.
Let’s take a look at what’s going on and assess whether SOL can continue its bull rally in the coming days.
Solana’s bullish move
CoinMarketCap’s data revealed that Solana’s price increased by more than 12% in the last seven days. However, the last 24 hours were bearish, as the token’s price dropped by over 1%.
At the time of writing, SOL was trading at $174.5 with a market capitalization of over $81 billion, making it the fifth-largest crypto.
But this recent setback might be short-lived, as SOL managed to break above a bullish pattern. As per World of Charts’ recent tweet, SOL broke above a bullish pennant pattern and was already running in a 25% profit.
If SOL continues to follow this trend, then investors might soon witness another major price uptick in the coming days.
Apart from this, Ali, yet another popular crypto analyst, recently posted a tweet highlighting another bullish development. Notably, Solana’s TD sequential flagged a buy signal.
When this occurs, it means that the chances of a price uptick are high.
Is Solana ready for a bull rally?
AMBCrypto then checked the token’s on-chain data to see what metrics suggested a bull rally. We found that SOL’s volume remained high in the last week, which can be inferred as a bullish signal.
Its Social Volume also increased, reflecting its popularity. Additionally, Solana’s Weighted Sentiment went into the positive zone. This suggested that bullish sentiment around the token was dominant in the market.
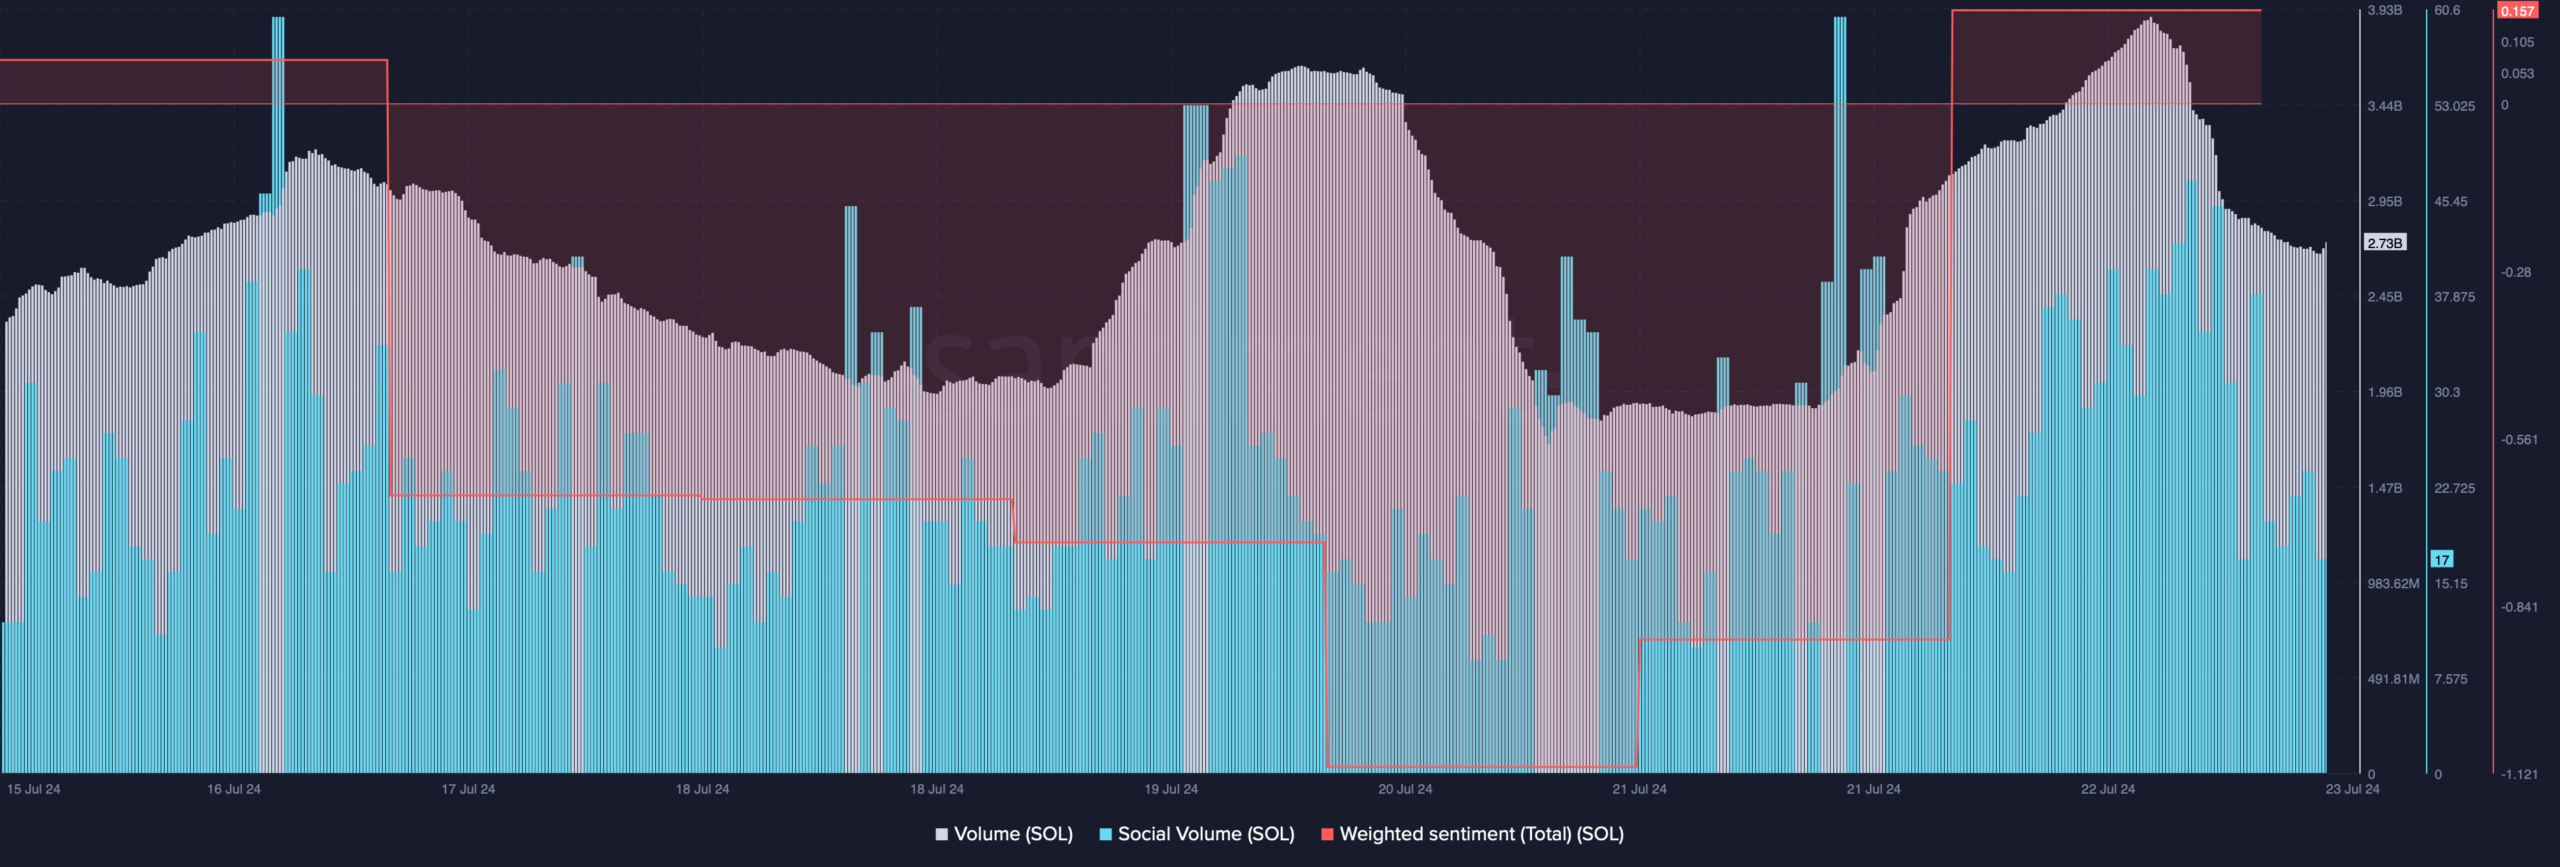
Source: Santiment
We then planned to check the token’s daily chart. As per our analysis, SOL’s price touched the upper limit of the Bollinger Bands, which often results in price corrections.
Additionally, its Relative Strength Index (RSI) registered a downtick, further suggesting that the chances of a price drop were high. Nonetheless, the MACD displayed a bullish advantage in the market.
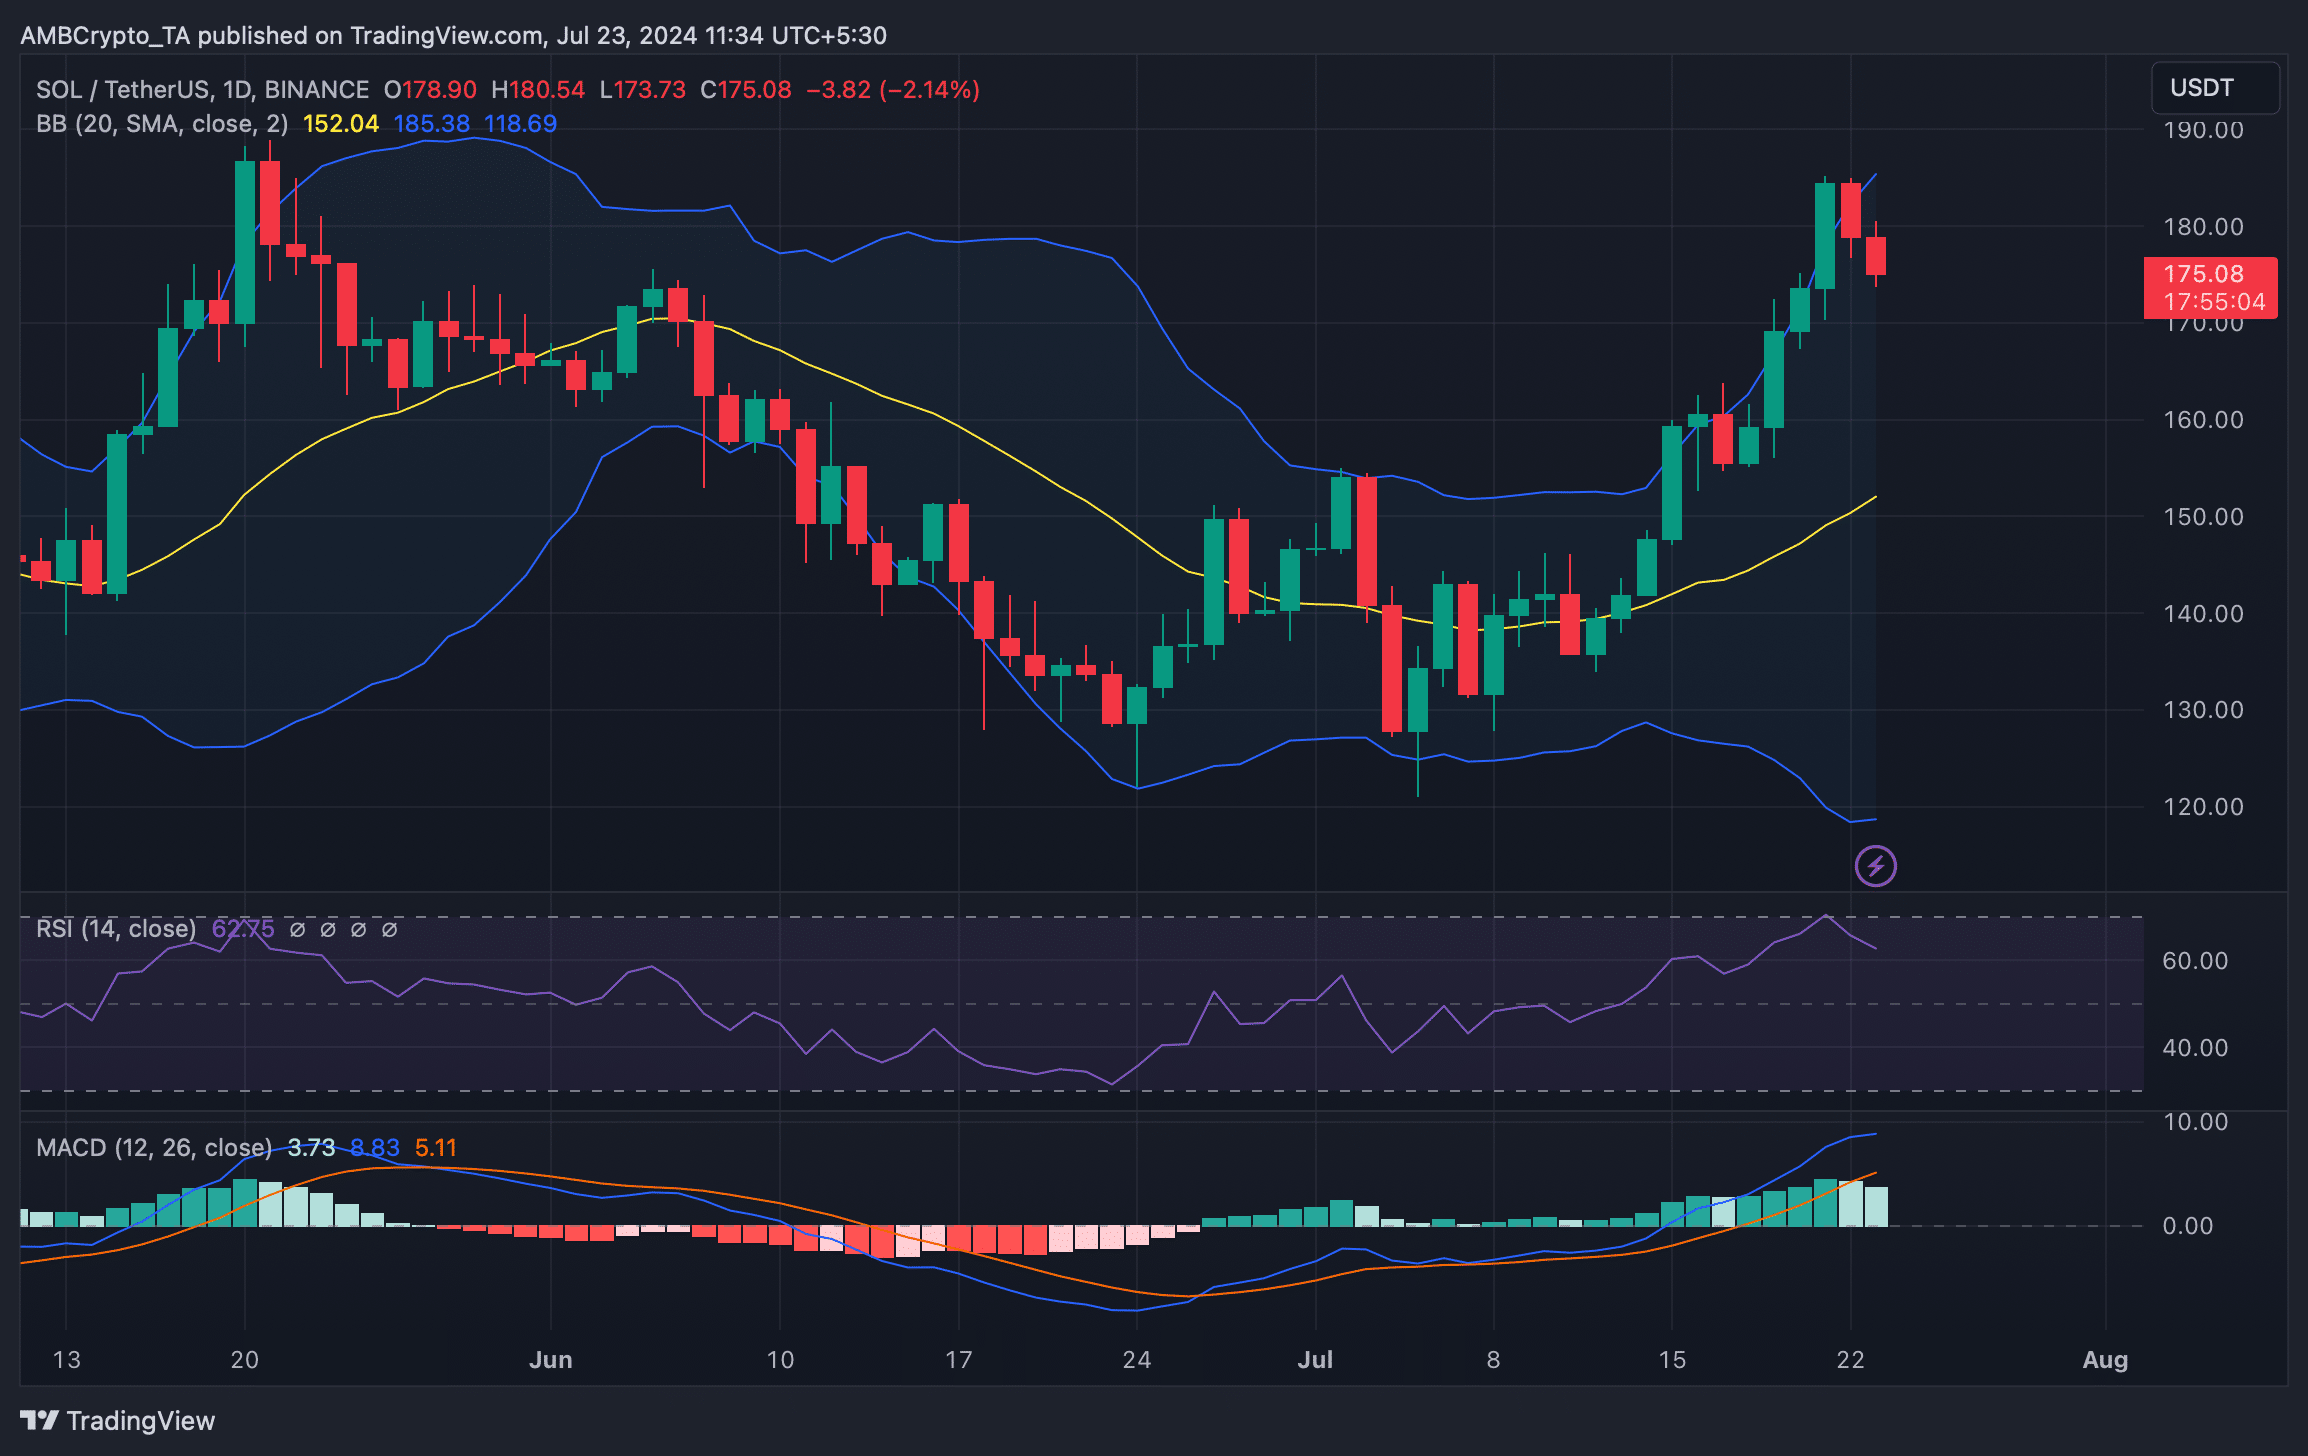
Source: TradingView
Is your portfolio green? Check out the SOL Profit Calculator
Our analysis of Hyblock Capital’s data revealed that if the bears take control of the market, then it won’t be surprising to see SOL dropping to $166.
However, in the event of a continued bull rally, investors might witness SOL touch $190 in the coming days or weeks.

Source: Hyblock Capital


