Solana breaks past $200: Should you cash in, or wait some more?
Solana's OI surged from $1.71 billion on the 6th of March to $2.88 billion at press time.

- Solana continued to show bullish strength.
- Trying to catch the exact top could be counterproductive for traders.
Solana [SOL] bulls refused to bow down to the bearish pressure. Even when Bitcoin [BTC] fell below the $70k level on the 15th of March, SOL was trending higher. It breached the $180 mark on that day.
Data from DefiLlama showed that Solana’s total value locked (TVL) has surged by over 80% in the last month. It also logged the highest DEX volume for the second straight day, overshadowing Ethereum [ETH].
Should investors fear a pullback, or look to ride the trend?
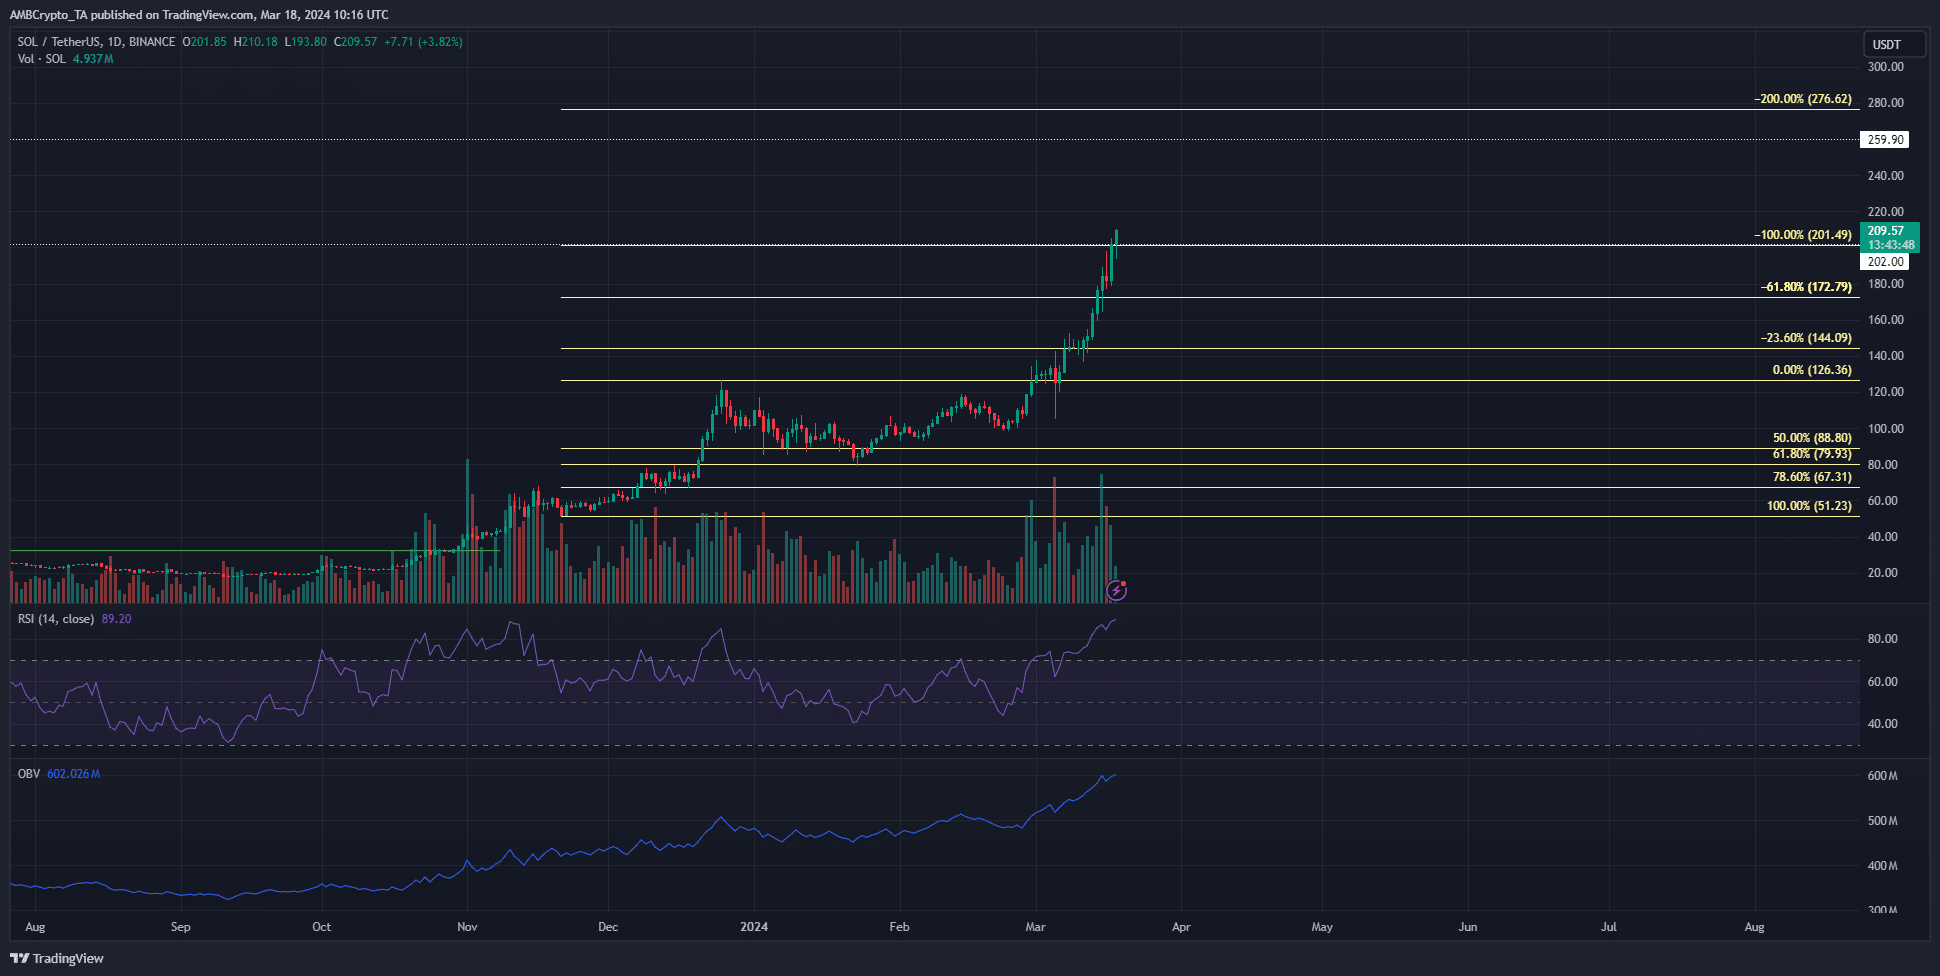
Solana’s major retracement has simply not occurred after the January drop to $79. The RSI on the daily chart was at 88, deep in the overbought territory.
While it does not indicate a pullback is imminent, it highlights overheated conditions.
The OBV trended higher since late January. The buying volume has been phenomenal, and SOL has gained 26x since the 2022 low at $8. Above the$180 mark, resistance overhead was scant.
The $259 and $276 levels were areas of interest, as was the $202 region. However, this zone could be retested as support, since the market has been parabolic recently.
Analysis of the lower timeframes showed that the $178 and the $162 support levels would also be key.
A drop below these levels would indicate a bearish structure on the 1-hour timeframe and a potential shift in momentum on higher timeframes.
Speculative activity depicts manic bullishness
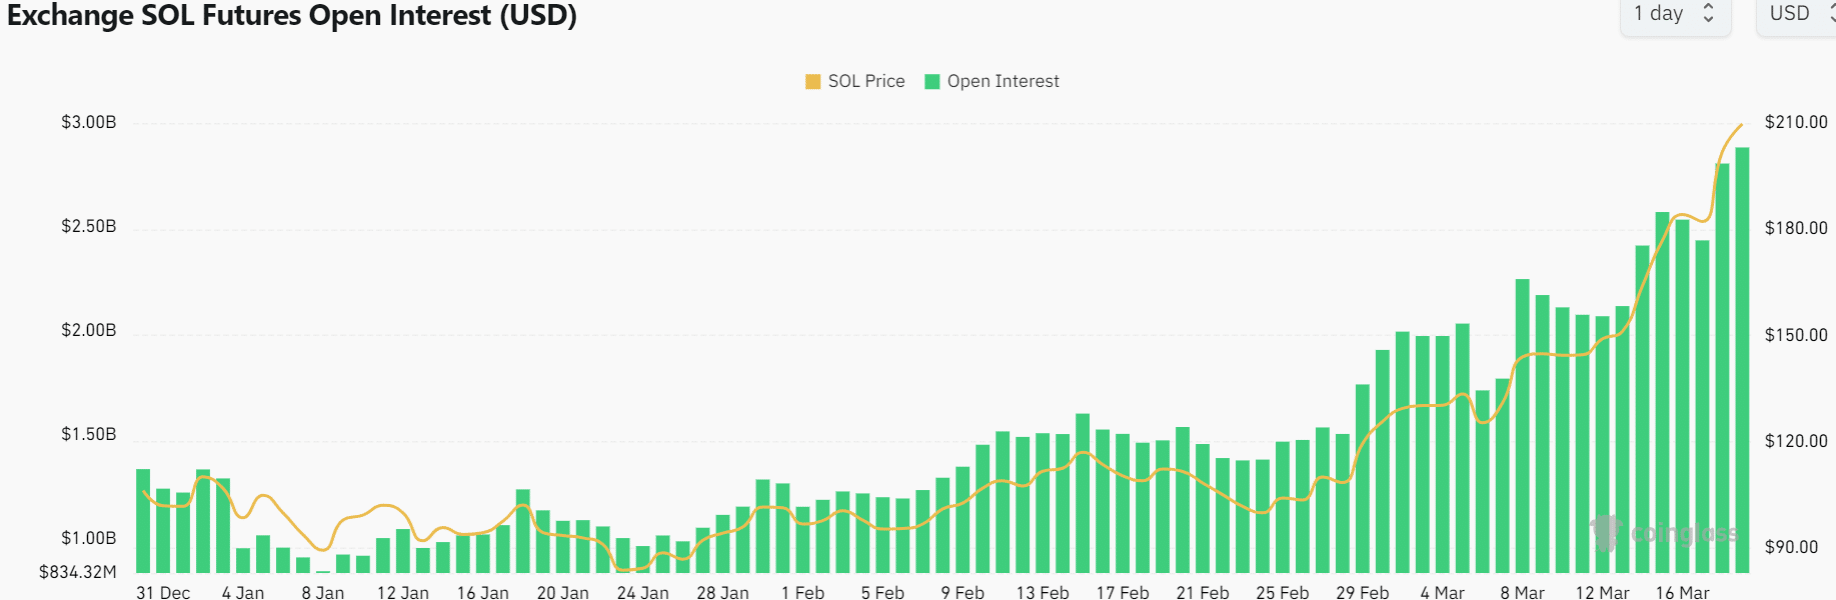
The Open Interest chart showed no signs of slowing down. According to Coinglass data, the OI behind Solana reached highs never seen before. This comes alongside a price surge from $120 to $209 in just over a month.
Is your portfolio green? Check out the SOL Profit Calculator
The OI surged from $1.71 billion on the 6th of March to $2.88 billion at press time on the 18th of March. This phenomenal rise indicated extreme greed but did not encourage short-selling.
Nor does it guarantee that a pullback is imminent. The local top was not in yet.
Disclaimer: The information presented does not constitute financial, investment, trading, or other types of advice and is solely the writer’s opinion.