

BONK eyes breakout – But price must beat THIS hurdle first
Solana
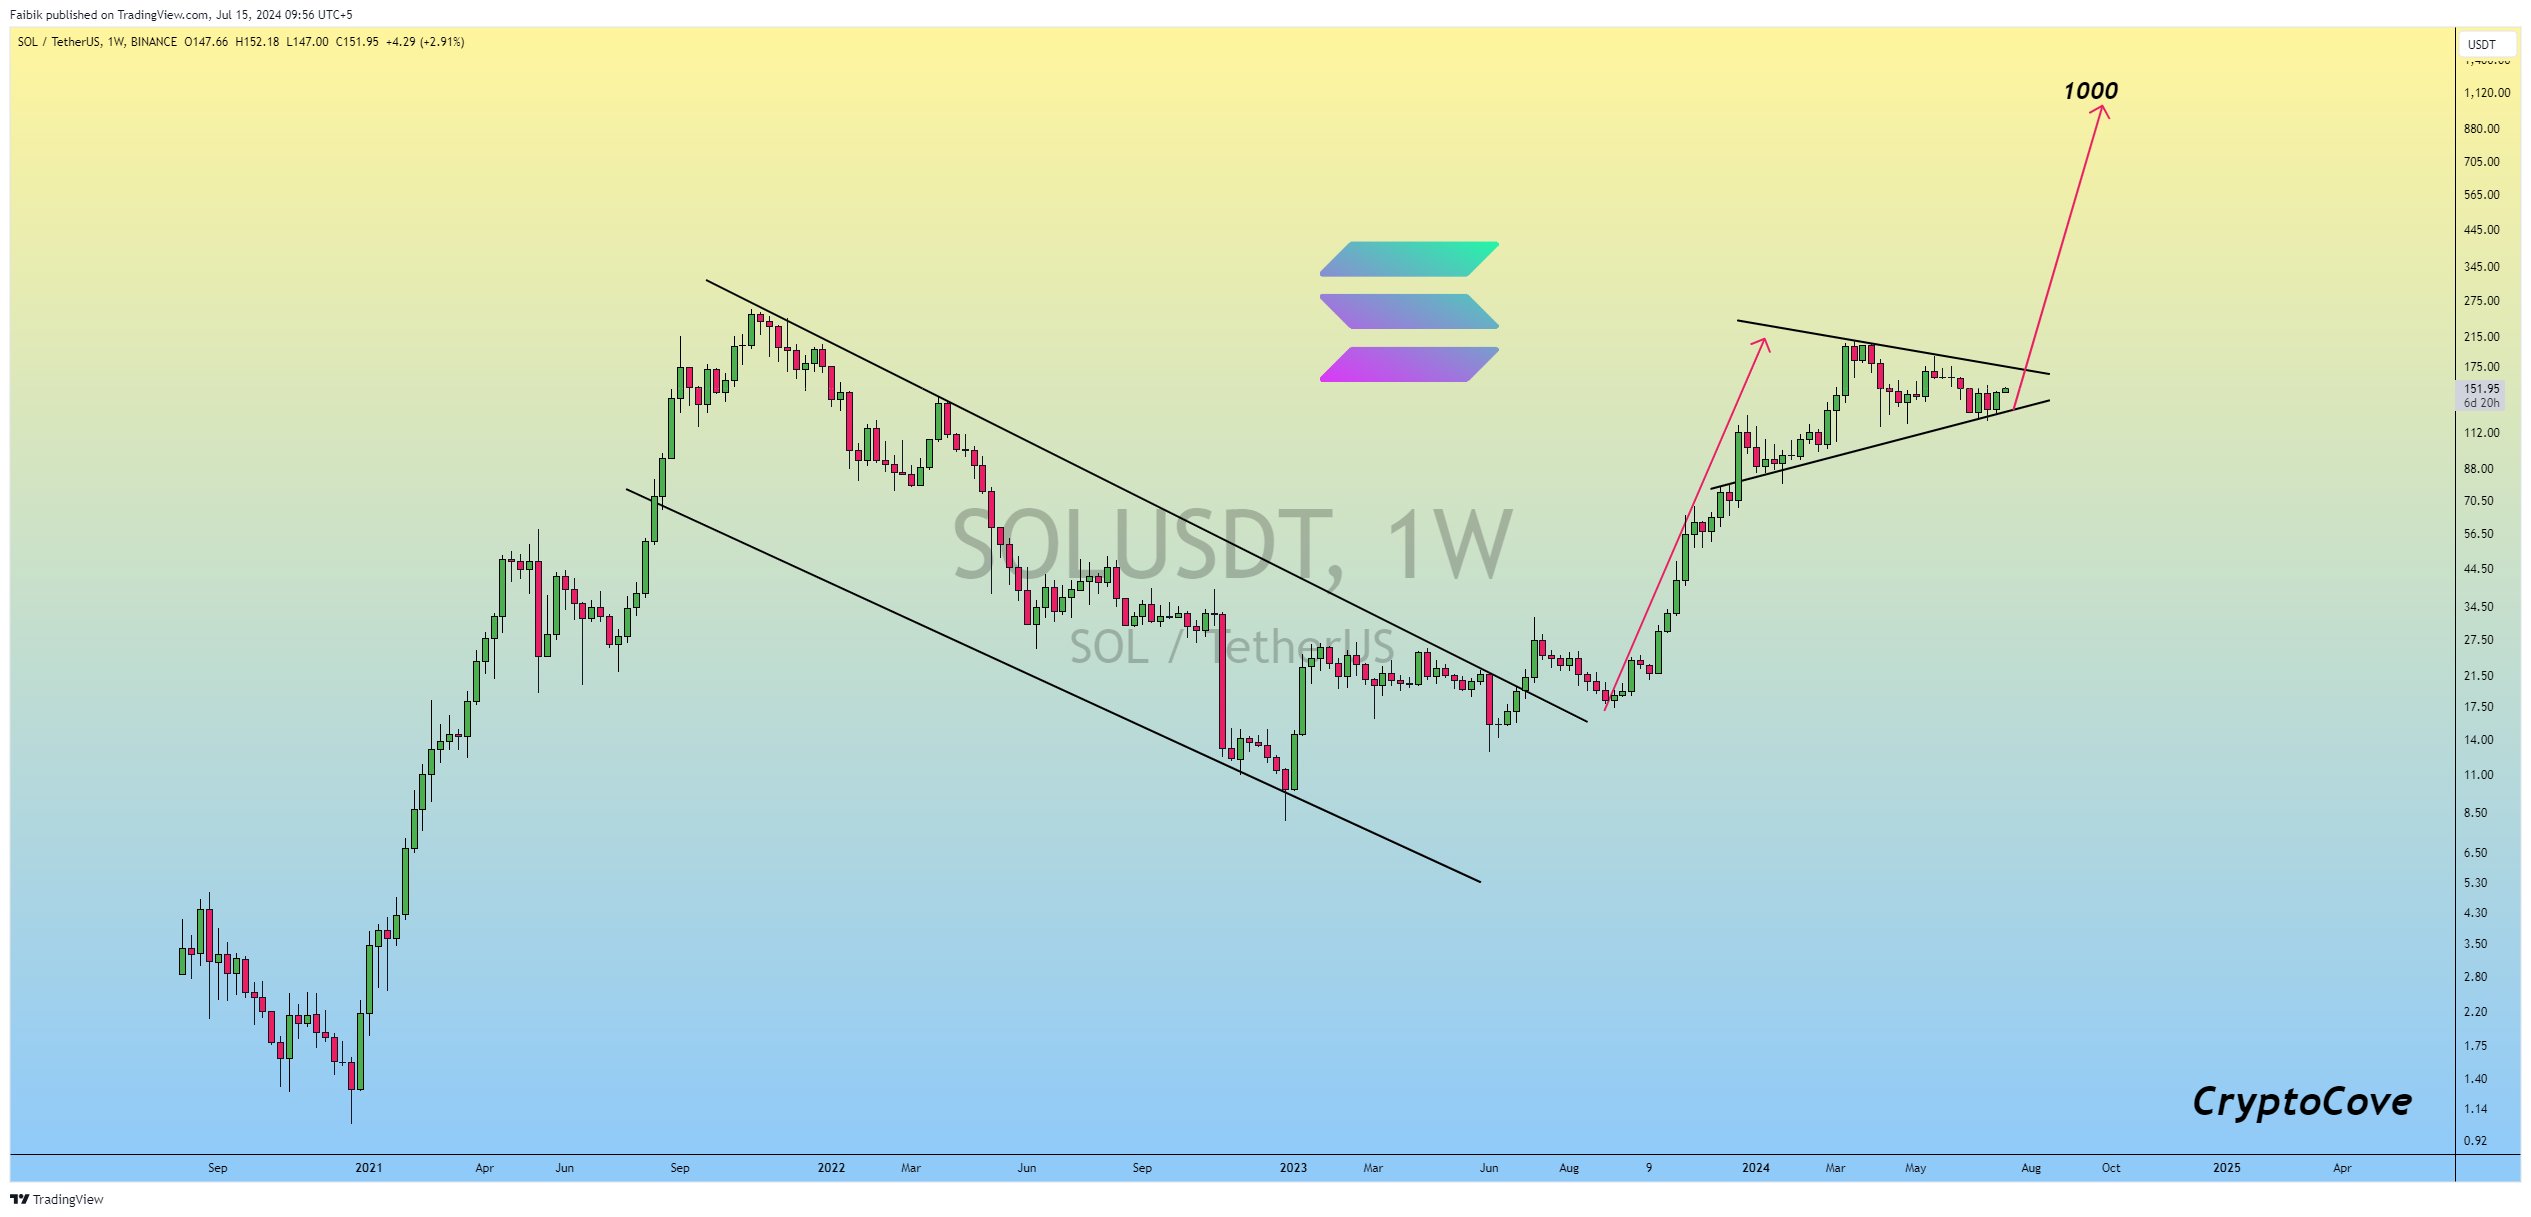
Solana can hit $1000 during its next bull run, but on some conditions
SOL’s price volatility leads to a peak of $150, with experts predicting a bullish rally towards $1000.


- Experts projected that SOL could hit $1000, supported by strong buying pressure.
- SOL recovered to $150 at press time, with the potential to reach 50% of ETH’s market cap.
Over the past week, Solana [SOL] has shown notable volatility. Initially fluctuating between $135 and $140, the price dipped below $135 on the 12th of July.
However, a recovery began on the 14th of July, leading to a peak of just over $150 on the 15th of July.
At the time of this writing, SOL’s price traded at $152.12
, with a 24-hour trading volume of $2,480,830,713, marking a 4.93% increase in the last 24 hours and an 8.64% increase over the past seven days.Expert predictions and market sentiment
Captain Faibik stated on X (formerly Twitter),
“I believe $SOL #Solana will hit the $1,000 mark in the upcoming Bullish Rally…”
This optimistic projection aligned with the historical growth trajectory of Solana, which saw expansion from late 2020 to mid-2021.
Following a prolonged downtrend until early 2023, Solana has been on a recovery path, breaking out of a descending channel and forming an ascending pattern.
Daniel Cheung also shared his insights on X (formerly Twitter), noting,
“$SOL closed the week bullish — things are starting to look exciting again. My gut tells me we are playing on a similar fractal to Q3’21 with shades of Q4’20 — in both cases the most explosive returns were just around the corner.”
Cheung believed that Solana will remain a key asset due to its accessibility and potential for an ETF, further fueled by the current political climate.
He added,
“Many were shaken out by flip-flopping KOLs recently and only few had the conviction and patience to see this through. I am still a believer that SOL can likely get to 50% of ETH’s market cap this cycle.”
Moreover, the transaction volume has remained relatively stable, with gradual increases and occasional fluctuations.
According to DefiLlama, the number of 24-hour active addresses stands at 926,444, indicating strong user engagement and network activity.
SOL technical analysis indicators
The Bollinger Bands (BB) indicator suggested that SOL traded mostly between the upper and middle bands, indicating a bullish trend.
The price exhibited noticeable volatility expansion, particularly in the early trading hours, and touched the middle band at one point, suggesting brief consolidation or a minor correction before potentially resuming upward movement.
Furthermore, the Moving Average Convergence Divergence (MACD) indicator showed a bullish trend.
A bullish crossover occurred with the MACD line moving above the signal line, which was maintained for several hours, supporting the rising price trend.
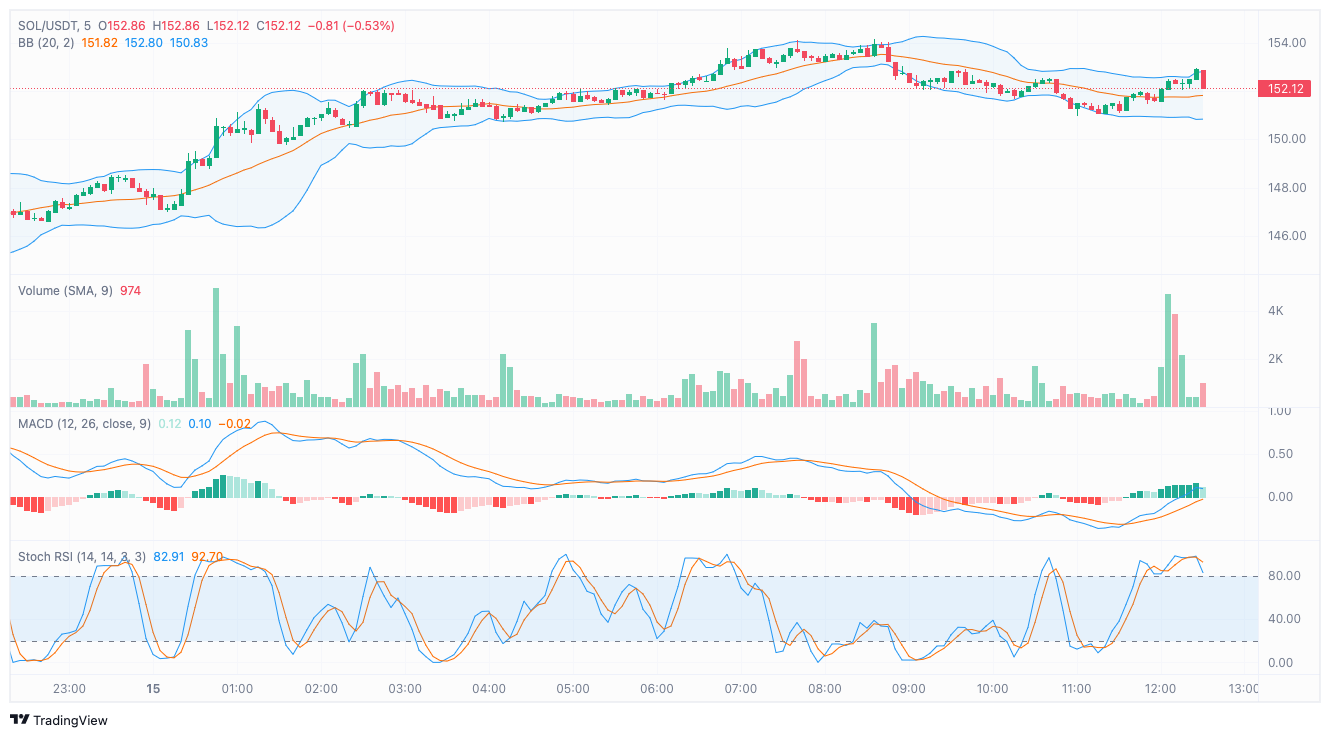
Source: TradingView
However, the MACD histogram showed weakening momentum as the MACD line approached the signal line, signaling a possible short-term bearish phase.
Is your portfolio green? Check out the SOL Profit Calculator
At press time, the Stochastic RSI indicator frequently signaled overbought conditions, peaking above 80 multiple times. These peaks indicated strong buying pressure throughout the trading session.
This consistent pattern of reaching overbought levels suggested that SOL experienced robust demand, contributing to its recent price increase.


