Solana, Cosmos, GALA Price Analysis: 25 January

After hitting its five-month low on 24 January, Solana saw a pullback from its immediate supply zone. Now, it flashed low volatility while eyeing at $83-mark for support.
On the other hand, although Cosmos saw an over 8% 24-hour gain, it formed a bearish flag and pole. GALA too refrained from hopping off the bearish bandwagon at press time.
Solana (SOL)
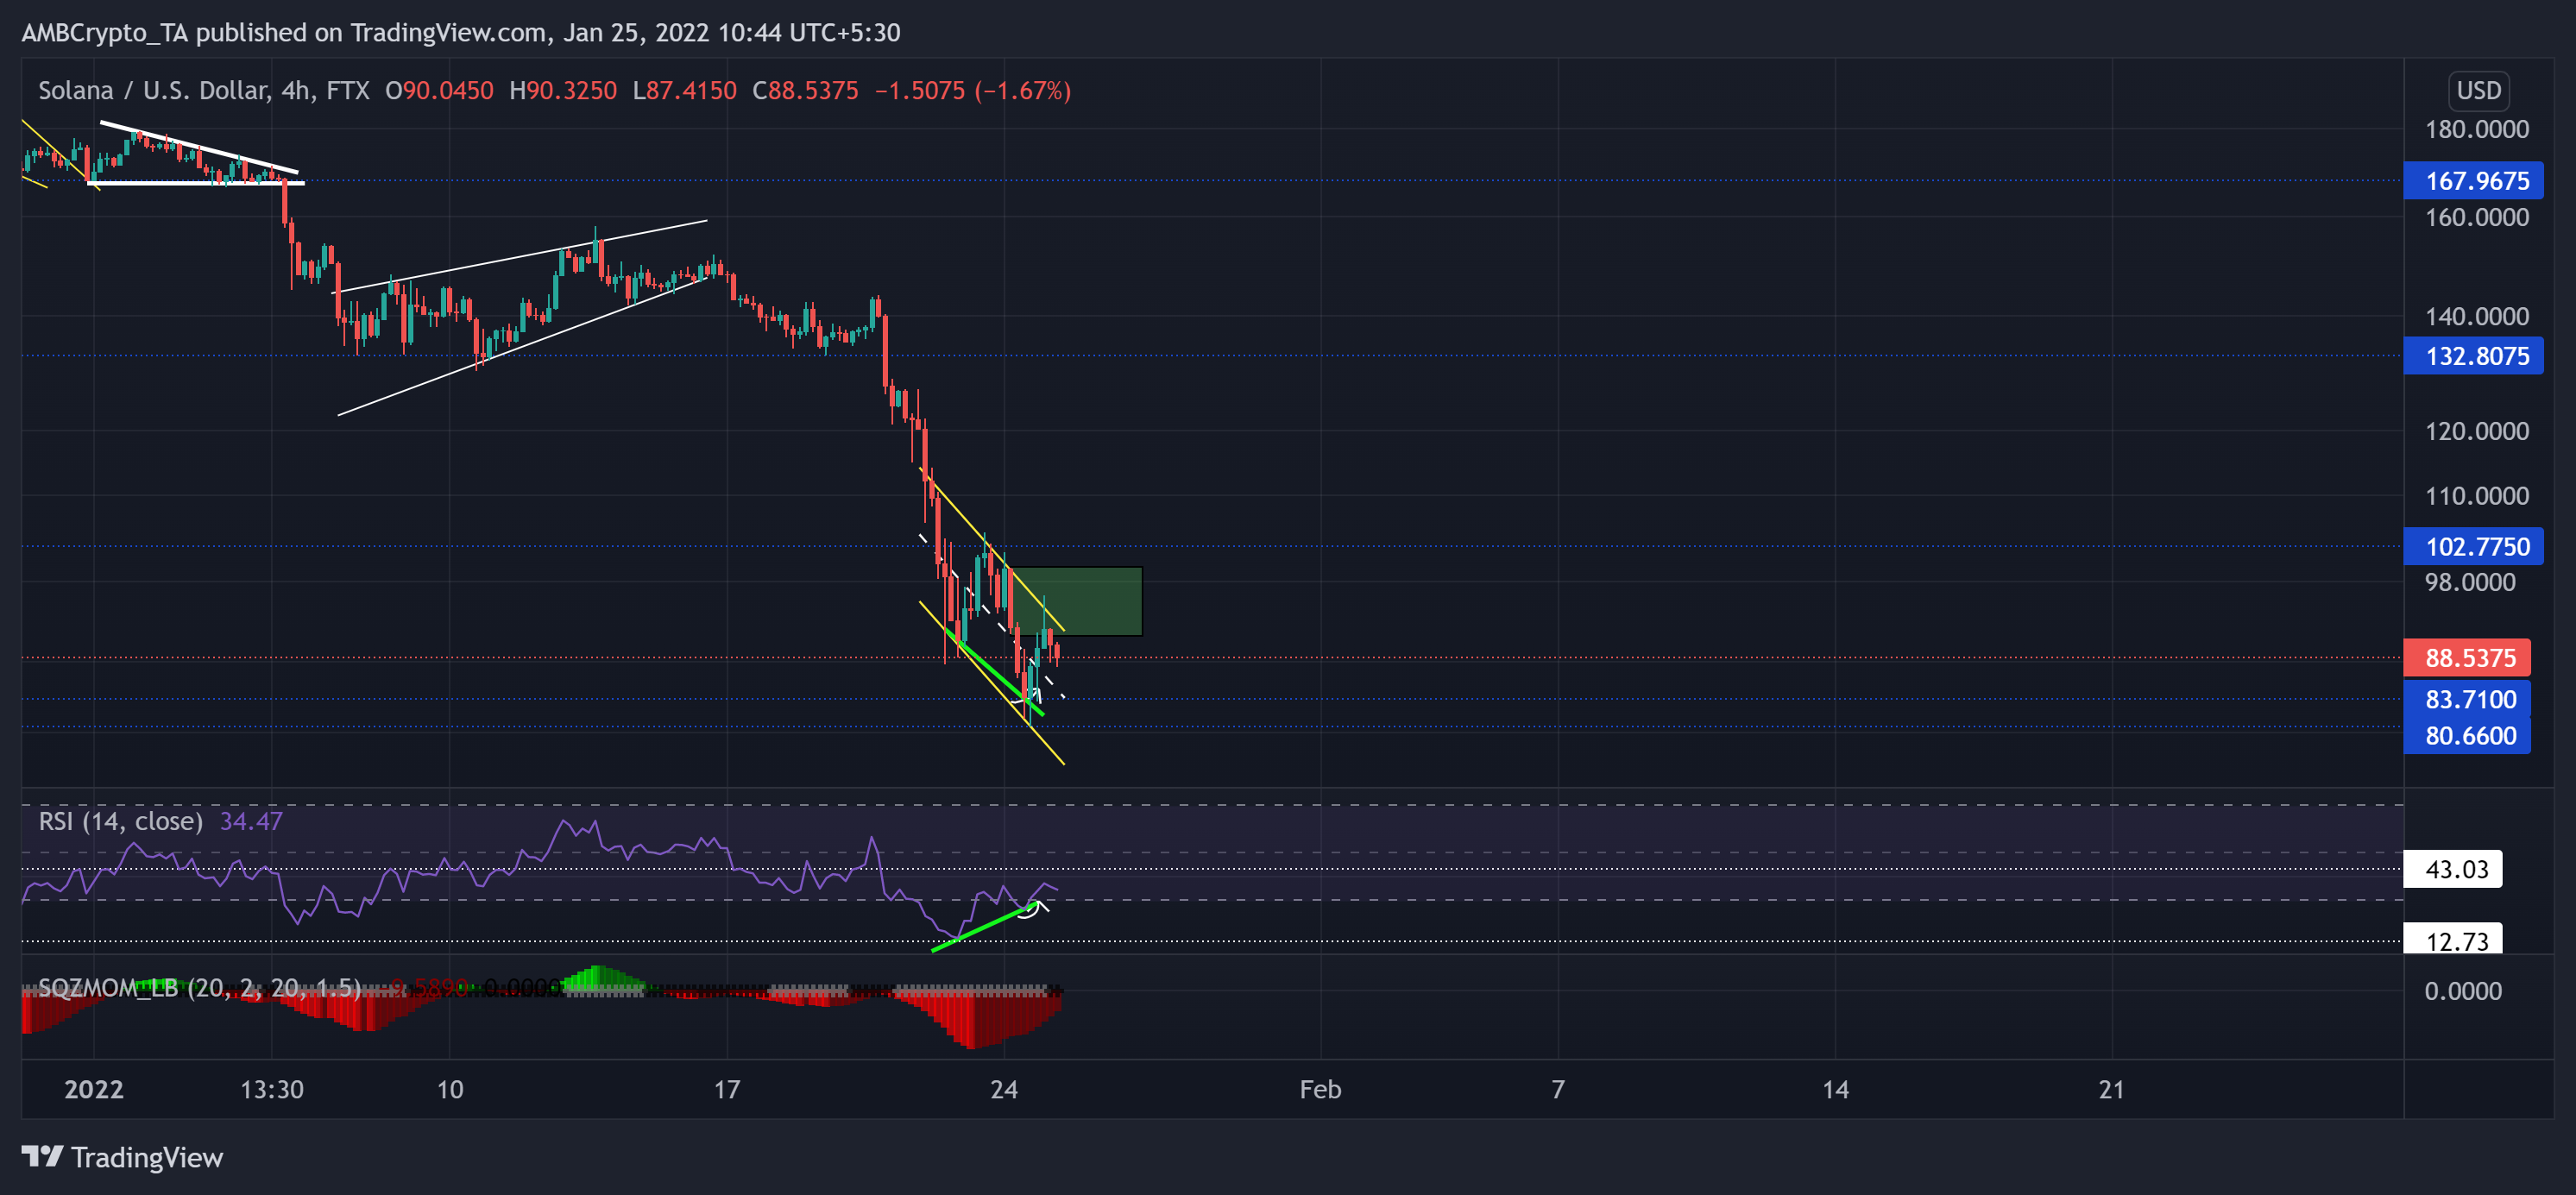
SOL bears gained more thrust after breaching the $167.96-mark while the alt struggled to keep up with their increasing pressure. On top of it, The 21 January sell-off led to alt to lose the $132-level as it registered a 43.79% loss. As a result, it saw a down-channel that marched toward its five-month low on 24 January.
The gains over the past day halted at its immediate supply zone (rectangle, green) as the bears now try to test the $83-level.
At press time, the alt traded at $88.54. After plunging to its record low, the bearish RSI upturned from the oversold territory. It bullishly diverged (green trendline) with the price while the coin slightly recovered on the last day. On the other hand, The Squeeze Momentum Indicator now displayed black dots. This reading entailed a near-term low volatility phase.
Cosmos (ATOM)
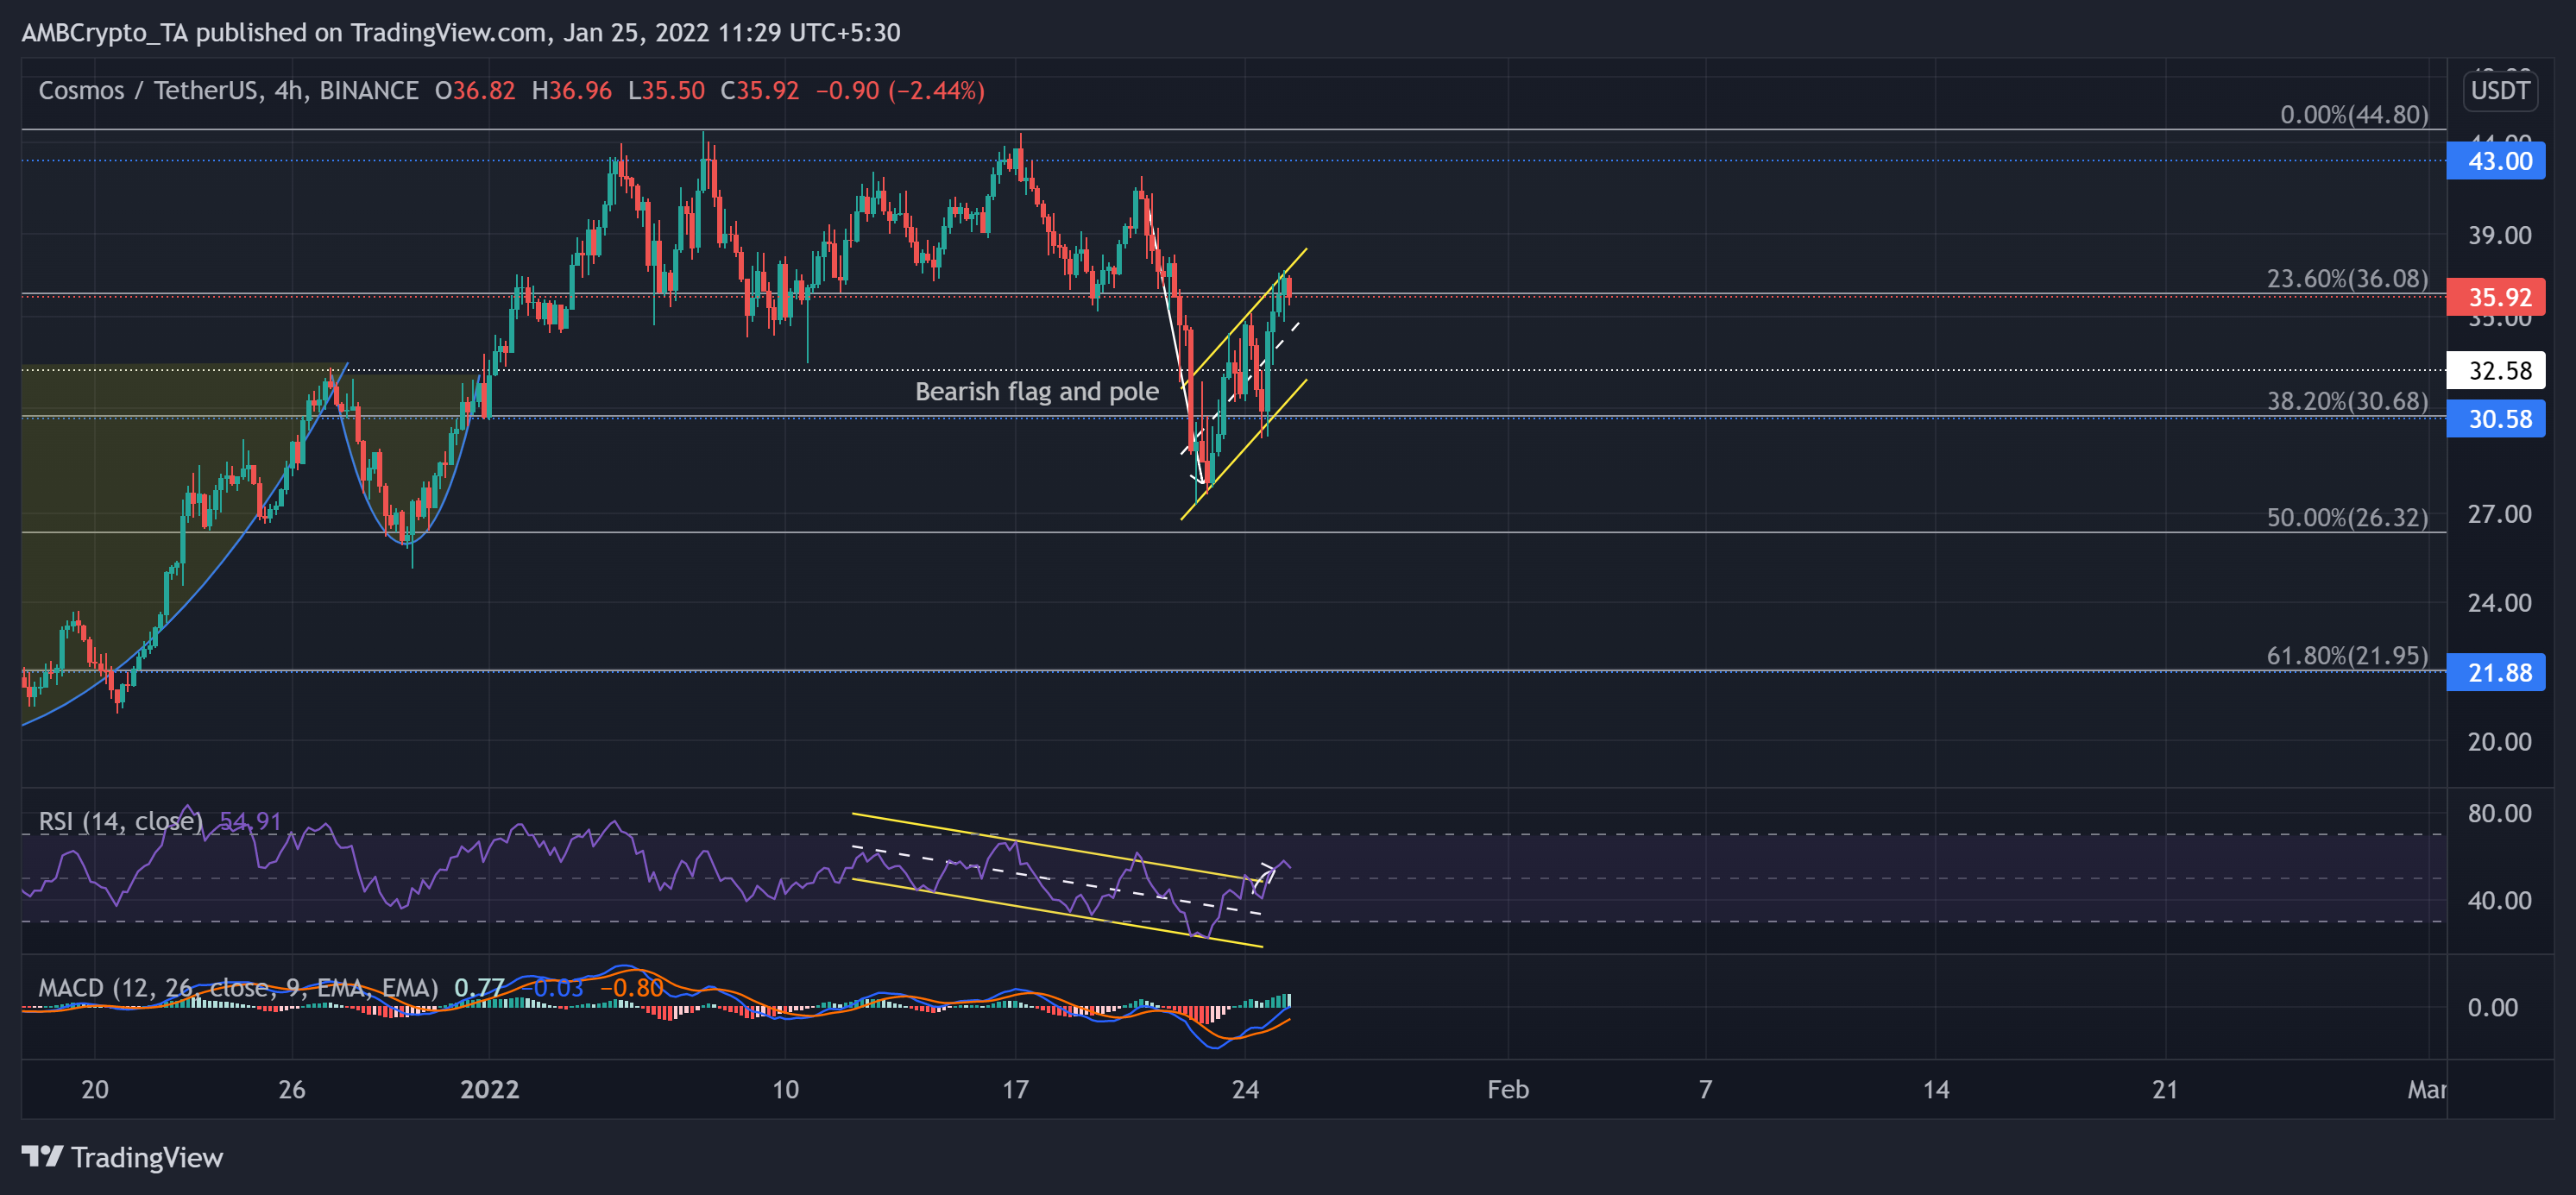
After an inverse head and shoulder breakout on 3 January, the bears tested the 23.6% Fibonacci level for 18 days. They ensured the $43-mark resistance and kept exerting pressure. The recent sell-off led ATOM to lose 35.6% of its value until 22 January.
Over the past two days, bulls reclaimed 38.2% while forming a bearish flag and pole on its 4-hour chart. Now, the immediate testing grounds for the bears stood at the lower trendline of the channel. This level coincided with the $32.5-mark support.
At press time, ATOM was trading at $35.92. The RSI saw a classic down-channel (yellow) breakout. It finally crossed the half-line but looked slightly weak at the time of writing. Contrarily, the MACD’s histogram found a close above the equilibrium, but its lines still needed a close above the zero line to confirm the bullish vigor.
GALA
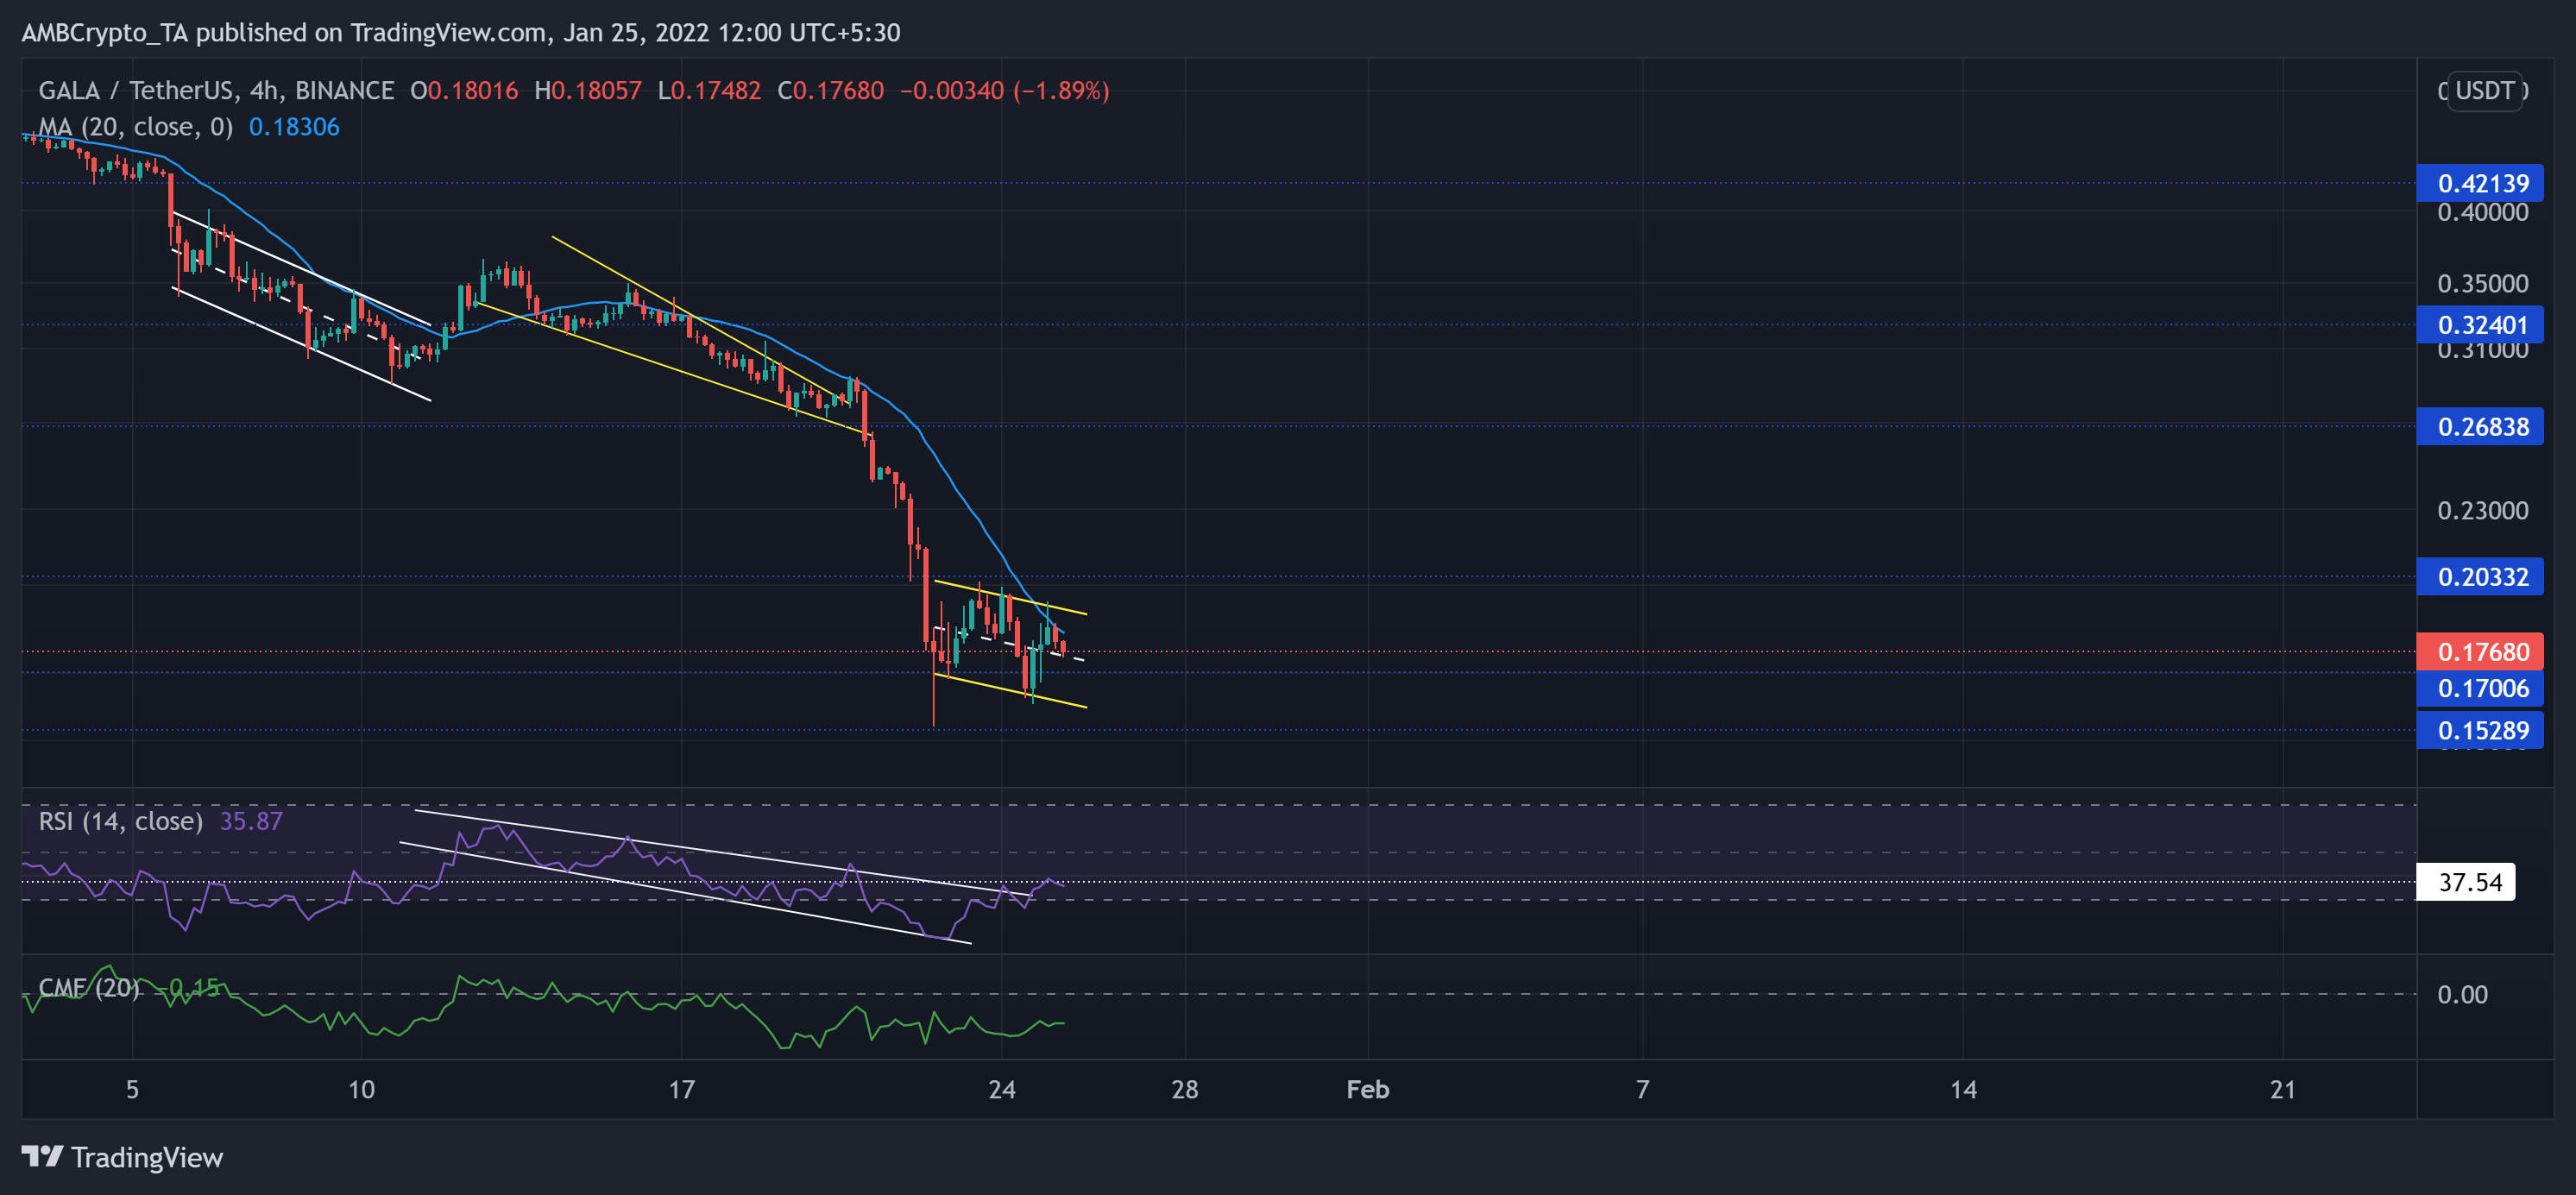
GALA persistently marked lower peaks and troughs while losing the $0.421-mark support on 5 January. Then, it even lost the $0.32-level only to witness another sell-off on 21 January.
GALA lost 58.16% of its value (from 12 January) until it touched its two-month low on 22 January. The immediate testing point for the bulls continued to be at the 20-SMA (cyan).
At press time, GALA was trading at $0.1768. The RSI oscillated in a descending broadening wedge for the past 12 days. Although it broke out of it, it could not cross the 37-mark. Also, the CMF continued to depict weak signals as it refused to cross the zero line for the past 11 days now.


