
Ethereum smashes local highs in Japan, Korea – Is a move to $4,500 next?

- SOL’s short and long-term prospects depend on breaking two significant resistance levels
- An uptick to over $188 in the short term seems feasible
Over the last few weeks, SOL’s price charts have seen mixed performances, with its monthly and weekly metrics showing gains of just 7.64% and 5.38%, respectively. However, it encountered a daily decline of 1.49% after meeting a resistance line.
Despite these fluctuations, the market sentiment has been volatile lately, with forecasts turning from bearish to more optimistic.
Resistance levels challenge SOL’s upward momentum
At the time of writing, SOL was trading within a consolidation phase, confined by clearly defined resistance levels at the upper, midrange, and lower boundaries.
The trajectory of SOL, both in the short and long-term, is influenced significantly by the midrange and upper resistance levels. These have historically triggered price declines. A sustained rally for SOL will necessitate breaking above the upper boundary line.
In the short term, SOL faces resistance at the midrange, which has previously led to price drops. Overcoming this level could propel it towards the upper boundary, potentially hitting the $188-mark, the upper bound of the consolidation channel.
However, failure to breach this resistance could cause the price to fall to $126 or even lower.
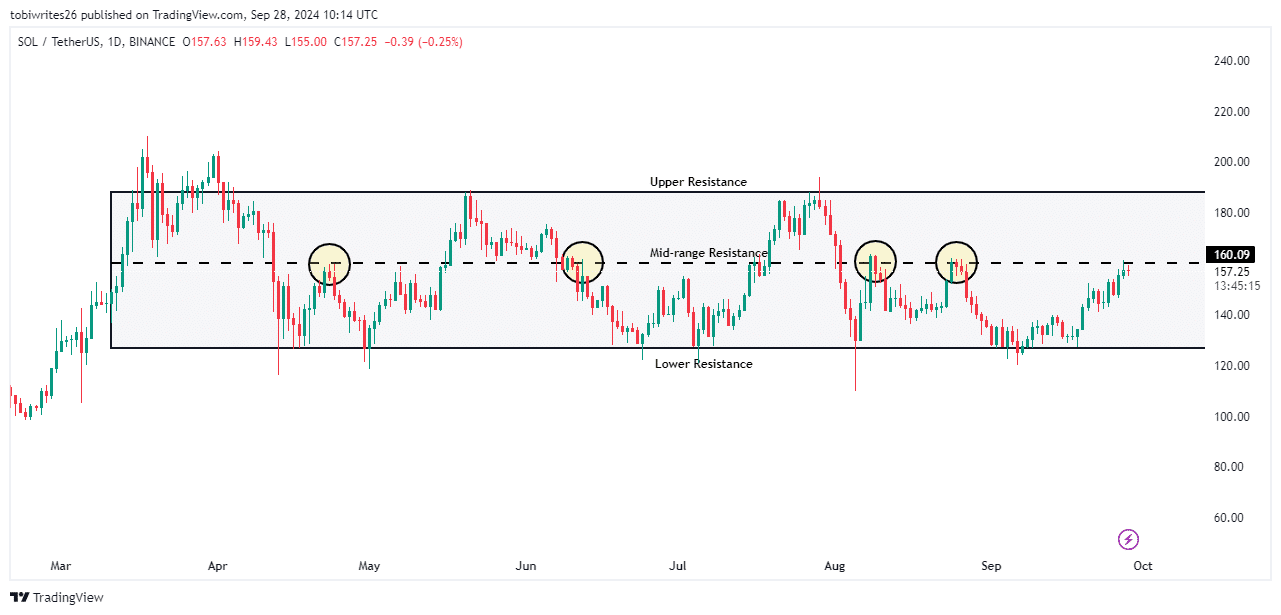
Source: Trading View
Despite previous instances where this resistance zone has catalyzed sell-offs, AMBCrypto’s analysis suggested that SOL is likely to make a push towards $188.
Market sentiment supports short-term rally for SOL
Market sentiment has shifted towards a bullish outlook, with AMBCrypto noting a hike in bullish activity. The same can be evidenced by short liquidations and rising Open Interest.
In fact, data on short liquidations revealed an uptick, with $3.27 million worth of short positions closed. This implied that the market has been moving contrary to short traders’ expectations and may be signaling a potential new high for SOL.
Further influencing this bullish perspective is the hike in Open Interest (OI). The same surged by $290 million from 26 September to press time.
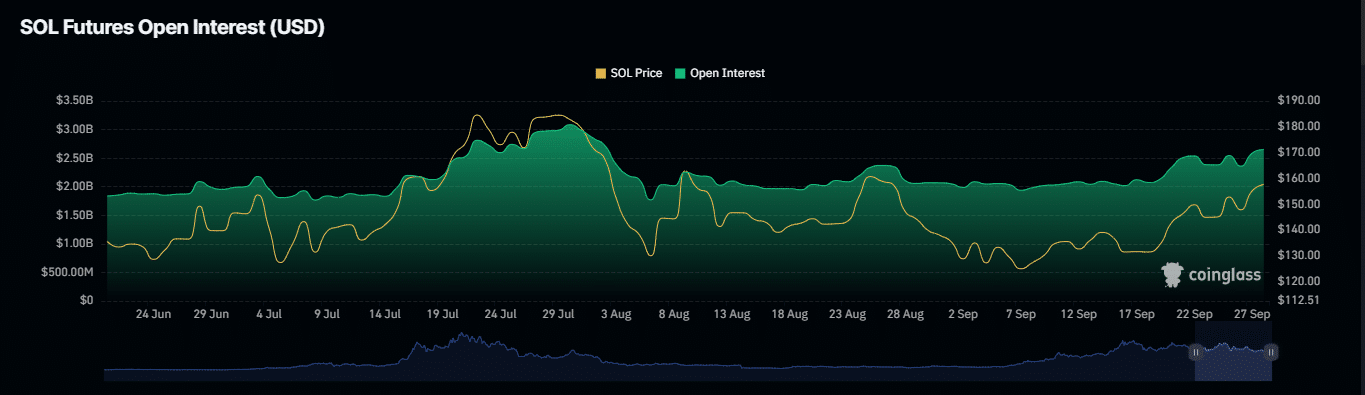
Source: Coinglass
This increase is a sign of a boost in market confidence, with investors either initiating new positions or expanding existing ones.
Additionally, AMBCrypto also identified indicators that supported a bullish advance for SOL.
Buying pressure is expected to intensify for SOL
Recent data from Coinglass revealed that the netflows for Solana, a metric that tracks the movement of the cryptocurrency into and out of exchanges, has been negative for the past seven days.
This means that more SOL is being withdrawn from exchanges, than is being deposited.
According to Coinglass, this trend indicates that investors are opting to hold onto their SOL in anticipation of a price hike. This effectively reduced the available supply on exchanges.
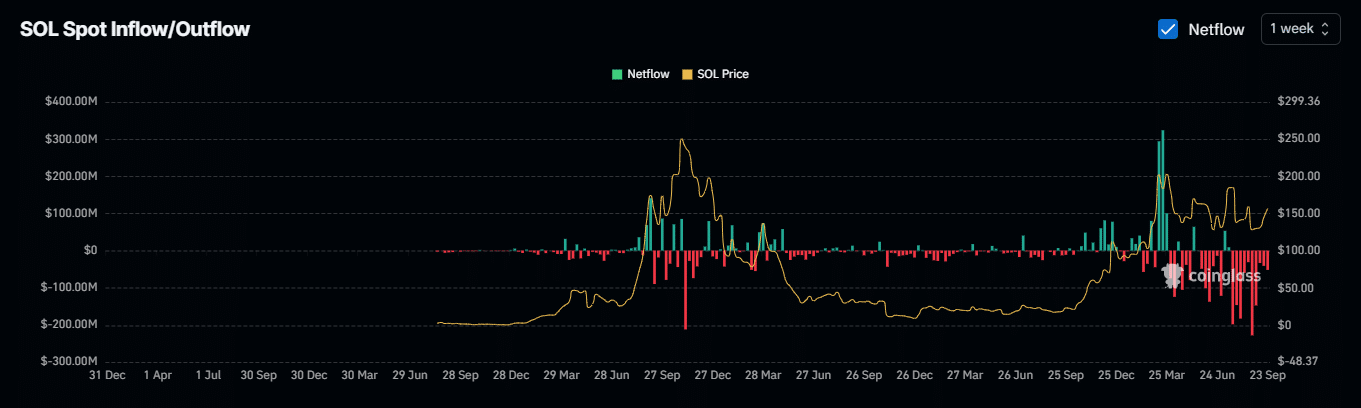
Source: Coinglass
If this trend continues, the short-term outlook for SOL would be bullish. This could assist in overcoming the prevailing resistance level it faces, potentially driving the price to $188.


