Solana eyes $200 price target – Here’s what SOL needs to do now
What is a successful breakout for Solana's price on the charts?
- Solana’s price appreciated by more than 11% in the last 7 days
- Most market indicators were bullish, but the CMF flashed bearish signs
Solana’s [SOL] price action remained influenced by the market bulls as it continued to rise over the last few days. If the market situation remains the same, then the chances of SOL reclaiming $200 in May would be high. However, there remain a few concerns for SOL’s price on the charts.
What’s going on with Solana?
Solana bulls dominated bears last week as the token’s price surged by more than 11%. In fact, according to CoinMarketCap, SOL’s price increased by 7% in the last 24 hours alone. At the time of writing, SOL was trading at $155.10 with a market capitalization of over $69.5 billion.
Crypto Tony, a popular crypto-analyst, recently posted a tweet highlighting SOL’s possible price movement, pointing out that things might get even better. As per the tweet, SOL’s price might retain its bullish momentum and can go higher on the charts.
SOL’s price seems to be fast approaching a key resistance at $160. A successful breakout above that level could result in SOL touching $200 in May.
To better understand whether that’s possible, AMBCrypto analyzed Santiment’s data. As per our analysis, positive sentiment around SOL spiked sharply on 9 May – A sign that investors are confident in SOL.
Its open interest hiked along with its price too. A rise in this metric usually indicates that the chances of the ongoing price trend continuing are high.
Also, SOL’s funding rate dropped slightly on the charts. Generally, prices tend to move the other way than the funding rate – Another sign of a possible price hike.

Concerns galore?
AMBCrypto then analyzed SOL’s daily chart to see whether technical indicators supported the possibility of SOL going above $160. According to our analysis, SOL’s price was resting above its 20-day Exponential Moving Average (EMA).
The Relative Strength Index (RSI) registered a sharp uptick too. At press time, it had a value of 54.6. Solana’s Money Flow Index (MFI) also followed a similar increasing trend. These indicators suggested that SOL’s bull rally might continue.
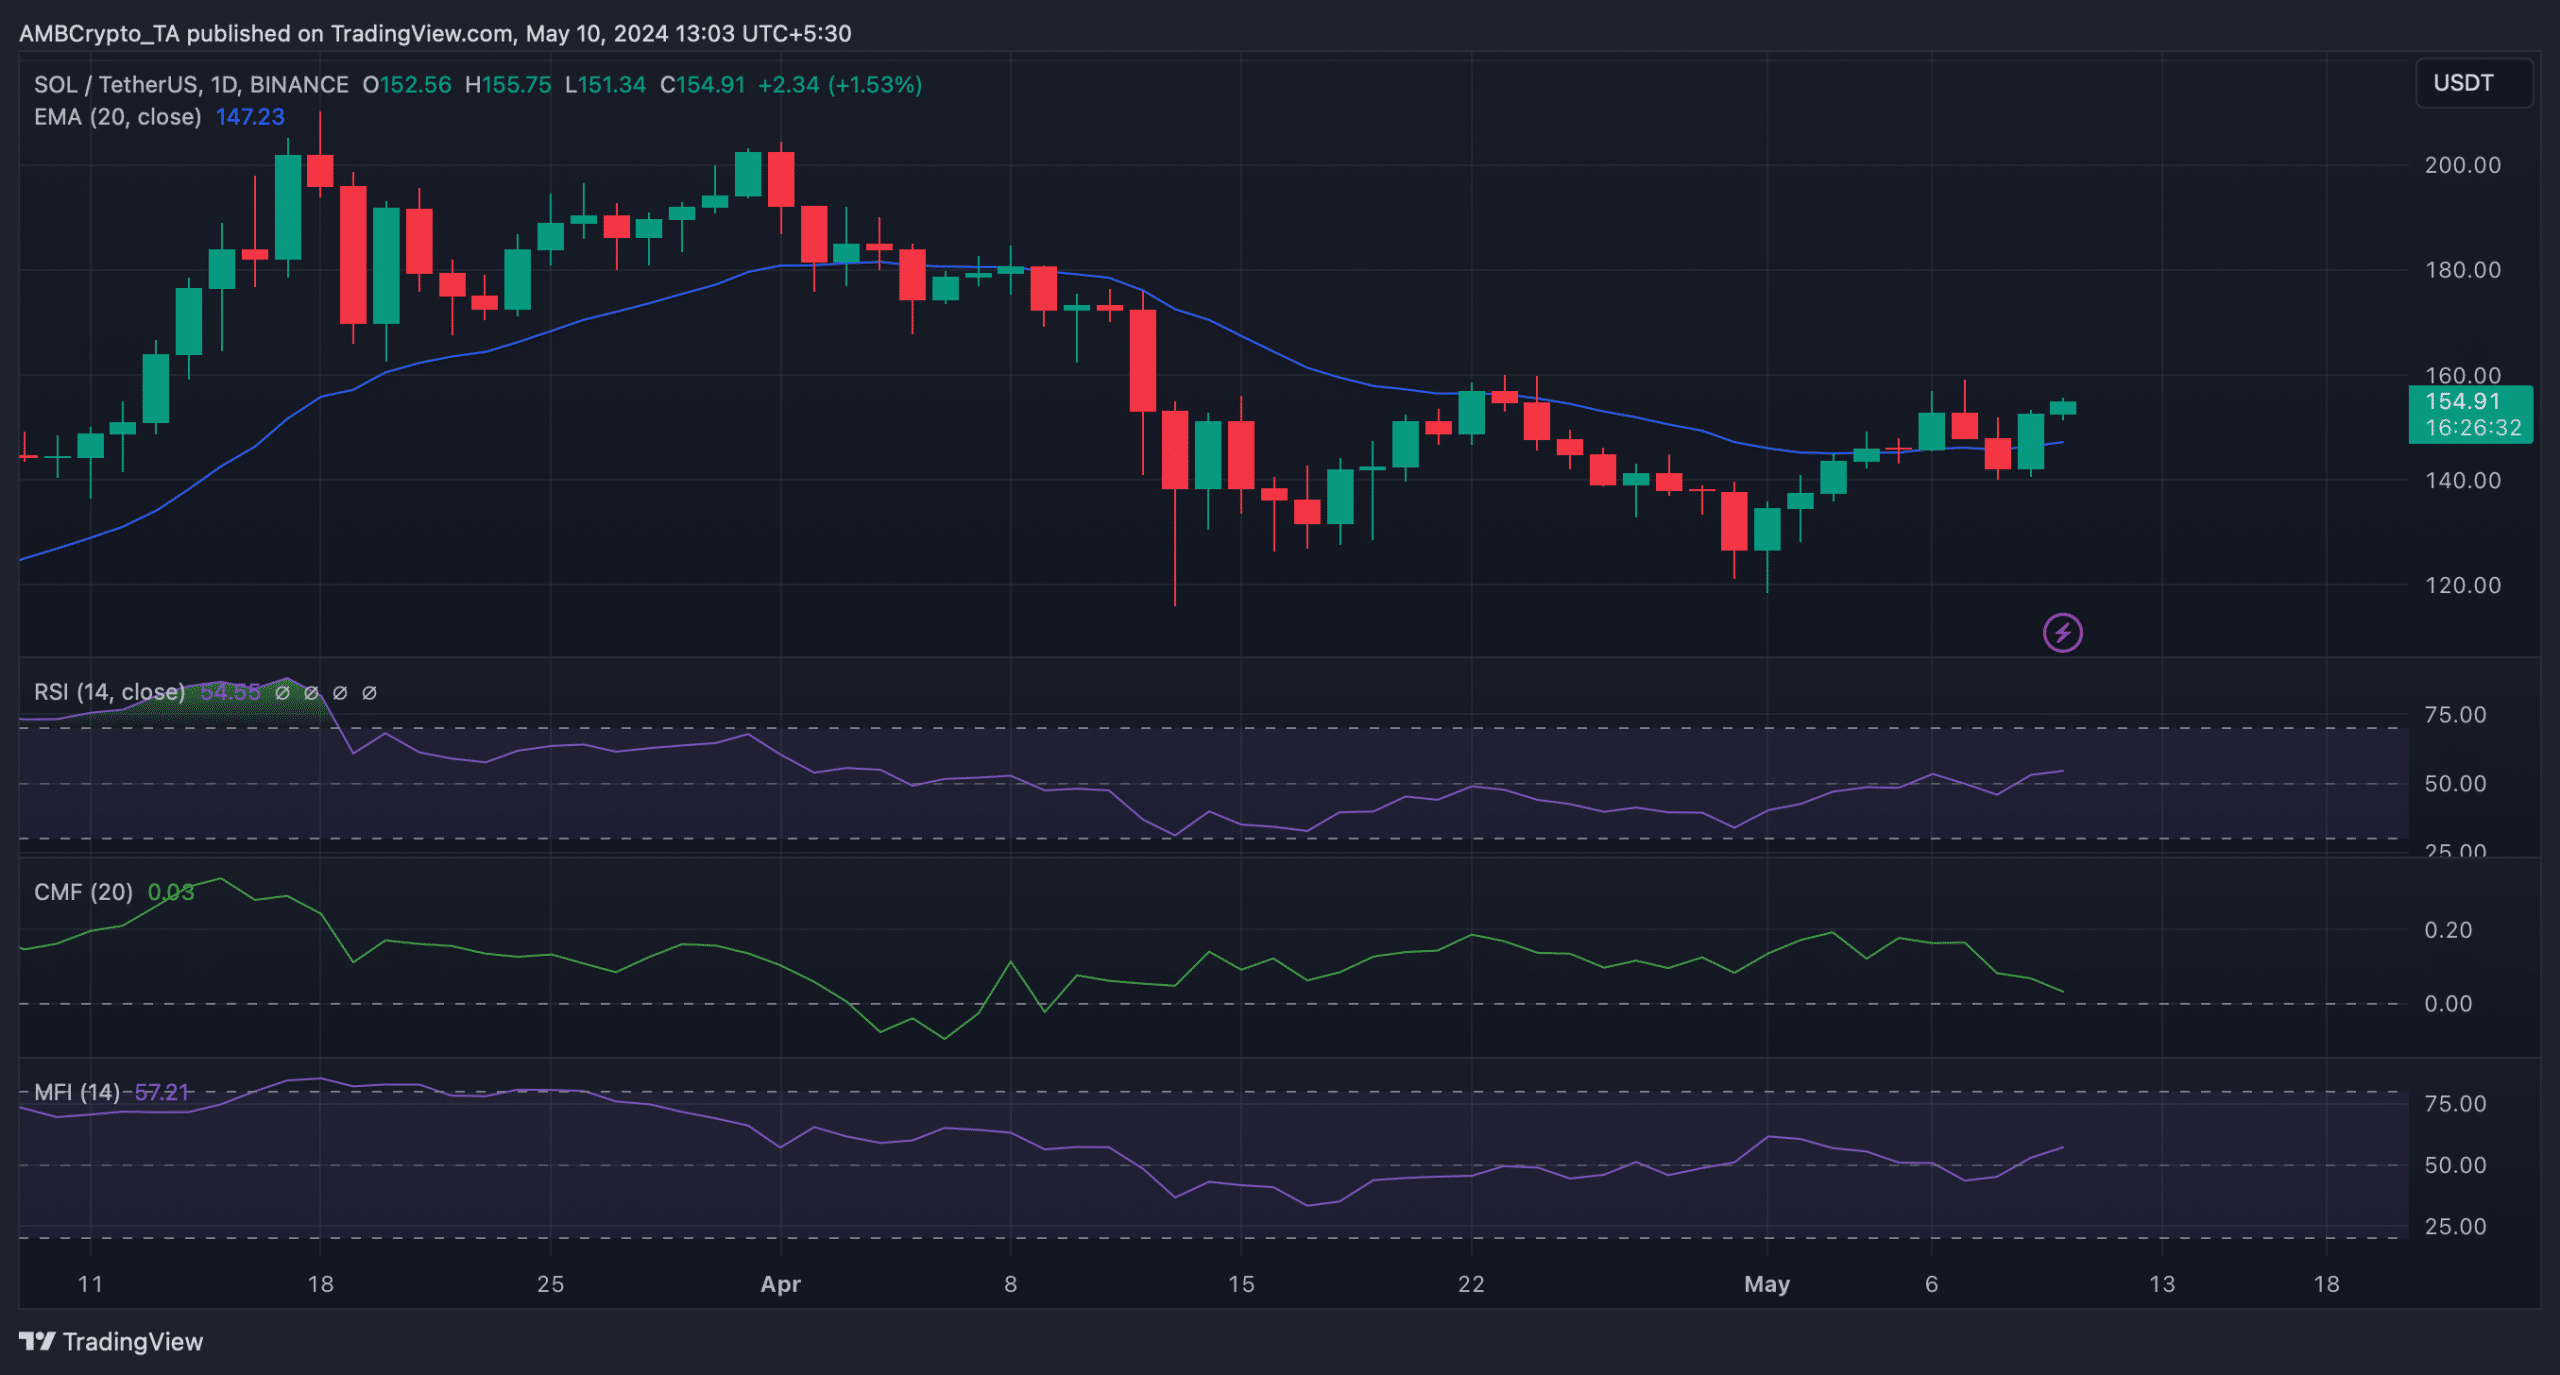
However, the Chaikin Money Flow (CMF) aligned with bears’ interest as it dropped over the last few days.
AMBCrypto had previously reported that SOL was forced to retreat from its $160-level on 7 May.
Realistic or not, here’s SOL’s market cap in BTC’s terms
If the Chaikin Money Flow’s (CMF) indication comes true, then SOL might not be able to breach that level this time either. A rejection from the resistance zone could cause a trend reversal, which can push the token’s price to $120 in the coming days.