Solana faces $75 hurdle – Can strong ETF demand push SOL higher?
Here is why Solana's sell signal may not keep the altcoin dropping for long.

Solana [SOL] rebounded above the $70 mark with price up by about 2% in the past 24 hours at press time, amidst a wider market recovery. Notably, the daily trading volume was up more than 20% to around $2.20 billion.
Solana’s rally began late last week after a TD Sequential buy signal, lifting the price about 8% from $68 to $74. However, momentum now appears to be shifting on shorter timeframes.
Solana indicator flashes sell signal
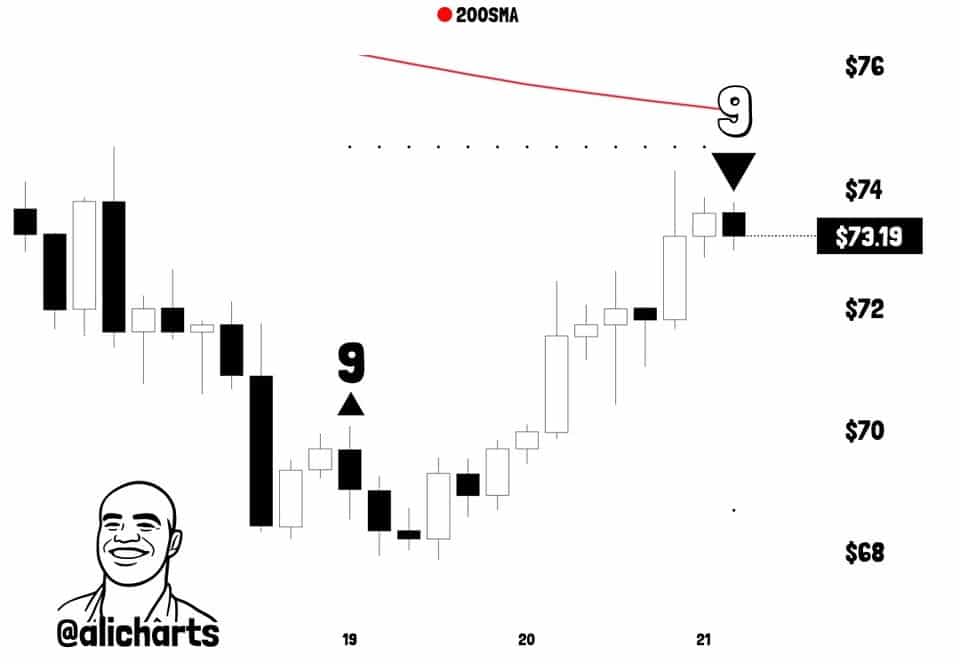
As the price of Solana rises above $70, it encounters a heavy resistance at $75, which could be a hurdle to this recovery.
Moreover, the TD Sequential has flashed sell on the 4-hour timeframe as it tests its resistance trendline. The resistance is coinciding with the 200 SMA, showing its a strong area of supply. As such, it could suggest that SOL is about to undergo a minor pullback to $72 or even lower levels.
However, SOL remains structurallybullish in the near-term. In fact, Solana was showing more strength than Ethereum [ETH], explaining why its Solana ETFs inflows and network activity remain strong contrary to what the charts could do.
Solana ETFs inflows and chain activity remain strong
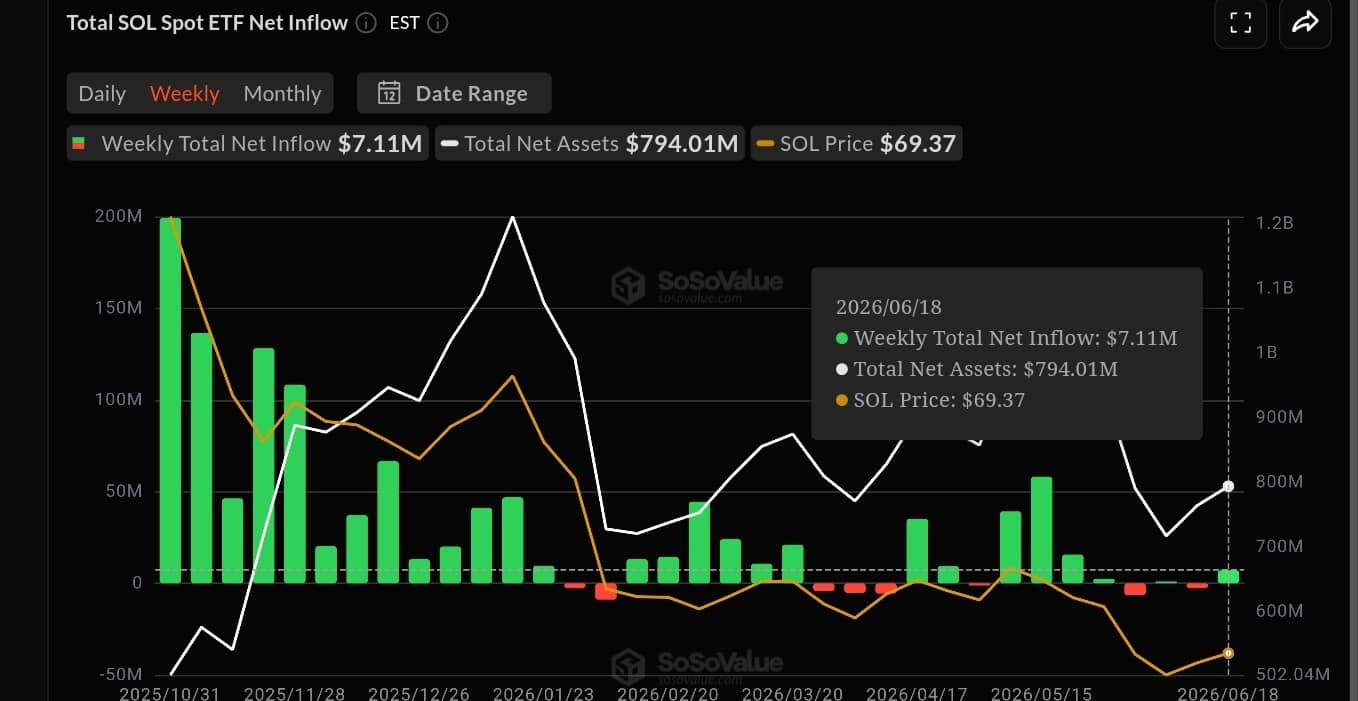
Looking at Solana Spot ETFs flows in the last week, the net inflows were more than $7.11 million. The shift from negative readings of $2.54 million to positive aligned with the price jump.
This was an indication that SOL ETFs inflows play a part in influencing its movement as they represent capital flows into and out of the ecosystem.
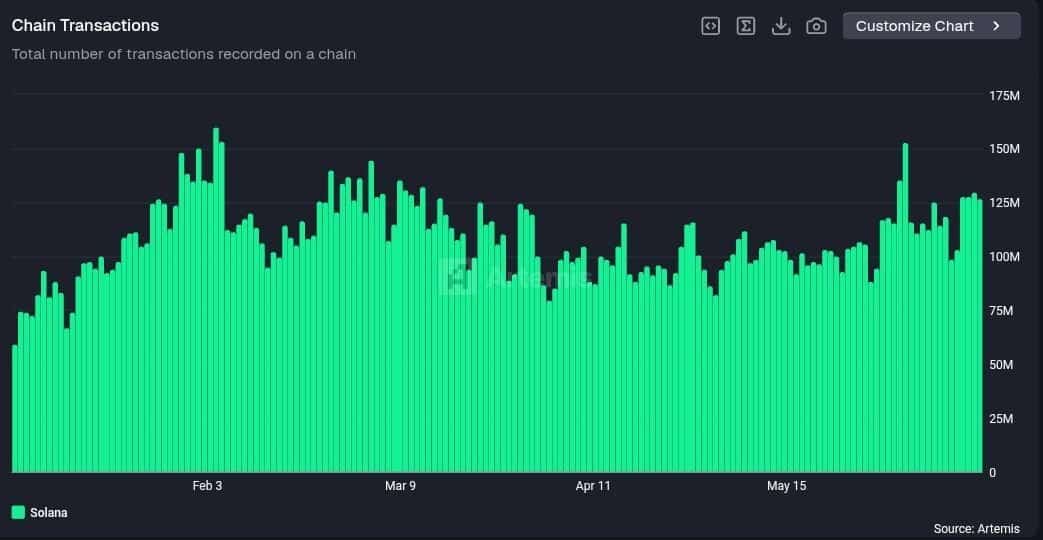
In addition to that, Solana network activity was accelerating each day. Its daily chain transactions have doubled since January, expanding from 60 million to 120 million.
Will on-chain strength help SOL breakout?
Therefore, gauging the current price outlook with the strong metrics, Solana may reset to gain strength to break past the near-term resistance.
Otherwise, if the altcoin dips below $68, previous week’s higher low, it may extend the decline to $60. However, the two movements are dependent on how the market participants behave this week.
Final Summary
- Solana price flashes a sell signal on the TD Sequential indicator after an 8% recovery suggesting an upcoming minor reset.
- SOL ETFs inflows and network activity remain strong even though price action is hinting at potential bearish reversal in the near-term.


