
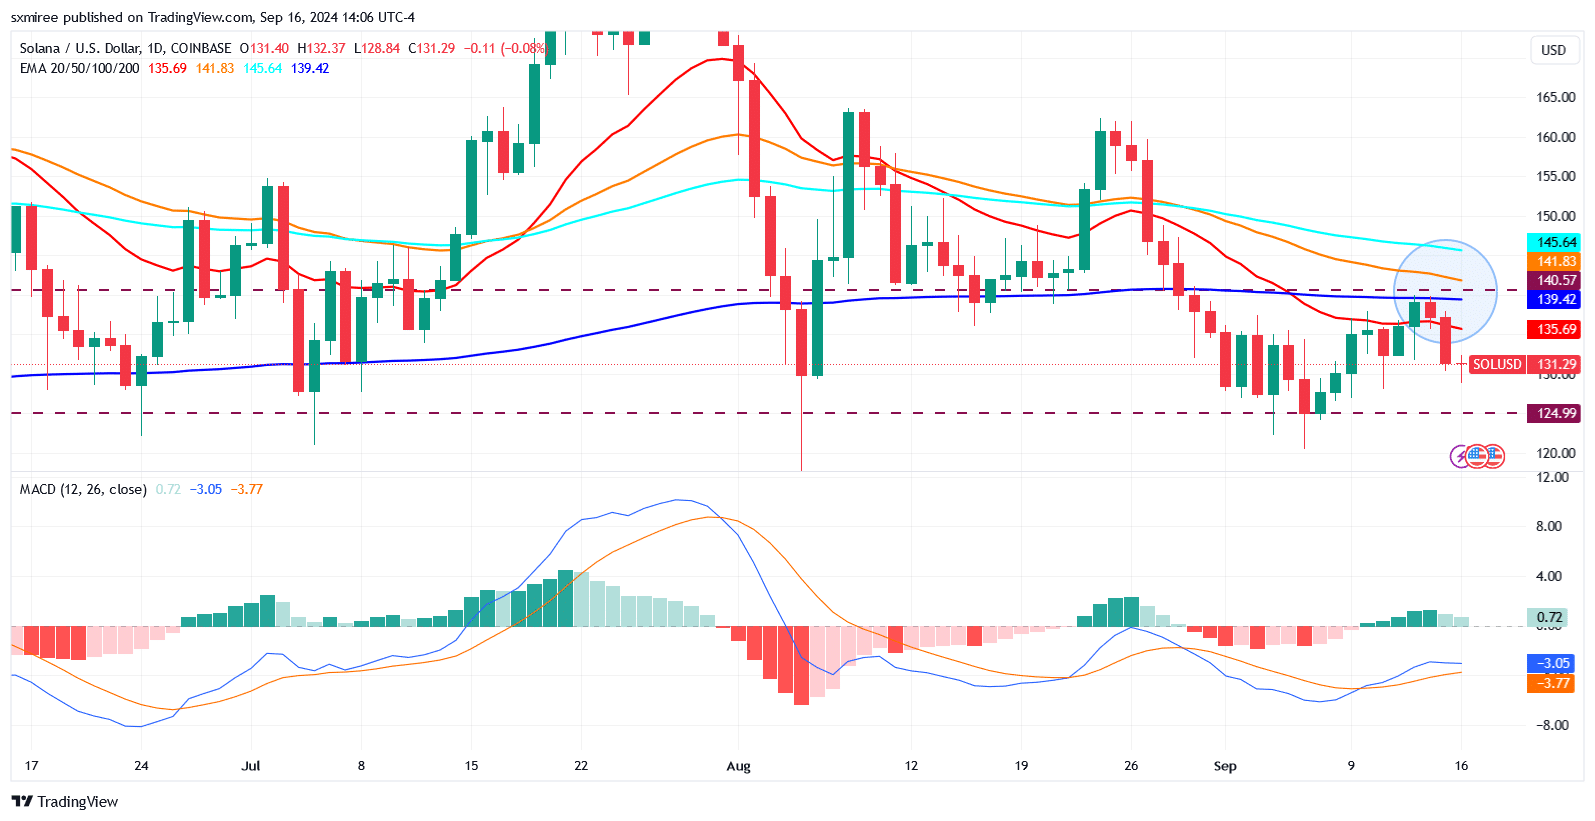
- Solana’s native token, SOL, was on the verge of forming a ‘death cross’ on the daily chart.
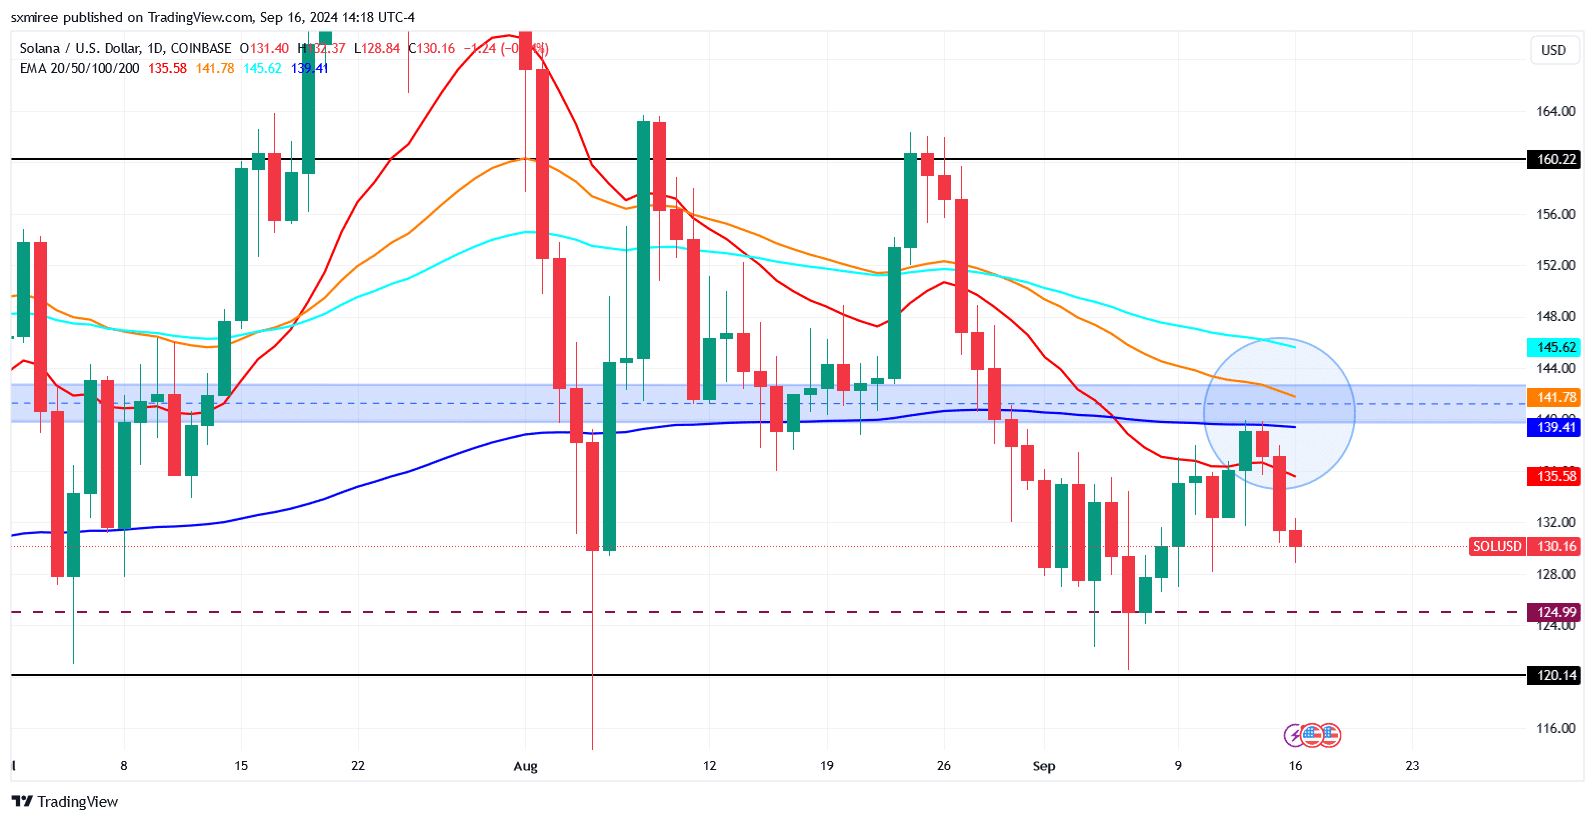
- A decline below the $120 mark could disrupt sustained range trading since March 2024.
Solana’s [SOL] near six-fold price swell over the last 12 months was primarily driven by airdrops and memecoin activity on the blockchain.
This frenzy has seen a pronounced decline over the last few months to extremely low levels.
CoinMarketCap data showed that Solana-based dogwifhat [WIF] and Bonk [BONK] have declined by 64% and 36% since April.
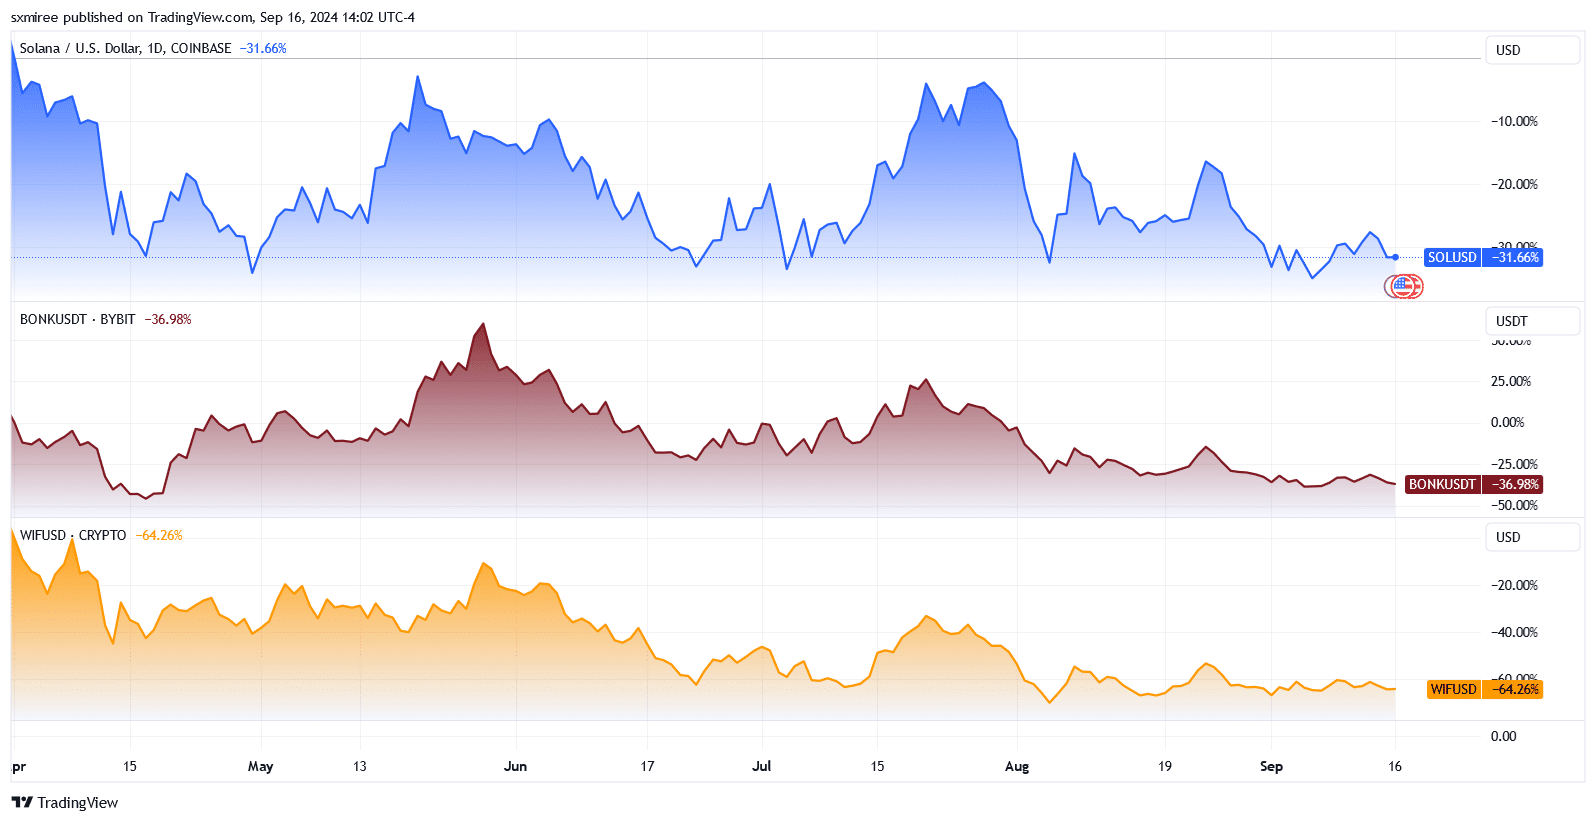
Source: TradingView
Solana has equally struggled – it is down 31% during this period.
Source: TradingView
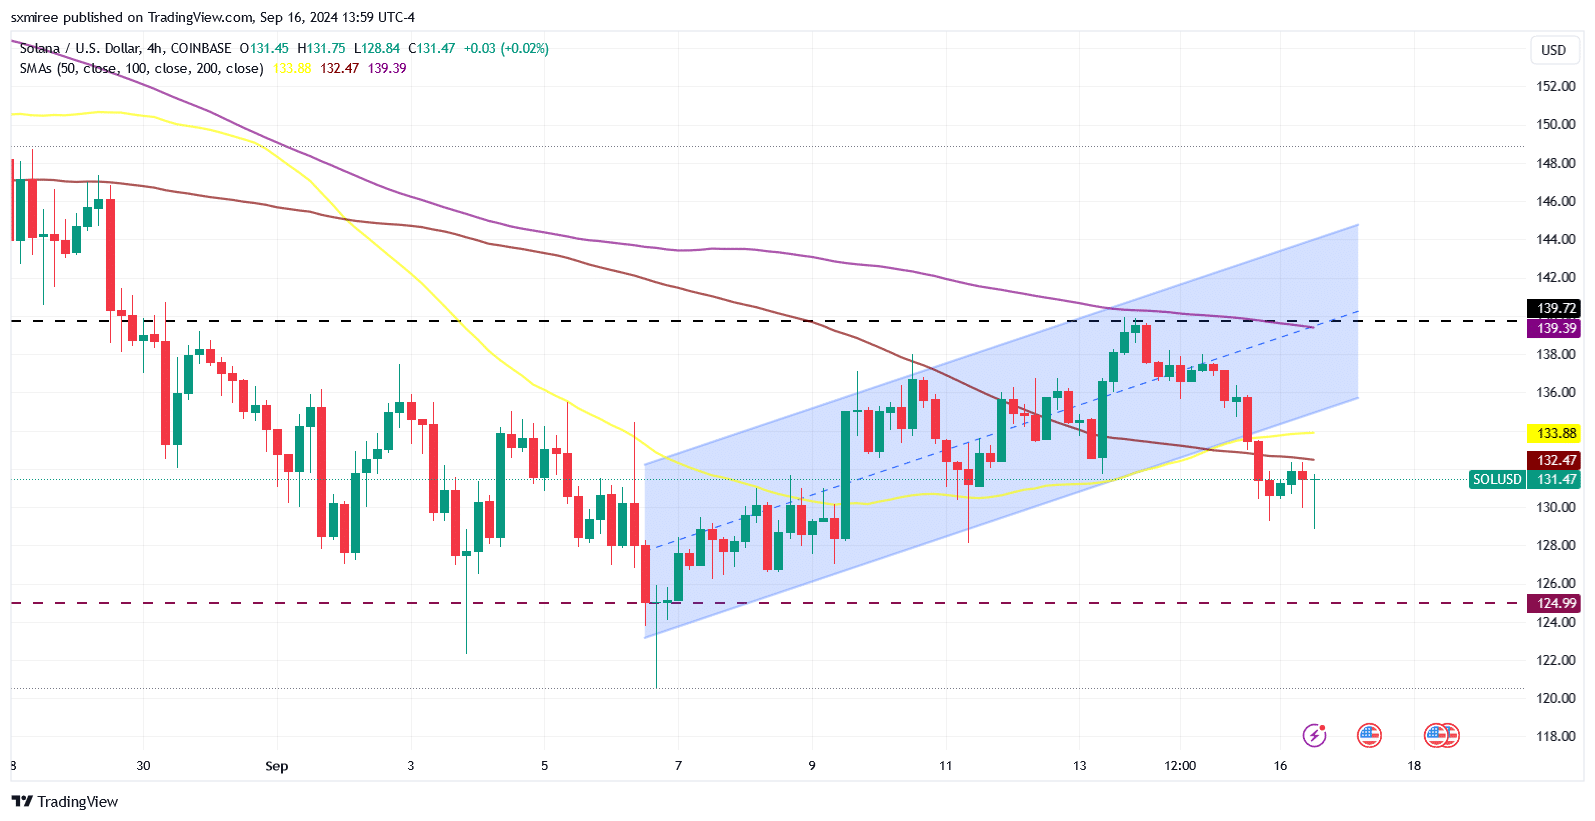
In the most recent display of this weakening short-term price trend, SOL fell outside an ascending channel on the SOL/USD 4-hour chart on Sunday.
A price resurgence could save the day
On the daily chart, SOL/USD is notably on the verge of a “death cross” formation, with the down sloping 50-day Exponential Moving Average (EMA) set to cross below the 200-day EMA.
Such a crossover is typically considered a bearish indicator, signaling potential downward momentum.
A successful death cross formation will add to recent giveaways, signaling that SOL may continue facing increased selling pressure as the longer-term market sentiment shifts to bearish-neutral
. Should the death cross be confirmed, the $120 support level will become the next major focus and determinant of whether SOL will see a deep retracement.
Source: TradingView
A sudden bullish resurgence could disrupt this bearish setup, as false death cross signals are fairly typical.
Bulls steering the price above the $139 resistance could prevent the bearish crossover from playing out and triggering further declines.
Some technical indicators suggest Solana’s macro momentum still subsists.
The Moving Average Convergence Divergence (MACD) formed a bullish crossover last week when the MACD line crossed above the signal line on September 9.
SOL/USD key price levels
Solana was trading at $131 at press time, after a failed attempt to overturn $136 into a strong support zone coming off the weekend.
Markedly, SOL has been unable to convincingly close above $140 since the 30th of August, despite a steady buying activity following the test of the $125 support on the 6th of September.
A successful flip of this level could provide impetus to push SOL upwards toward the critical $160 resistance level.
Source: TradingView
Read Solana’s [SOL] Price Prediction 2024–2025
Meanwhile, the supply zone between the 200-day exponential moving average (EMA) at $139 and the 50-day EMA at $141 presents the immediate hurdle. Chart commentator Dom opined,
“SOL needs to quickly regain the $140 level. Each time over the last 5 months we have swept the lows here, the bounces have become weaker. This time, we have lost the 200 EMA and have failed to quickly regain $140. This keeps me weary of further downfall.”
To sustain any significant price uptrend, SOL must overcome resistance from these moving averages sitting on its upside.