Solana: How this ‘Ethereum-killer’ is quickly taking strides to rally up to 30%

Solana price is showing a confluence of bullish signals that predict an explosive move is on its way. On-chain volume backs up this claim and technical indicators add further weight behind the bullish thesis.
A move back to $100 and higher
Although Solana price has been on a downswing since May 2021, the price action over the last 50 days has resulted in the formation of a bullish pattern. SOL set up three lower lows and three lower highs since 27 January.
Connecting these swing points shows the falling wedge in play. This technical formation forecasts a 23% ascent to $110, obtained by measuring the distance between the first swing high and low to the breakout point. Assuming SOL produces a daily close above $89.25, it will indicate a breakout and project the theoretical target at $110.
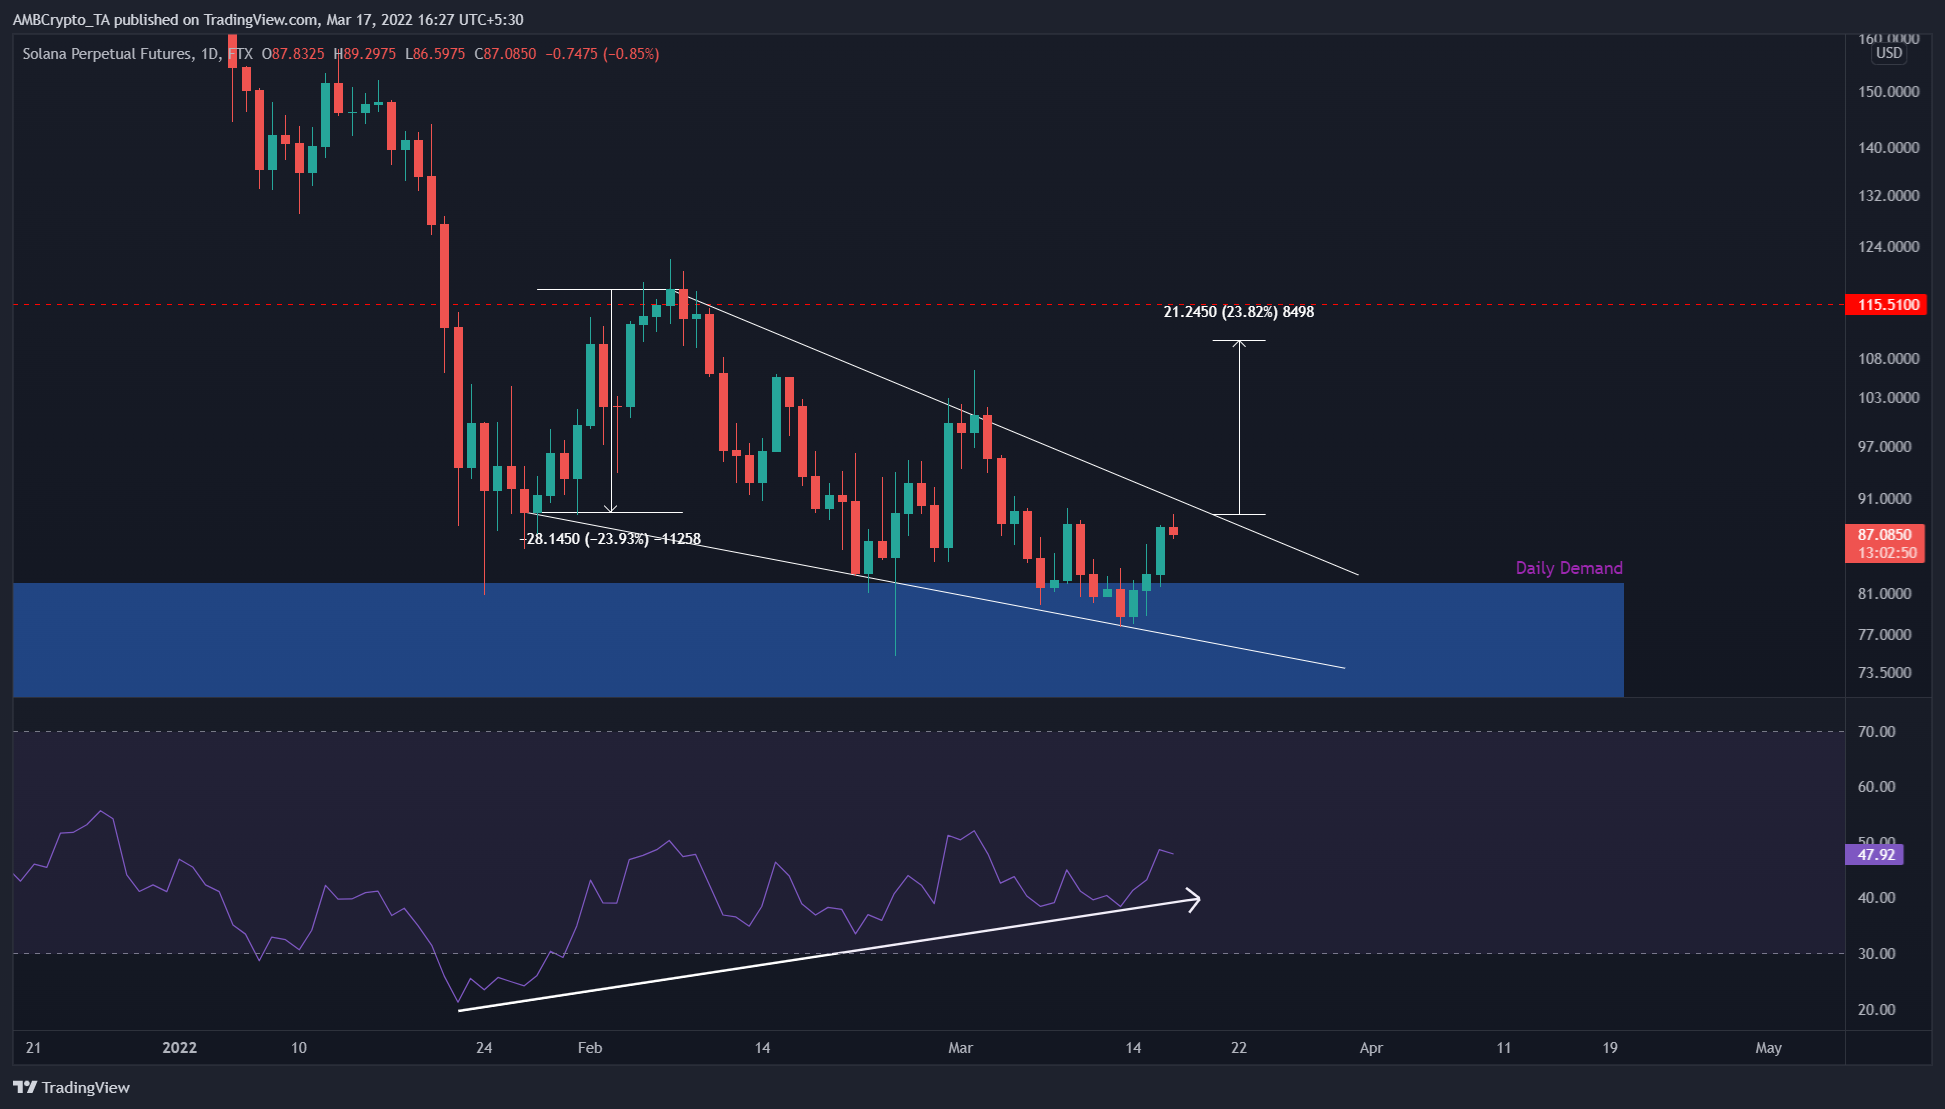
Due to the presence of the daily demand zone, extending from $68.52 to $81.99, the bullish thesis from the falling wedge formation receives a massive boost. The demand zone will give bulls the extra oomph necessary to push higher.
While $110 is the theoretical target, the uptrend could extend to $115, a crucial support-flipped-resistance barrier. This is where the upside for SOL bulls is capped, hence a move beyond this barrier seems unlikely.
Further adding a tailwind to the optimistic outlook is the relative strength index (RSI). This indicator is used to measure the momentum of an asset and can be used to identify potential pivot points based on overbought and oversold conditions.
Since January, 22, the RSI has set up multiple higher lows while the price has formed lower lows, indicating a divergence between them. This is known as bullish divergence as the increase in RSI indicates an uptick in momentum and is often followed by a spike in the asset’s price.
To sum up, Solana price has three confluence points toward a bullish outlook.
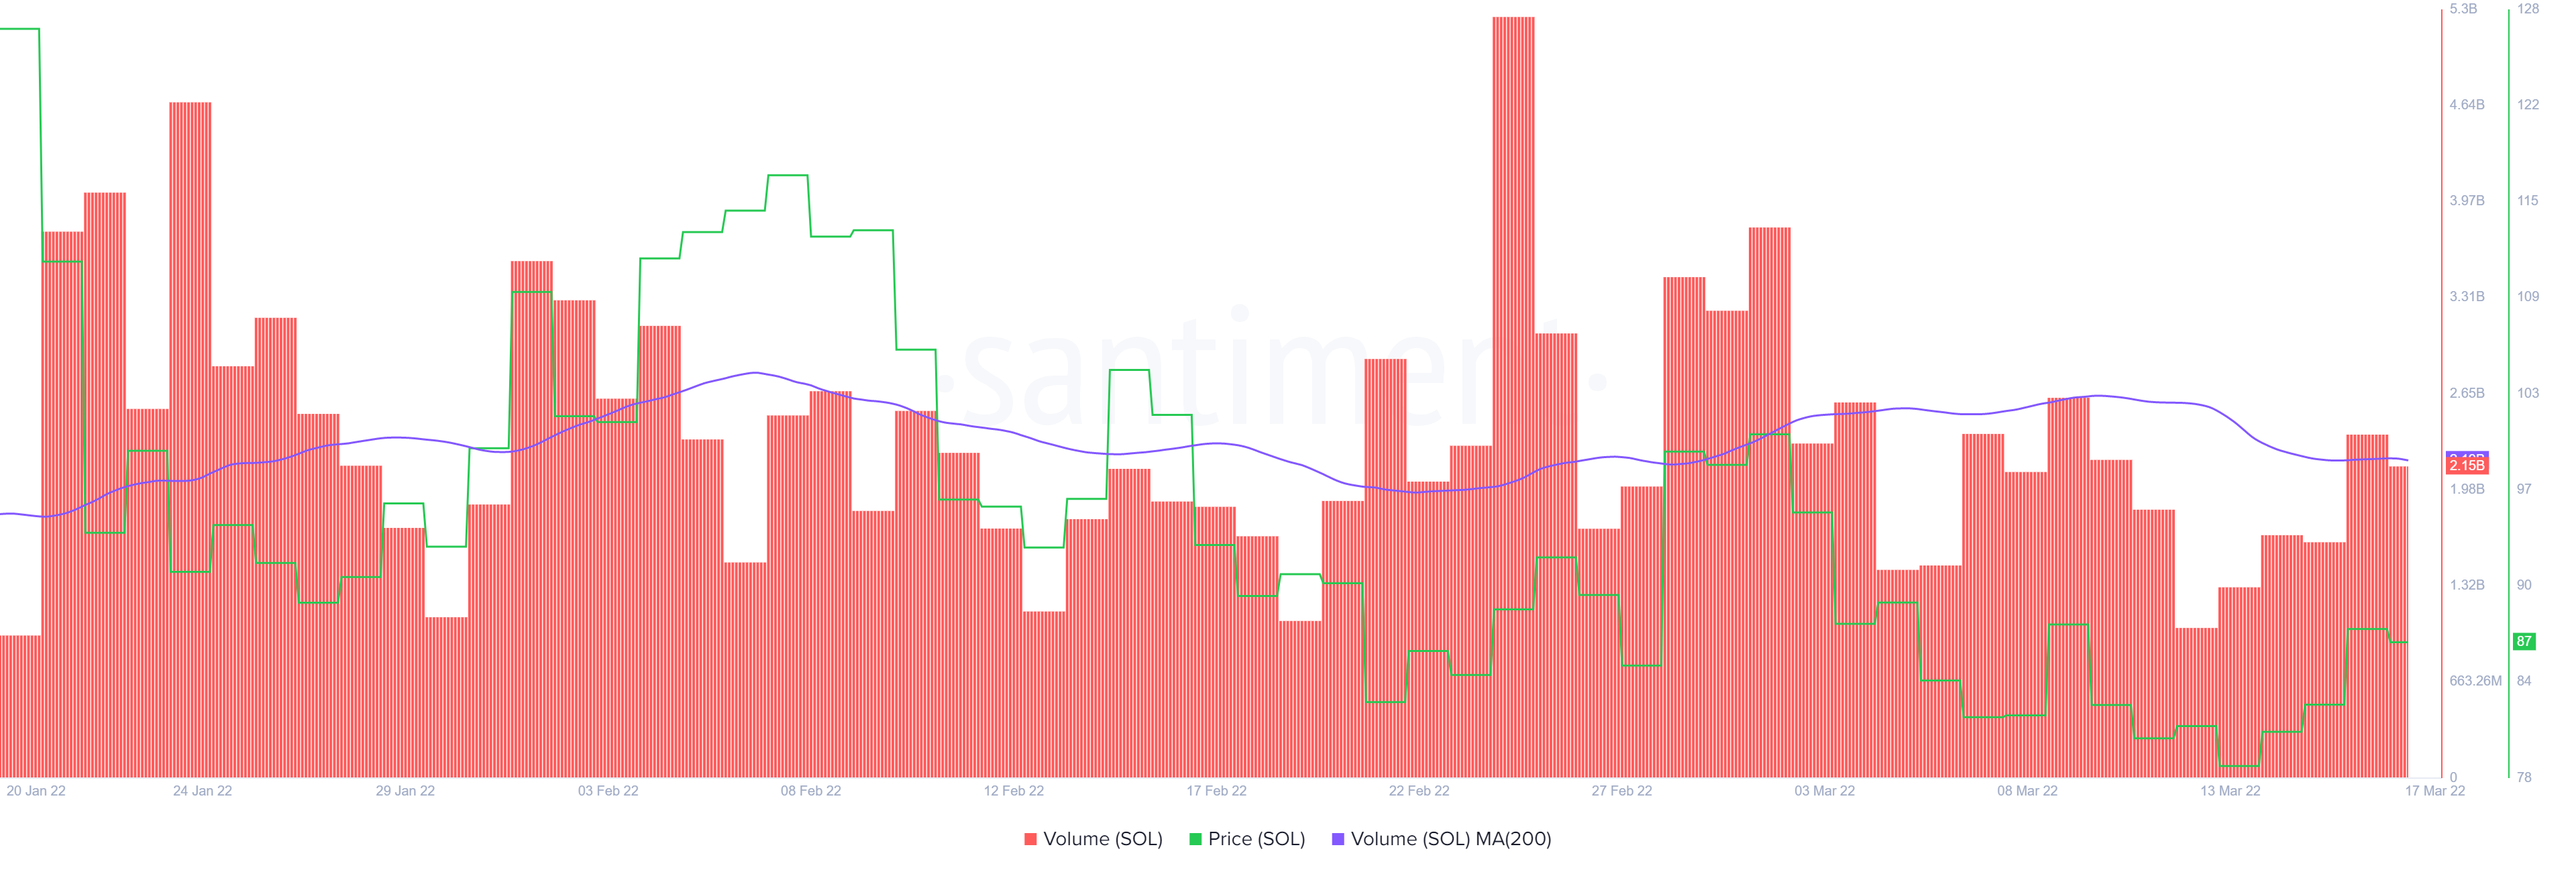
At first glance, the on-chain volume is declining and it does not support the bullish thesis. However, for a falling wedge, declining volume is necessary for an explosive breakout. The constriction of volume, indicates that more retail investors are becoming less interested but come breakout time, SOL will see an explosive breakout since smart money accumulation takes place during the end of downtrends.
Moreover, the demand zone’s presence adds credence to the formation of a bottom anywhere from $68.52 to $82.
Regardless of the bullish outlook, if Solana price produces a daily close below $68.52, it will invalidate the demand zone and falling wedge. In such a case, investors can expect SOL to explore lower in search of support levels.