Solana is back at the highs of a month-long range, what comes next?

Disclaimer: The information presented does not constitute financial, investment, trading, or other types of advice and is solely the writer’s opinion.
- Solana threatened to break out of a range.
- A move back below $26 could encourage the sellers.
Solana made gains of 21% within the past four days. While Bitcoin consolidated beneath the $25.2k resistance, Solana shrugged off any reins and bounded higher. Some key levels were identified for SOL, with $26 being one of these.
Read Solana Price Prediction 2023-24
The indicators and futures markets showed strong bullish sentiment behind Solana. The recent move upward from $23.6 to $26 was responsible for this shift in sentiment. But can the bulls continue to make higher highs?
Range continuation is more likely but $26 will be vital either way
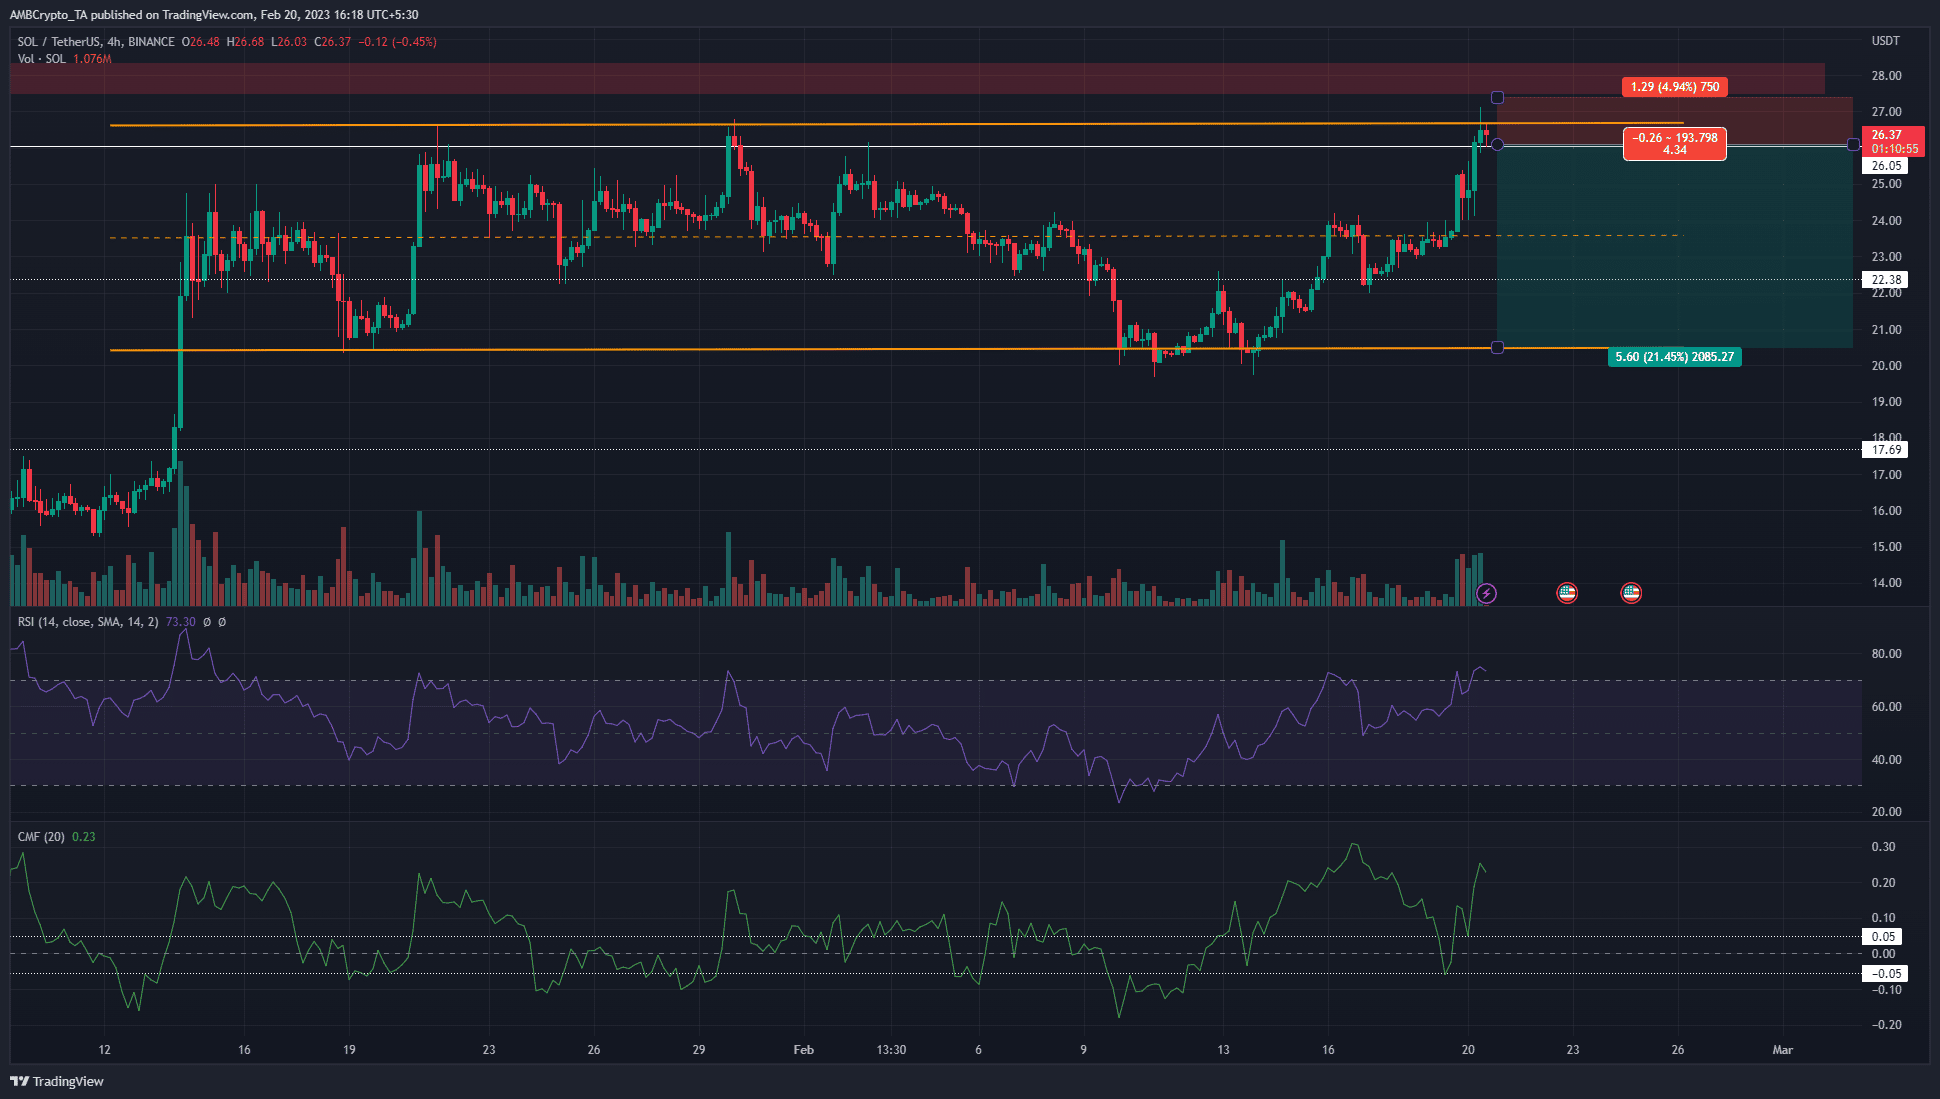
Solana has traded within a range for a month. Highlighted in orange, the extremes of the range lay at $20.5 and $26.7, with the mid-point at $23.6.
At the time of writing, SOL was on the verge of breaking out past the range highs. To the north, some resistance lay in the $27-$28 area.
However, a bullish breakout will likely see this zone breached quickly. The RSI was in the overbought territory to signal strong bullish momentum. The CMF was at +0.23 to show significant capital inflow to the market.
Can we expect a breakout? The evidence at hand showed that although momentum was bullish and demand was present, bulls can rather remain flat than buy Solana.
Based on a risk-to-reward approach, buying the asset before a breach of the range high was not feasible. Bulls can wait for a 4-hour session close above $27, and a retest of the $26.5-$27 area to buy. A stop-loss can be set below $25.4 in that scenario.
Is your portfolio green? Check the Solana Profit Calculator
Until then, a rejection at the range highs was more likely. A session close below $26, followed by a retest of the same level as resistance, would signal a move toward $23.6 was imminent. Further losses can also be seen provided Bitcoin faced a wave of selling.
The rapid rise in Open Interest showed bullish participants from $23
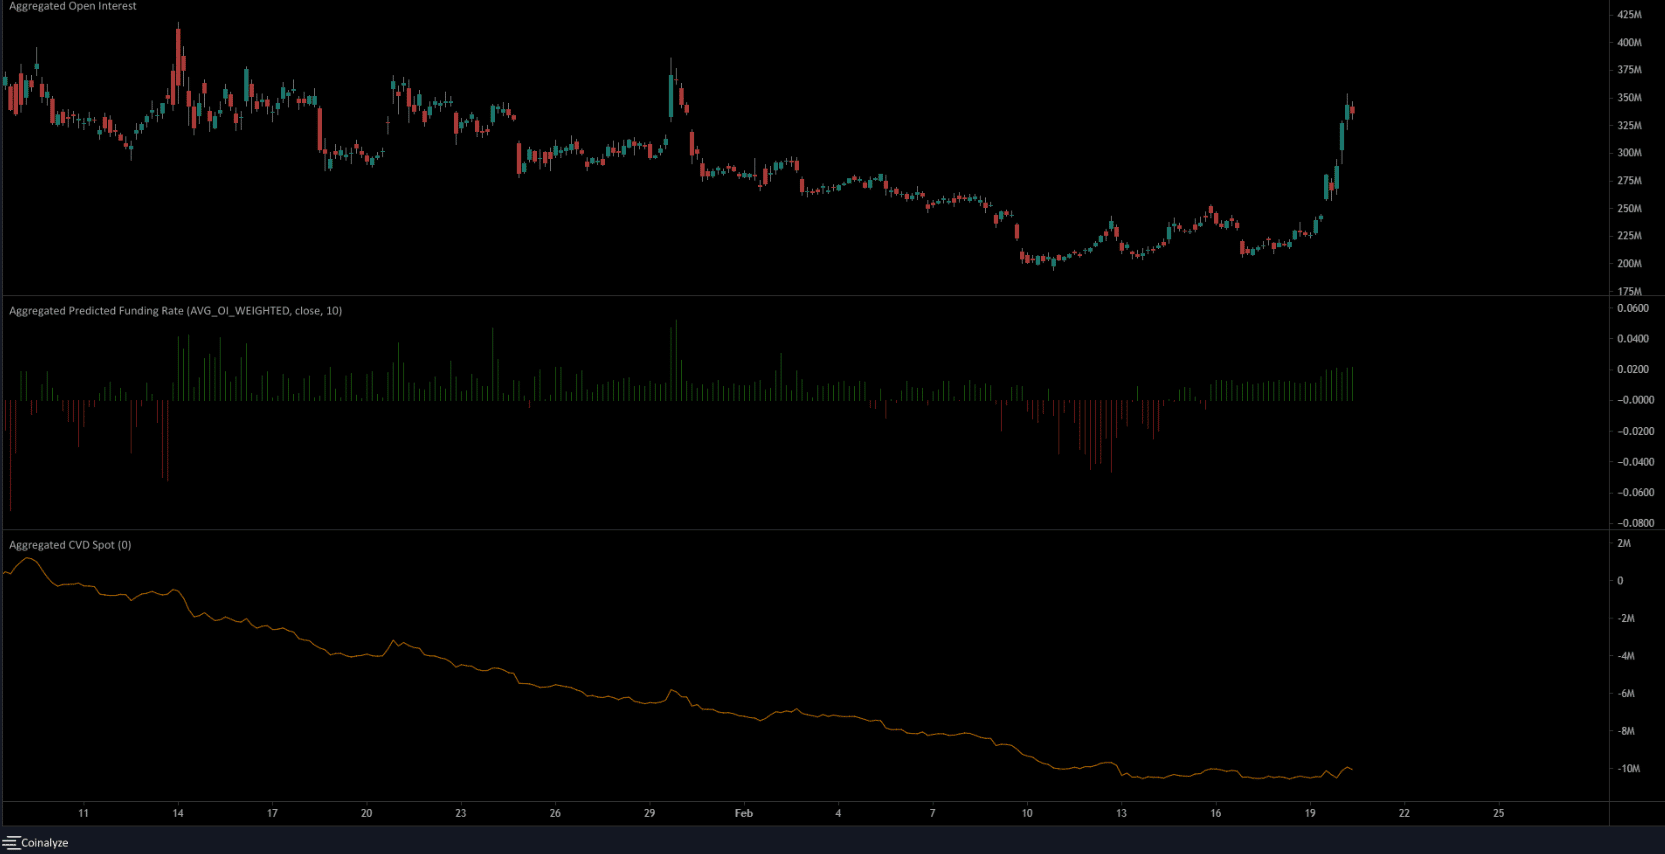
The mid-range mark has acted as a level of strong support and resistance over the past month. Therefore, when SOL surged past $23.6 on 19 February, it was accompanied by a spike in the Open Interest. This signified bullish sentiment and an influx of capital.
On the other hand, the spot CVD has been flat over the past week. This was a sign that bulls do not control the market, although it does not rule out a Solana breakout by itself. The predicted funding rate was also positive to highlight the bullish sentiment.