
Ethereum – Can investment advisors’ $1.35 billion bet push ETH above $5K in Q3?
Analysis

Solana price prediction – Here’s where you can find SOL’s short-term targets
Posted:
Journalist

- Altcoin’s price respected the 4-month range formation once again
- A short-term price dip can be anticipated
Solana [SOL] made a bullish structure break on the daily chart. The resurgence of Bitcoin [BTC] over the past week gave Solana bulls hope, but the technical indicators were not on board with this idea.
In the first week of September, SOL dropped by 13.13% from its highest point of $138.13 to $120 on Friday, 6 September. Since then, it has bounced by close to 15%, recovering all the losses made over the previous week.
Mid-range resistance as the take-profit target
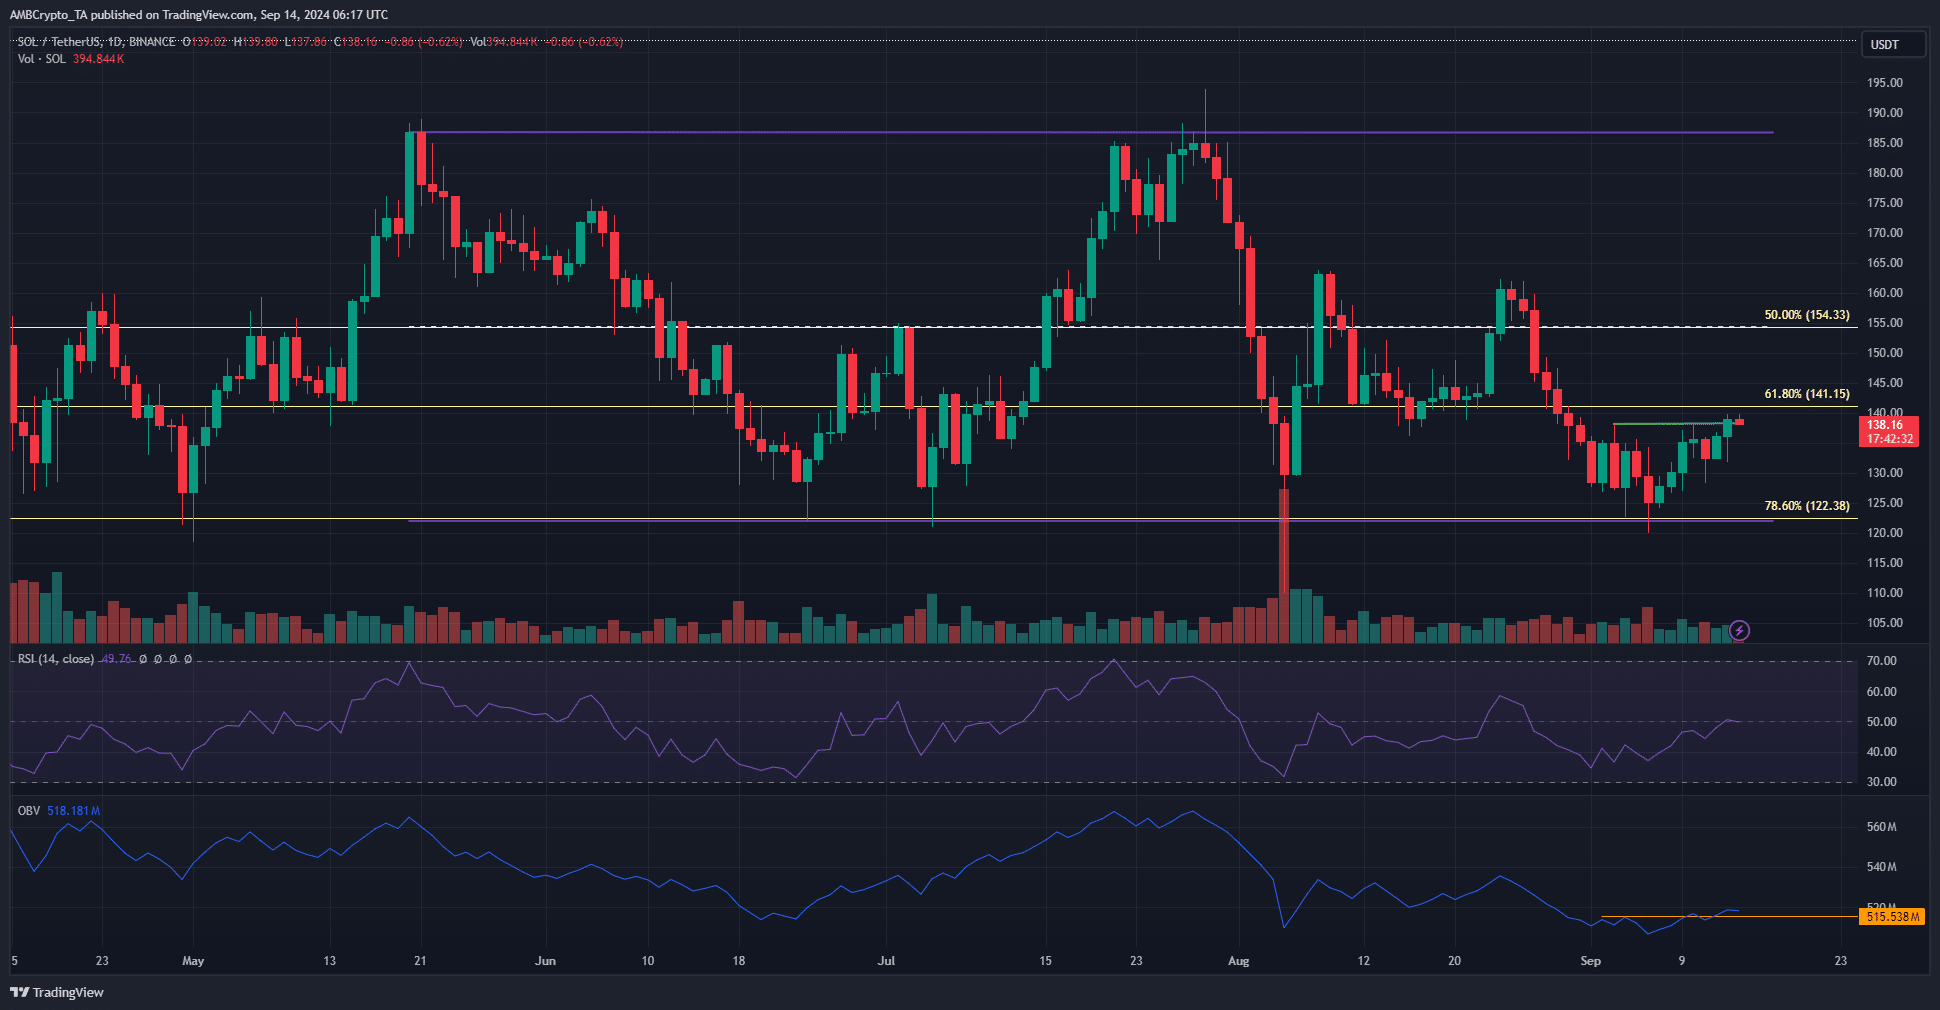
Source: SOL/USDT on TradingView
The range formation (purple) extended from $122 to $187, with the mid-range level at $154.33. The recent revisit to the range lows was the fourth occurrence since June.
The bullish market structure was accompanied by greater buying volume, as seen on the OBV which broke above the previous week’s highs. The RSI was also on the verge of moving above neutral 50. Together, there were encouraging signs that SOL may be poised for a sizeable rally.
The mid-range level at $154 is the next target, and even this could be ambitious since Bitcoin might falter around the $61k-$62k resistance zone. A BTC rejection would drag the altcoin market down, and SOL with it.
Get ready to buy the next dip
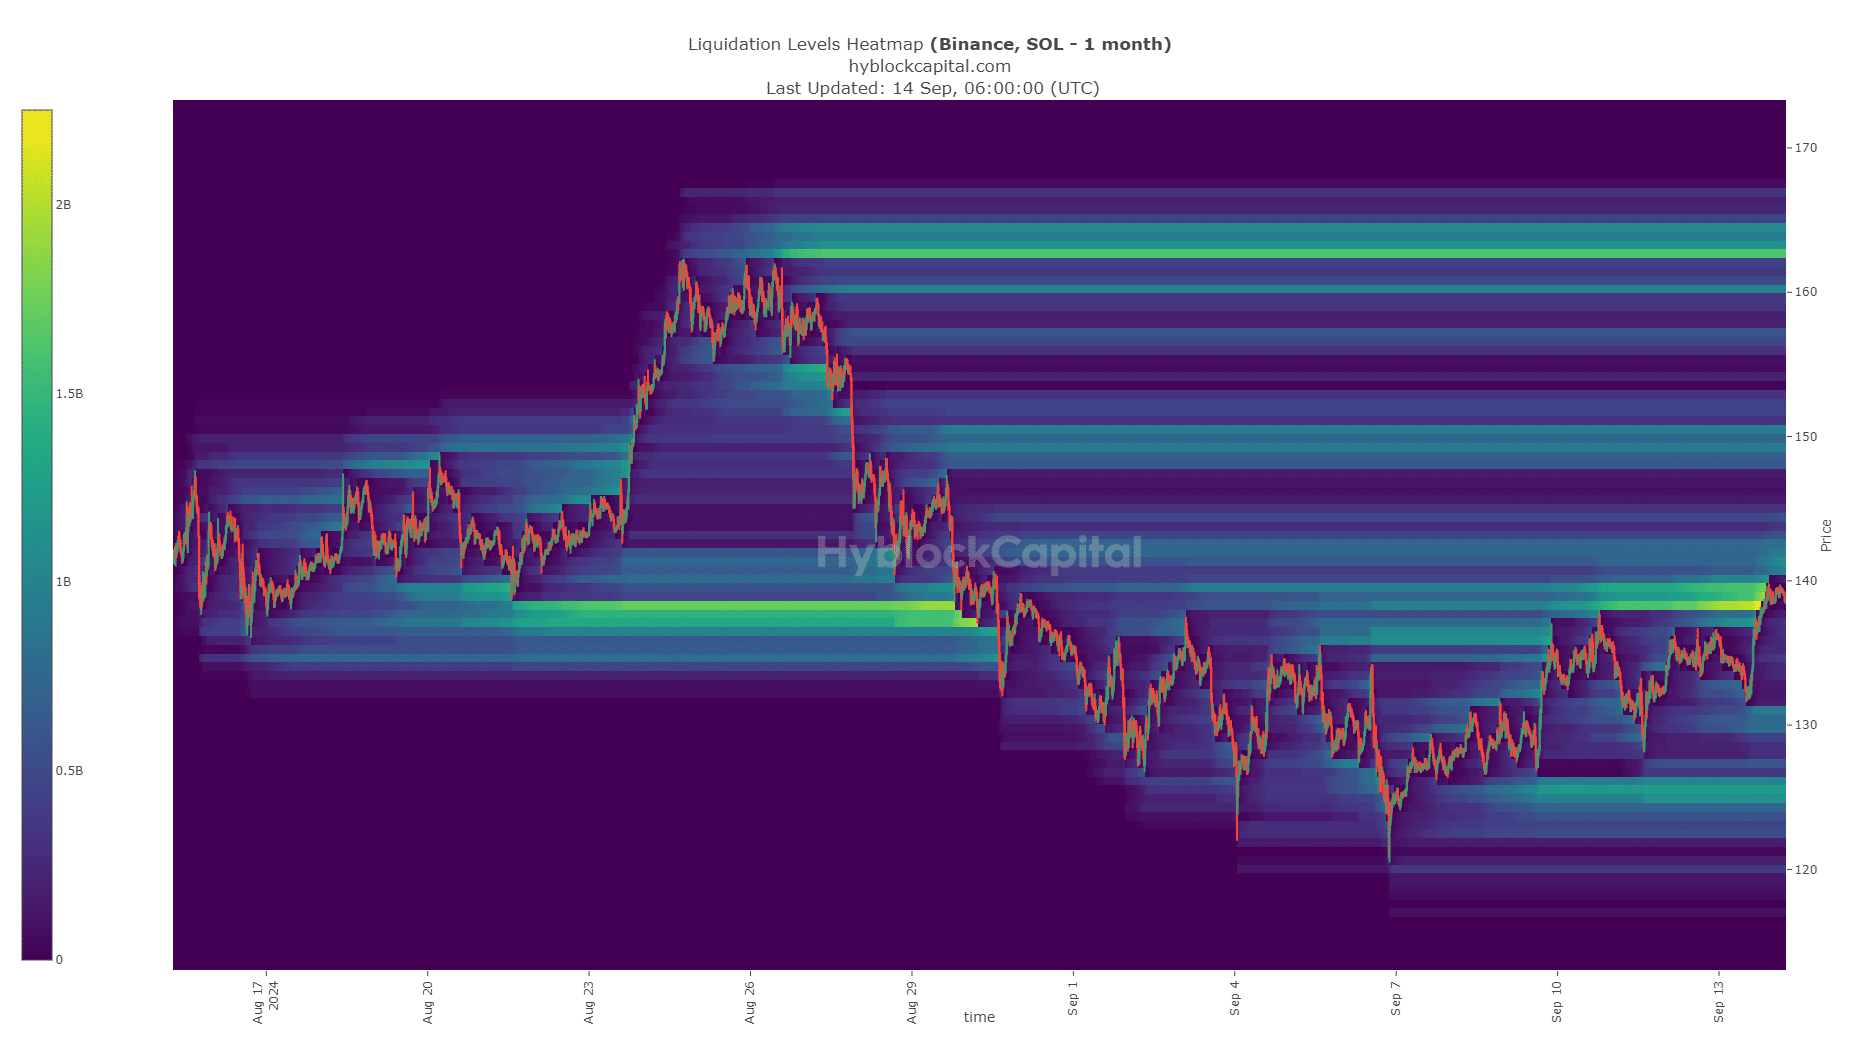
Source: Hyblock
The liquidity pocket at $138-$140 was swept during the most recent price move upwards. The $142 and $150 levels are the next liquidity targets, but Solana might not advance directly to these targets. Instead, a short-term dip appeared likely.
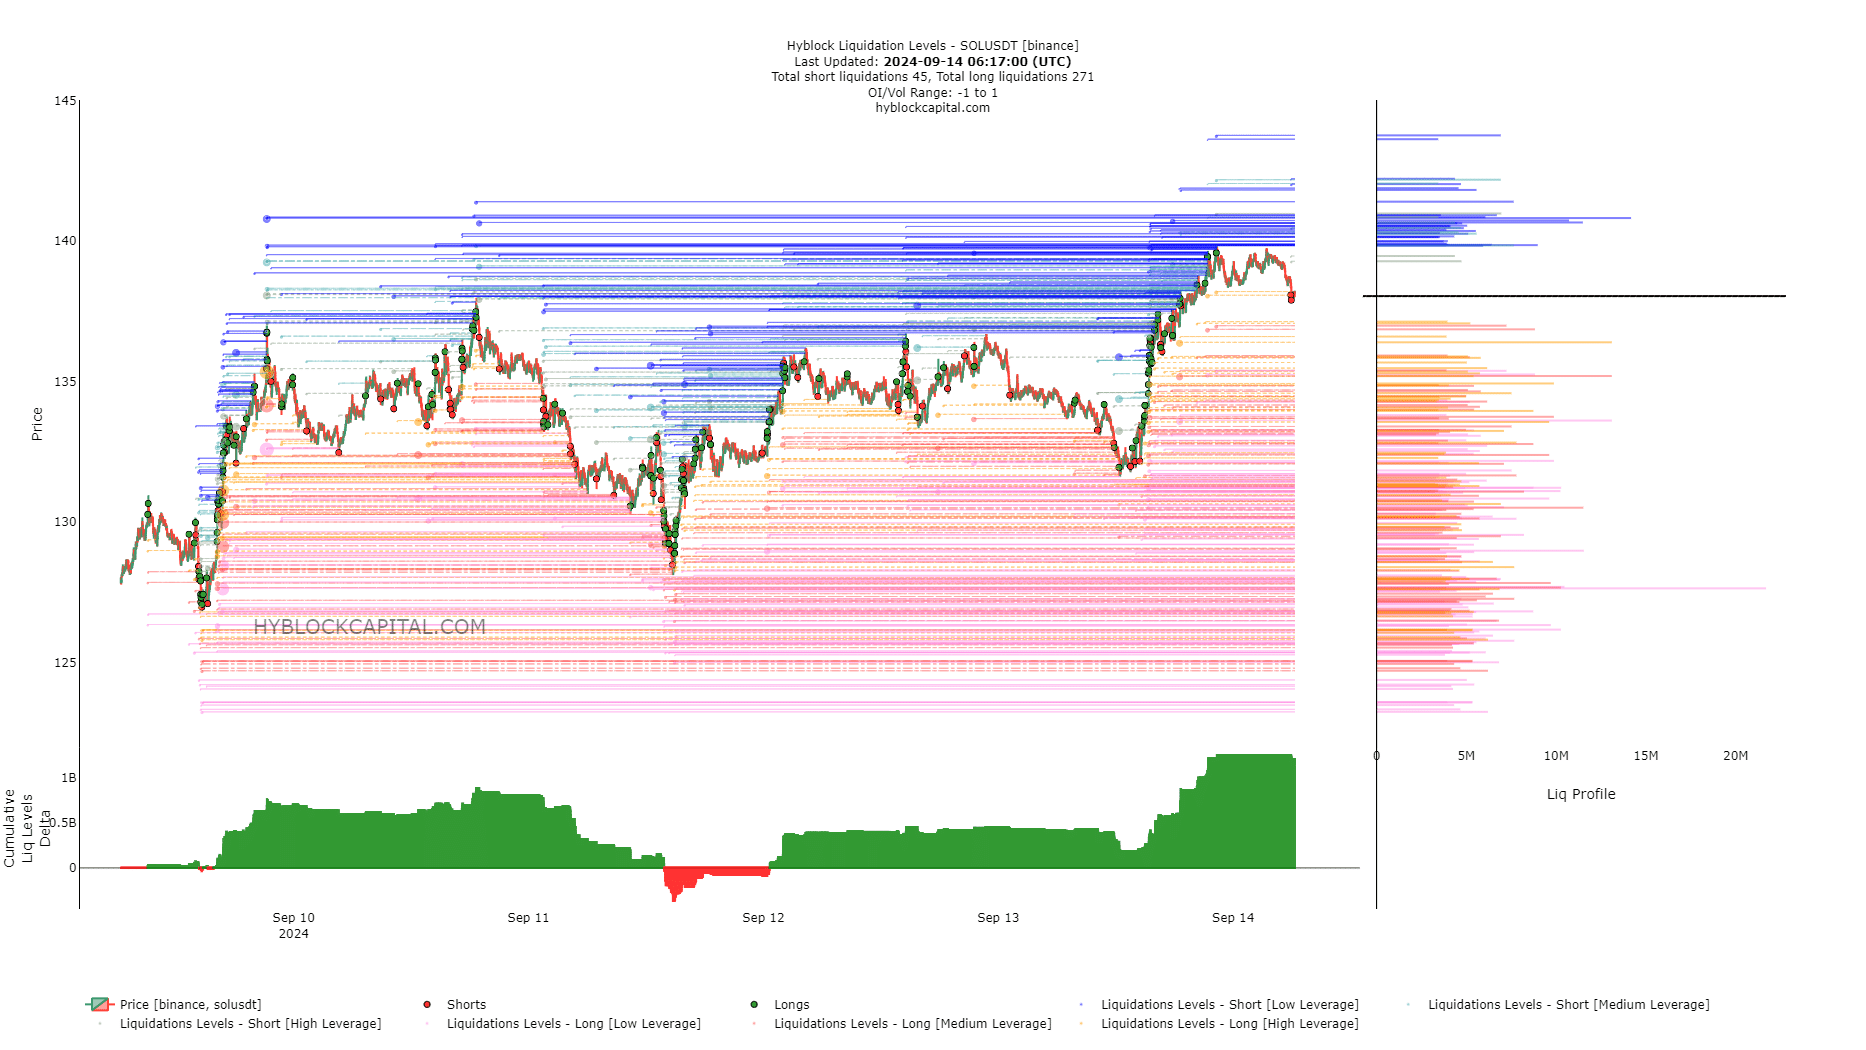
Source: Hyblock
This was because the liquidation levels were skewed bullishly in the short term. At press time, the cumulative liq levels delta was highly positive, showing a large imbalance toward long positions. This usually results in a price squeeze in the opposite direction to collect liquidity.
Read Solana’s [SOL] Price Prediction 2024-25
AMBCrypto also found that the $133 and $135 levels were the short-term targets based on the liquidation levels chart. A retest of this zone could present a buying opportunity, but buyers would have to wait for lower timeframe signs of a bounce.
Disclaimer: The information presented does not constitute financial, investment, trading, or other types of advice and is solely the writer’s opinion


