- Solana may be lacking the steady buying pressure to re-establish the kind of momentum seen in Q4 2024
- Liquidation heatmap warned of a potential price fall to $160
Solana [SOL], at the time of writing, was met with resistance around the $205-zone once again, a short-term resistance zone that has been in place for a week. In fact, the daily chart revealed high volatility for Solana after strong gains towards the end of 2024.
SOL has oscillated between $180 and $260 since November, and neither price level has been overhauled by market participants. At press time, the bullish order block on the daily chart at $180 remained a vital support zone.
The high percentage of long positions among top traders may be an encouraging short-term signal. Whale activity seemed to give some bullish signs too.
Solana bulls lack the strength to scale $220
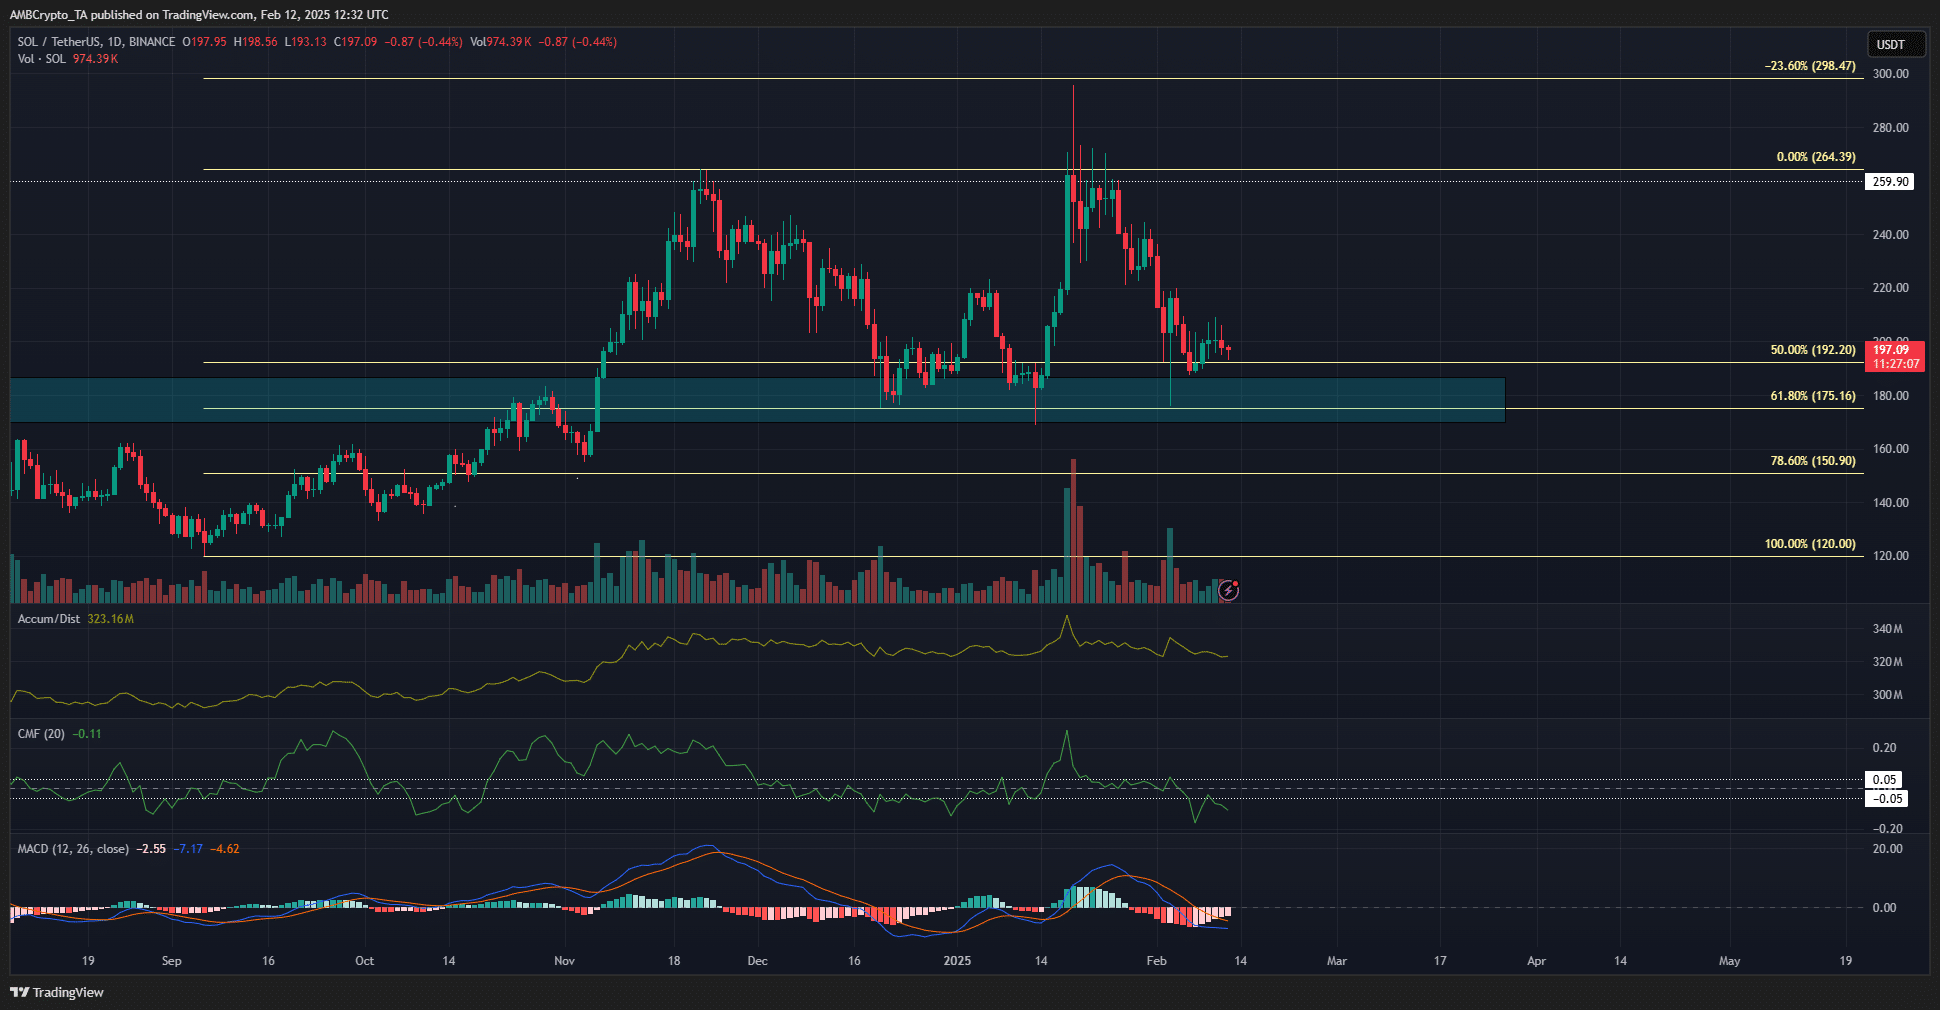
Source: SOL/USDT on TradingView
Despite the price bounce from $188 a week ago, it was not enough to spur a recovery on the charts. The CMF was below -0.05 to indicate heavy capital flows out of the market. The A/D indicator has lacked a trend since November, mirroring the oscillatory price action.
At press time, the MACD was below zero and highlighted that bearish momentum was dominant on the daily chart. This went hand in hand with the market structure, which has been bearish since the descent below $242 in the final week of January.
However, despite the gloom around the higher timeframe price chart, Solana retained a bullish long-term bias. The $175 and $150 Fibonacci retracement levels remained intact too. As long as this remains the case, another rally towards $260 and beyond could materialize.

Source: Coinglass
The 3-month liquidation heatmap revealed that the $160-$165 region had a large number of liquidation levels. This magnetic zone could pull Solana to it as price is drawn to liquidity.
Swing traders and investors need to watch out for a drop below the $190-zone. A renewed wave of sour sentiment around Bitcoin [BTC] could also pave the way for a SOL freefall. On the bright side, a retest of $150-$160 would be a long-term buying opportunity for those who believe this cycle is not yet done.
Disclaimer: The information presented does not constitute financial, investment, trading, or other types of advice and is solely the writer’s opinion