Solana, SAND, EOS Price Analysis: 17 May

The altcoin market saw a slight uptick over the last five days after most altcoins’ four-hour technicals swooped into the oversold mark. Consequently, Solana flashed a bullish edge after breaking out of its falling wedge. However, its current up-channel still carried a reversal threat in the short term.
On the other hand, SAND and EOS grew by marking a bearish pennant whilst displaying a neutral stance on their technicals.
Solana (SOL)
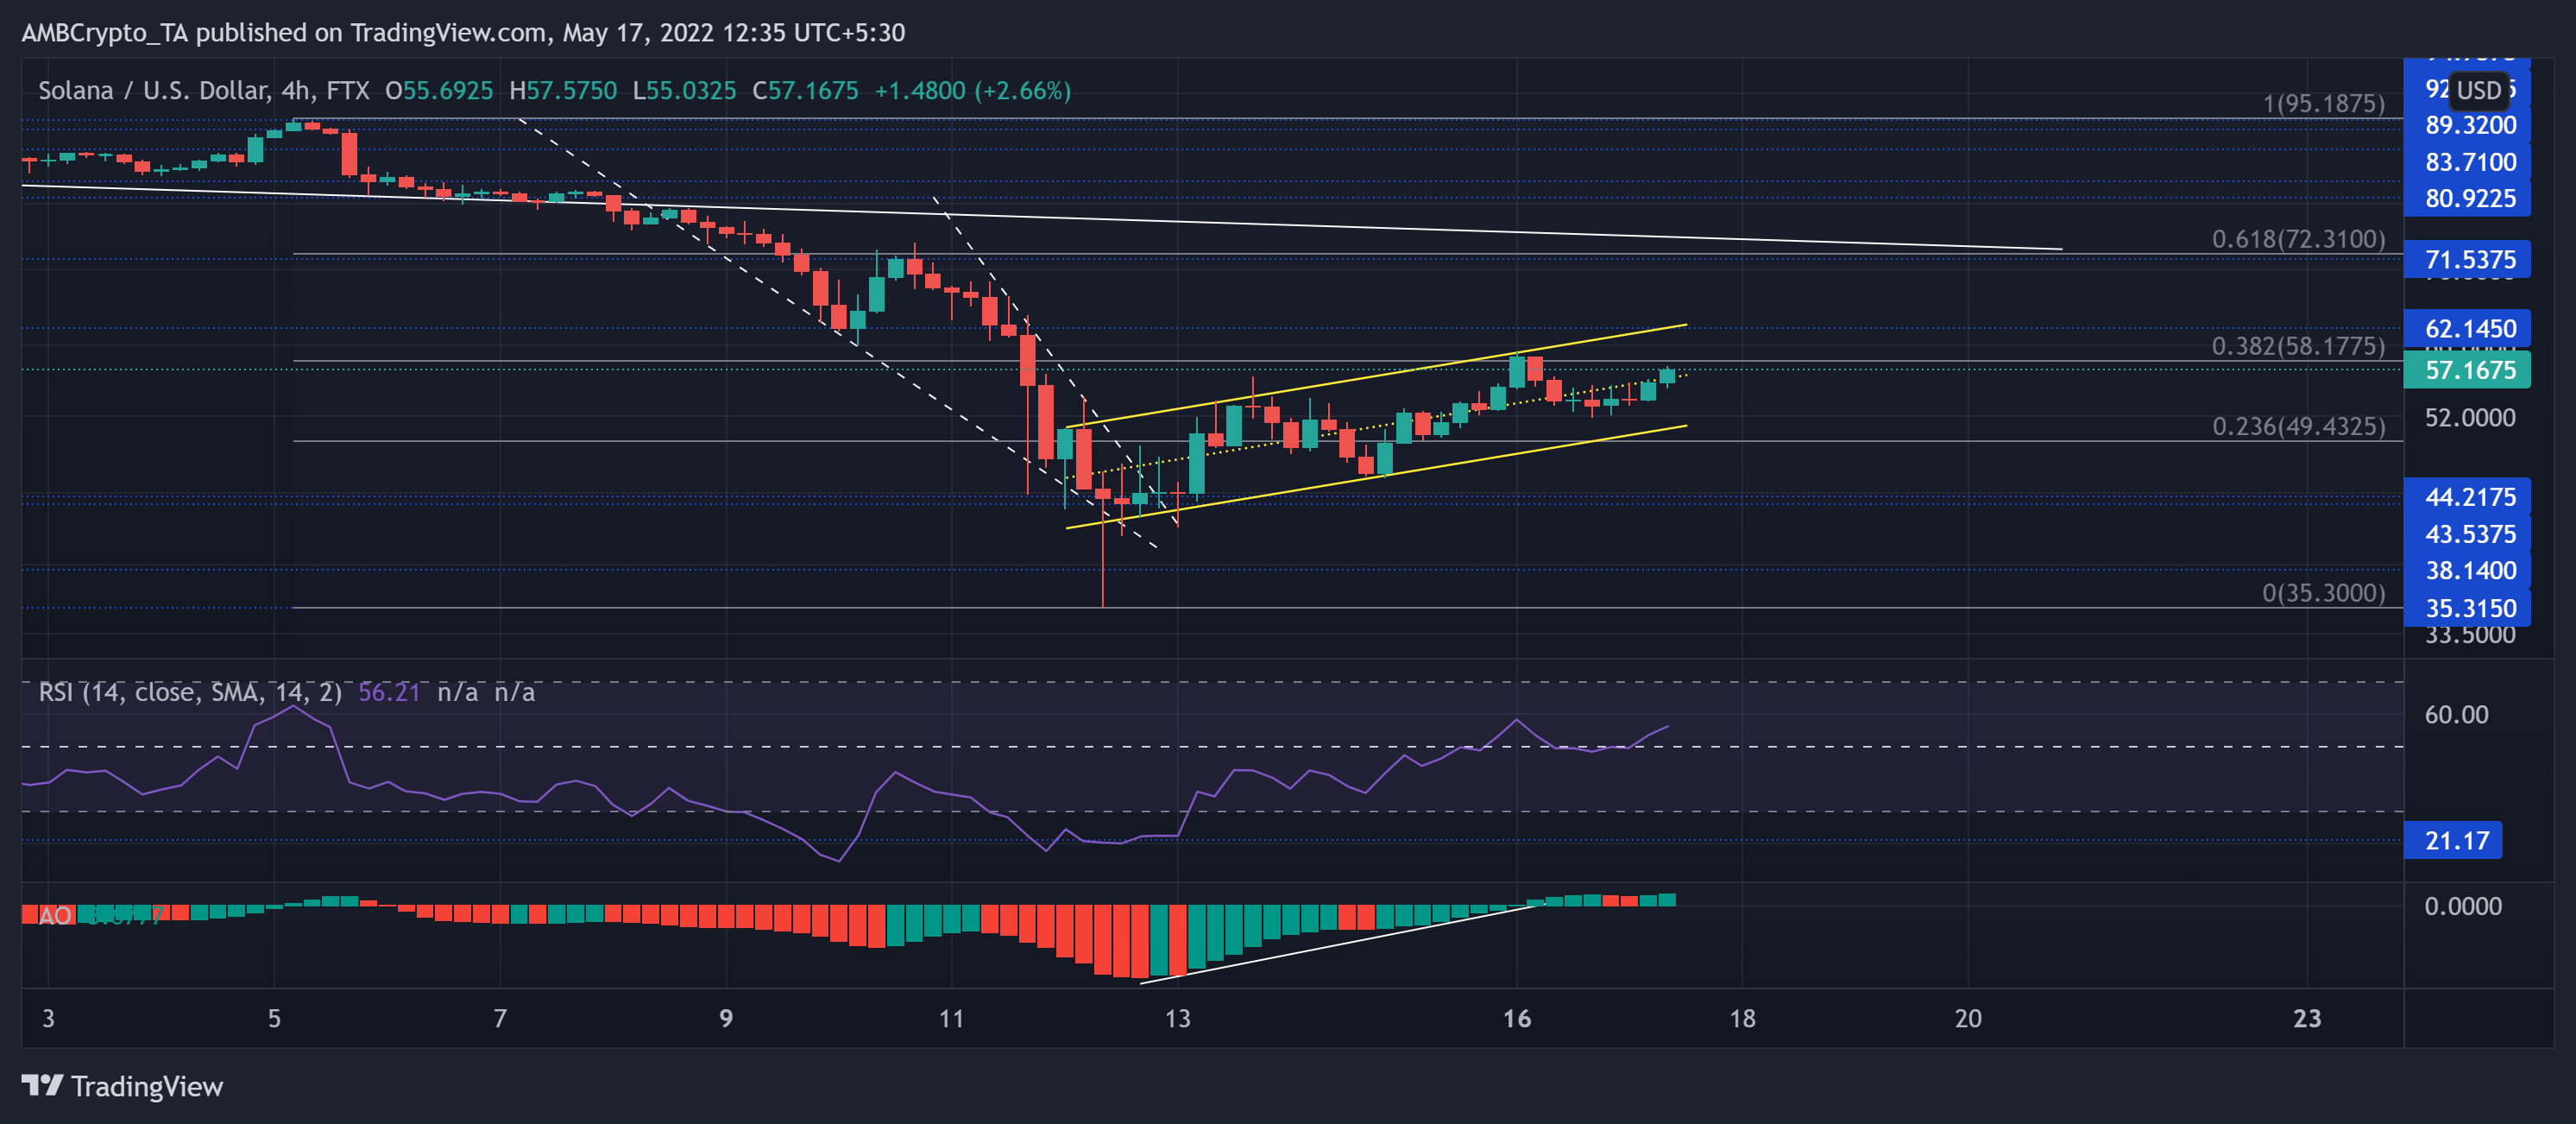
SOL’s breach of its five-month trendline resistance (white) paved the way for a bear run that accounted for a 55.4% decline within the bounds of a falling wedge. With a massive selling pressure kicking in, the alt dived toward its nine-month low on 12 May.
As the buyers were eager to defend the $43-support, SOL saw an expected falling wedge breakout. While the 38.2% Fibonacci resistance held up well, the sellers have constricted the recent buying rallies in the $58.17-zone.
At press time, SOL traded at $57.1675. The alt’s RSI recorded a steady growth after recouping its power from the oversold zone. As a result, the index found a position above the midline while favoring the bulls. Furthermore, the AO formed bullish twin peaks that helped the oscillator jump above the zero-mark.
The Sandbox (SAND)
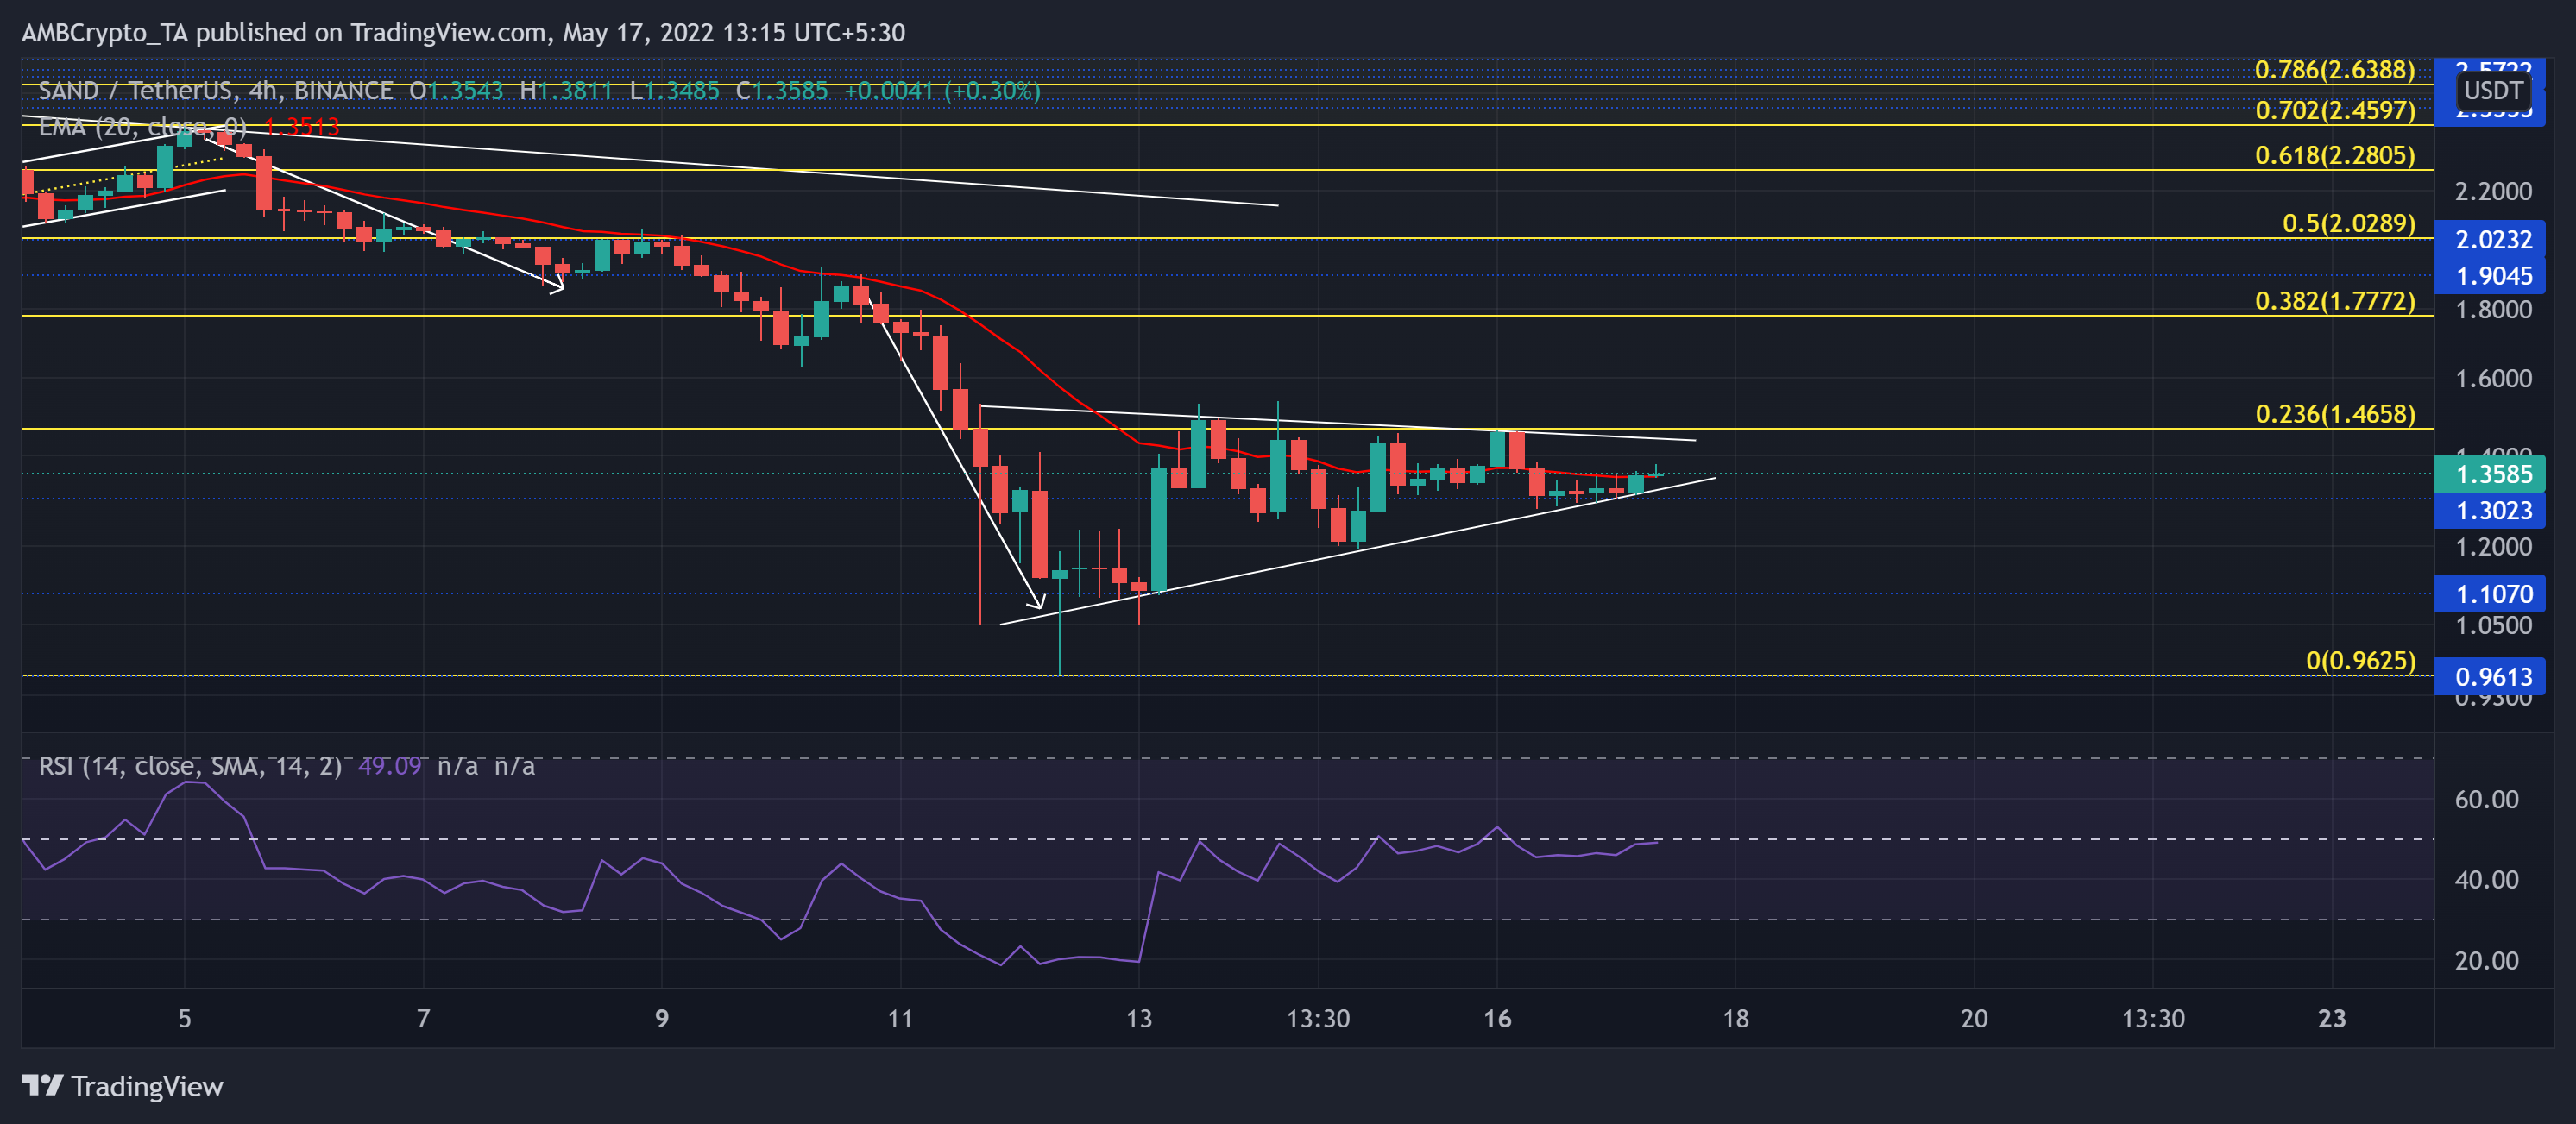
After the 70.2% Fibonacci resistance refuted the up-channel buying rally, the sellers re-navigated the trend in their favor by pulling the price all the way to the $1.1 baseline. Since then, the 23.6% level has shunned multiple recovery attempts.
Now, the altcoin witnessed a bearish pennant on the 4-hour timeframe. A sustained reversal below the 20 EMA (red) could be detrimental to the buyers in the short term.
At press time, SAND traded at $1.3585, up by nearly 4% in the last 24 hours. The RSI swayed near the midline to flash neutrality for the last few days. An ability to find a robust close beyond the 50-mark would help sellers gain thrust to propel a break down below the $1.3-mark.
EOS
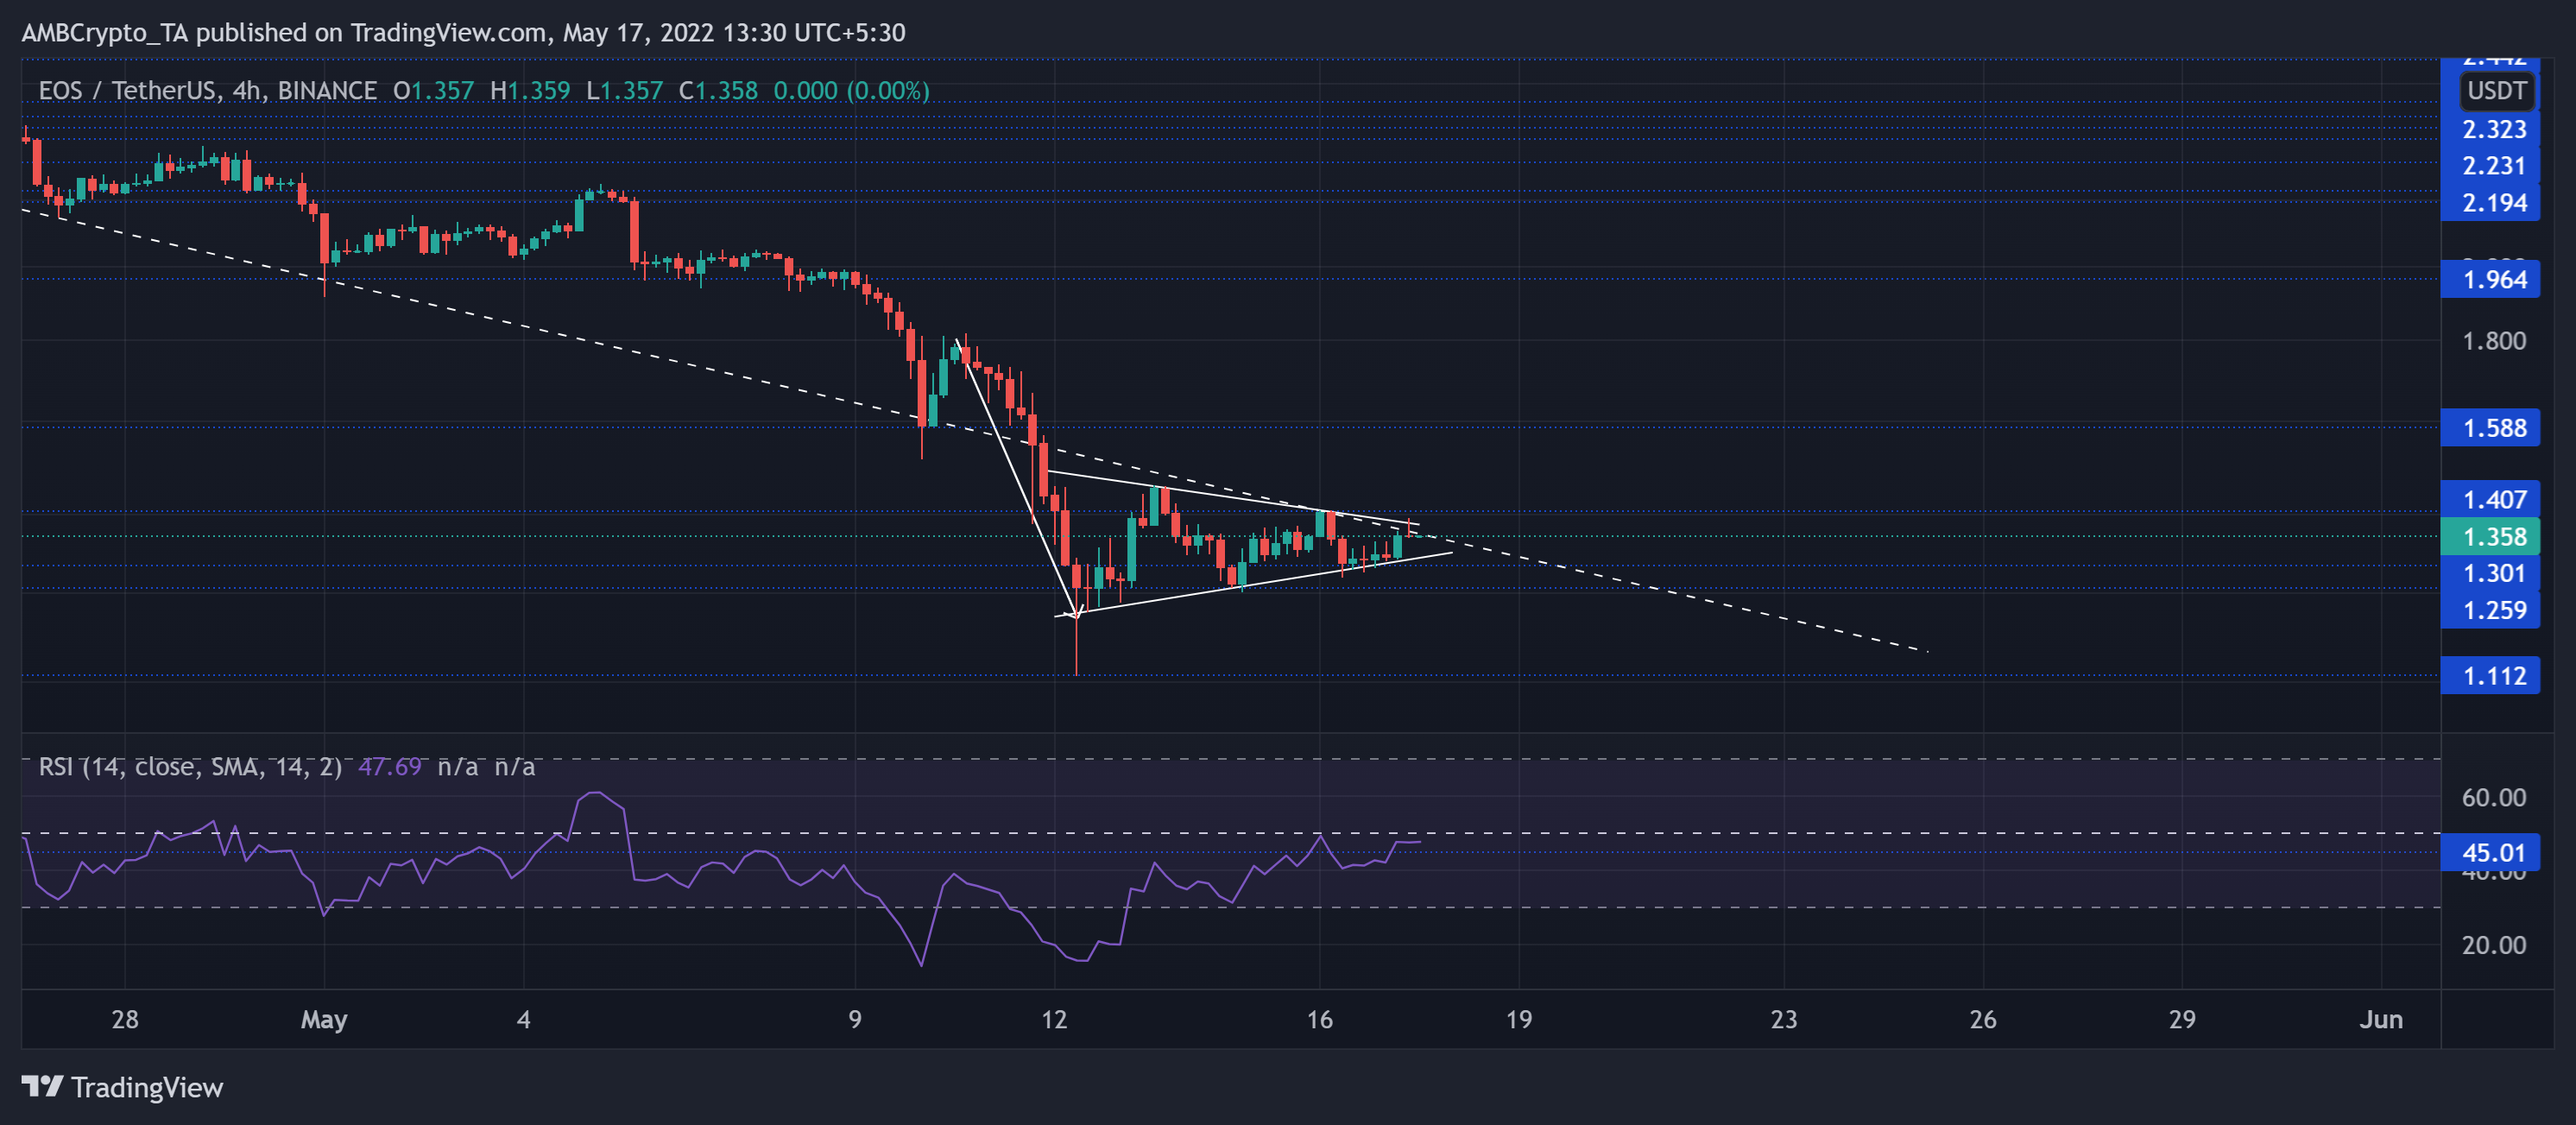
EOS saw a decline of about 61% (from its April highs) until the bulls displayed strong rejection of lower prices in the $1.1-$1.2 range. This fall was triggered after the sellers continued to build up pressure at the $2.2 price point.
Now, the three-week trendline resistance could continue to pose an obstruction in the buying comebacks. A fall below this level would affirm a selling edge while hindering the short-term recovery process.
At press time, EOS traded at $1.358. The slightly bearish RSI failed to break above its equilibrium, while the 45-support could offer immediate testing grounds.


